


VARIATION CHARACTERISTICS AND METEOROLOGICAL FACTORS OF OZONE CONCENTRATION IN THE URBAN AREA OF JIANGMEN
-
摘要: 基于2015—2017年广东省江门市城区臭氧浓度监测数据和气象观测数据,结合应用统计分析、聚类分析等方法,分析了江门臭氧浓度特征及气象影响因素,探讨了2017年江门臭氧严重超标的气象成因。2015—2017年,江门臭氧污染程度逐年加重,秋季臭氧浓度均值高于其它季节;37%的臭氧浓度超标日与西北太平洋或南海热带气旋活动有关,显著高于其它天气类型下超标日占比。臭氧浓度与白天气象要素相关性高于夜间,对臭氧浓度影响较大的气象要素有日照、相对湿度、气温。聚类分析得到6类气流轨迹,当气流轨迹为偏东(陆地)和偏北路径时,其受体臭氧浓度均值和污染气流轨迹占比显著高于平均值。2017年臭氧严重超标的气象成因是达到利于臭氧生成的气象条件阈值时数和日数显著高于以往,且途经江门以北和以东陆地的气流数目明显多于以往。Abstract: This study analyzes the characteristics of ozone concentration and its correlation with meteorological factors, as well as the cause of higher ozone concentration in Jiangmen in 2017 based on hourly ozone concentration data and meteorological observation data in Jiangmen urban area from 2015 to 2017, with the methods of statistical analysis and cluster analysis. The results show that the averaged ozone concentration in Jiangmen increased year by year during 2015—2017, and the seasonal variations in ozone show the highest averaged concentration in autumn and lower averaged concentration in winter and spring. Statistics indicate that 37% of ozone pollution events are related to tropical cyclone activity in the Western Pacific or the South China Sea. The correlation between ozone concentration and meteorological factors in the daytime is higher than that at night. The meteorological elements such as sunshine, humidity, and temperature have greater impact on ozone concentration. Cluster analysis shows six types of backward trajectories. Receptor has higher averaged ozone concentration when the airflow comes from eastern (from inland) and northern path. The excessive hours and days with favorable meteorological conditions for ozone production contribute to higher ozone concentration of Jiangmen in 2017, and cluster analysis shows that the number of airflow trajectories whose receptor has higher averaged ozone concentration is a higher than that in previous years.
-
Key words:
- Jiangmen /
- O3 /
- meteorological factor /
- cluster analysis
-
表 1 O3-8h不同级别统计
年份和季节 优(0~100 μg/m3) 良(101~160 μg/m3) 轻度(161~215 μg/m3) 中度(216~265 μg/m3) 重度(266~800 μg/m3) 日数/d 均值/
(μg/m3)日数/d 均值/
(μg/m3)日数/d 均值/
(μg/m3)日数/d 均值/
(μg/m3)日数/d 均值/
(μg/m3)2015年 271 49.1 70 127.2 23 173.1 1 237 0 / 2016年 250 53.9 76 126.0 29 173.1 9 236.4 2 325.0 2017年 218 56.8 80 128.2 42 181.5 21 241.8 4 281.3 春季 202 47.5 42 125.7 20 171.0 10 240.0 2 291.5 夏季 207 57.0 41 128.8 20 177.5 6 244.0 2 309.5 秋季 134 54.1 79 130.0 43 178.4 15 238.6 2 286.5 冬季 196 53.7 64 123.2 11 180.4 0 / 0 /  下载: 导出CSV
表 3 不同天气状况下O3浓度与O3-8 h均值统计
日照时数(S)/h 天气分类 日数(2015年、2016年、2017年)/d O3、O3-8 h/(μg/m3) S≥8 晴 106、96、108 64.6, 118.7 8>S≥4 少云 86、78、95 51.6, 100.7 4>S>0 多云 91、89、66 43.1, 78.4 S=0 阴天 82、103、96 25.7, 41.3 日降雨≥0.1 mm 雨天 127、163、151 33.9, 60.7
下载: 导出CSV
表 4 不同气象要素范围内的O3浓度
相对湿度 O3浓度/(μg/m3) 气温/℃ O3浓度/(μg/m3) 小时雨量/mm O3浓度/(μg/m3) 风速/(m/s) O3浓度/(μg/m3) RH≤50% 119.0 T≤10 32.6 R=0 68.7 WS≤0.2 66.0 50%<RH≤60% 109.6 10<T≤20 42.0 0.1<R≤5 30.0 0.2<WS≤1.5 54.1 60%<RH≤70% 76.9 20<T≤25 65.5 5<R≤10 32.8 1.5<WS≤3.3 69.5 70%<RH≤80% 52.2 25<T≤30 62.4 10<R≤20 40.8 3.3<WS≤5.4 63.7 80%<RH≤90% 35.4 30<T≤35 92.0 20<R≤30 41.5 5.4<WS≤7.9 57.8 RH>90% 23.0 T>35 145.7 R>30 49.8 WS>7.9 44.3
下载: 导出CSV
表 5 O3-8 h与逐日气象要素相关性
气象要素 日照时数 相对湿度 最高气温 日雨量 风速 相关系数 0.49* -0.48* 0.33* -0.19* -0.17* 注:表中*表示相关性通过0.001的显著性水平检验。
下载: 导出CSV
表 6 2015—2017年不同气流轨迹及对应O3浓度统计
聚类数 途经区域 轨迹条数 O3浓度
/(μg/m3)频率/% 污染气流
轨迹条数污染气流轨迹下O3
浓度/(pg/m3)污染气流轨迹
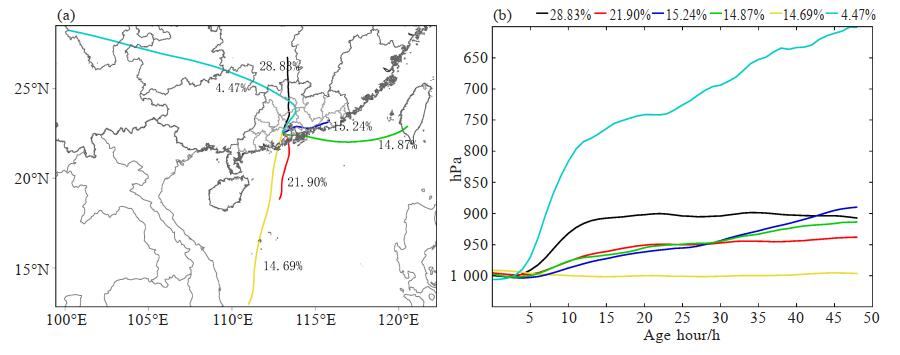
占比/%1 偏北 316 117.1 28.83 85 204.0 26.9 2 偏南(途经中山) 240 76.2 21.90 22 201.2 9.2 3 偏东(陆地) 167 128.8 15.24 64 210.1 38.3 4 偏东(海洋、陆地) 163 80.5 14.87 11 189.4 6.7 5 偏南(途经台山) 161 49.9 14.69 4 203.3 2.5 6 西北转东北 49 93.3 4.47 1 190.3 2.0 全部 1 096 93.6 100.00 187 204.6 17.1
下载: 导出CSV
表 7 2015—2017年有利臭氧生成的气象条件统计
年份 利于臭氧形成的气象因子的时数/h 利于臭氧形成的气象因子日数/d 相对湿度
低于70%气温高
于30 ℃小时雨量为
0 mm风速介于
1.5~4.0 m/s日照时数
高于4h日均相对湿度
介于30~80%日最高气温
高于25 C日雨量为
0 mm2015年 2 016 1 169 4 309 3 136 190 181 243 238 2016年 2 107 1 079 4 152 3 175 172 207 238 203 2017年 2 284 1 103 4 293 3 232 201 225 243 214
下载: 导出CSV
-
[1] 程麟钧, 王帅, 宫正宇, 等.京津冀区域臭氧污染趋势及时空分布特征[J].中国环境监测, 2017, 33(1): 11-21. [2] 易睿, 王亚林, 张殷俊, 等.长江三角洲地区城市臭氧污染特征与影响因素分析[J].环境科学学报, 2015, 35(8): 2370-2377. [3] 陆克定, 张远航, 苏杭, 等.珠江三角洲夏季臭氧区域污染及其控制因素分析[J].中国科学:化学, 2010, 40(4): 407-420. [4] TERJE B, ISAKSEN I S A, WEI-CHYUNG W, et al.Impacts of increased anthropogenic emissions in Asia on tropospheric ozone and climate[J].Tellus Ser B, Chem Phys Meteor, 1996, 48(1):13-32. [5] 孔琴心, 刘广仁, 李桂忱.近地面臭氧浓度变化及其对人体健康的可能影响[J].气候与环境研究, 1999, 4(1): 63-65. [6] 邓雪娇, 周秀骥, 吴兑, 等.珠江三角洲大气气溶胶对地面臭氧变化的影响[J].中国科学:地球科学, 2011, 41(1): 93-102. [7] 戚慧雯, 包云轩, 黄建平, 等.夹卷对郊外大气边界层内臭氧影响的数值模拟研究[J].热带气象学报, 2018, 34(5): 713-720. [8] 安俊琳, 王跃思, 孙扬.气象因素对北京臭氧的影响[J].生态环境学报, 2009, 18(3): 944-951. [9] 李明华, 甘泉, 曹静, 等.惠州市臭氧污染特征及其与气象条件关系研究[J].热带气象学报, 2019, 35(3): 324-331. [10] 高晓荣, 邓雪娇, 谭浩波, 等.广东四大区域污染过程特征与影响天气型分析[J].环境科学学报, 2018, 38(5): 1708-1716. [11] 谈建国, 陆国良, 耿福海, 等.上海夏季近地面臭氧浓度及其相关气象因子的分析和预报[J].热带气象学报, 2007, 23(5): 515-520. [12] 张浩月, 王雪松, 陆克定, 等.珠江三角洲秋季典型气象条件对O3和PM10污染的影响[J].北京大学学报(自然科学版), 2014, 50(3): 565-576. [13] 廖志恒, 孙家仁, 范绍佳, 等.2006-2012年珠三角地区空气污染变化特征及影响因素[J].中国环境科学, 2015, 35(2): 329-336. [14] 黄俊, 廖碧婷, 吴兑, 等.广州近地面臭氧浓度特征及气象影响分析[J].环境科学学报, 2018, 38(1): 23-31. [15] CHAN C Y, CHAN L Y.Effect of meteorology and air pollutant transport on ozone episodes at a subtropical coastal Asian city, Hong Kong[J].J Geophys Res, 2000, 105(D16): 20707-20724. [16] 王茜.利用轨迹模式研究上海大气污染的输送来源[J].环境科学研究, 2013, 26(4): 357-363. [17] 陈皓, 王雪松, 沈劲, 等.珠江三角洲秋季典型光化学污染过程中的臭氧来源分析[J].北京大学学报(自然科学版), 2015, 51(4): 620-630. [18] 花丛, 张恒德, 张碧辉.2013-2014冬半年北京重污染天气气象传输条件分析及预报指数初建[J].气象, 2016, 42(3): 314-321. [19] 刘超, 花丛, 康志明.2014-2015年上海地区冬夏季大气污染特征及其污染源分析[J].气象, 2017, 43(7): 57-64. [20] DAVIS R E, NORMILE C P, SITKA L, et al.A comparison of trajectory and air mass approaches to examine ozone variability[J].Atmos Environ, 2010, 44(1): 64-74. [21] ZHAO M, HUANG Z, QIAO T, et al.Chemical characterization, the transport pathways and potential sources of PM2.5 in Shanghai:Seasonal variations[J].Atmos Res, 2015, 66-78. [22] 黄争超, 洪礼楠, 尹佩玲, 等.保定市夏季臭氧污染来源及大气传输影响研究[J].北京大学学报(自然科学版), 2018, 54(0): 665-672. [23] YING M, ZHANG W, YU H, et al.An overview of the China Meteorological Administration Tropical Cyclone Database[J].J Atmos Oceanic Technol, 2014, 31(2): 287-301. [24] WANG Y Q, ZHANG X Y, DRAXLER R R.TrajStat:GIS-based software that uses various trajectory statistical analysis methods to identify potential sources from long-term air pollution measurement data[J].Environ Modell Softw, 2009, 24(8): 938-939. [25] SIROIS A, BOTTENHEIM J W.Use of backward trajectories to interpret the 5-year record of PAN and O3 ambient air concentrations at Kejimkujik National Park, Nova Scotia[J].J Geophys Res, 1995, 100(D2): 2867-2881. [26] HU X M, XUE M, KONG F Y, et al.Meteorological conditions during an ozone episode in Dallas-Fort Worth, Texas, and impact of their modeling uncertainties on air auality prediction[J].J Geophys Res, 2019, 124(4): 1941-1961. [27] DENG T, WANG T, WANG S, et al.Impact of typhoon periphery on high ozone and high aerosol pollution in the Pearl River Delta region[J].Sci Total Environ, 2019, 668: 617-630. [28] 李颖敏, 范绍佳, 张人文.2008年秋季珠江三角洲污染气象分析[J].中国环境科学, 2011, 31(10):1585-1591. [29] 贾诗卉, 徐晓斌, 林伟立, 等.华北平原夜间对流天气对地面O3混合比抬升效应[J].应用气象学报, 2015, 26(3): 280-290. [30] 中华人民共和国环境保护部.环境空气质量标准: GB 3095-2012[S].北京: 中国环境科学出版社, 2012a. -


 点击查看大图

图(8) / 表(7)
计量
- 文章访问数: 512
- HTML全文浏览量: 75
- PDF下载量: 20
- 被引次数: 0
 粤公网安备 4401069904700003号