


Comparative Analysis of Raindrop Size Distribution Characteristics Between Island and Inland Stations over South China Coastline During Summer Monsoon Season
-
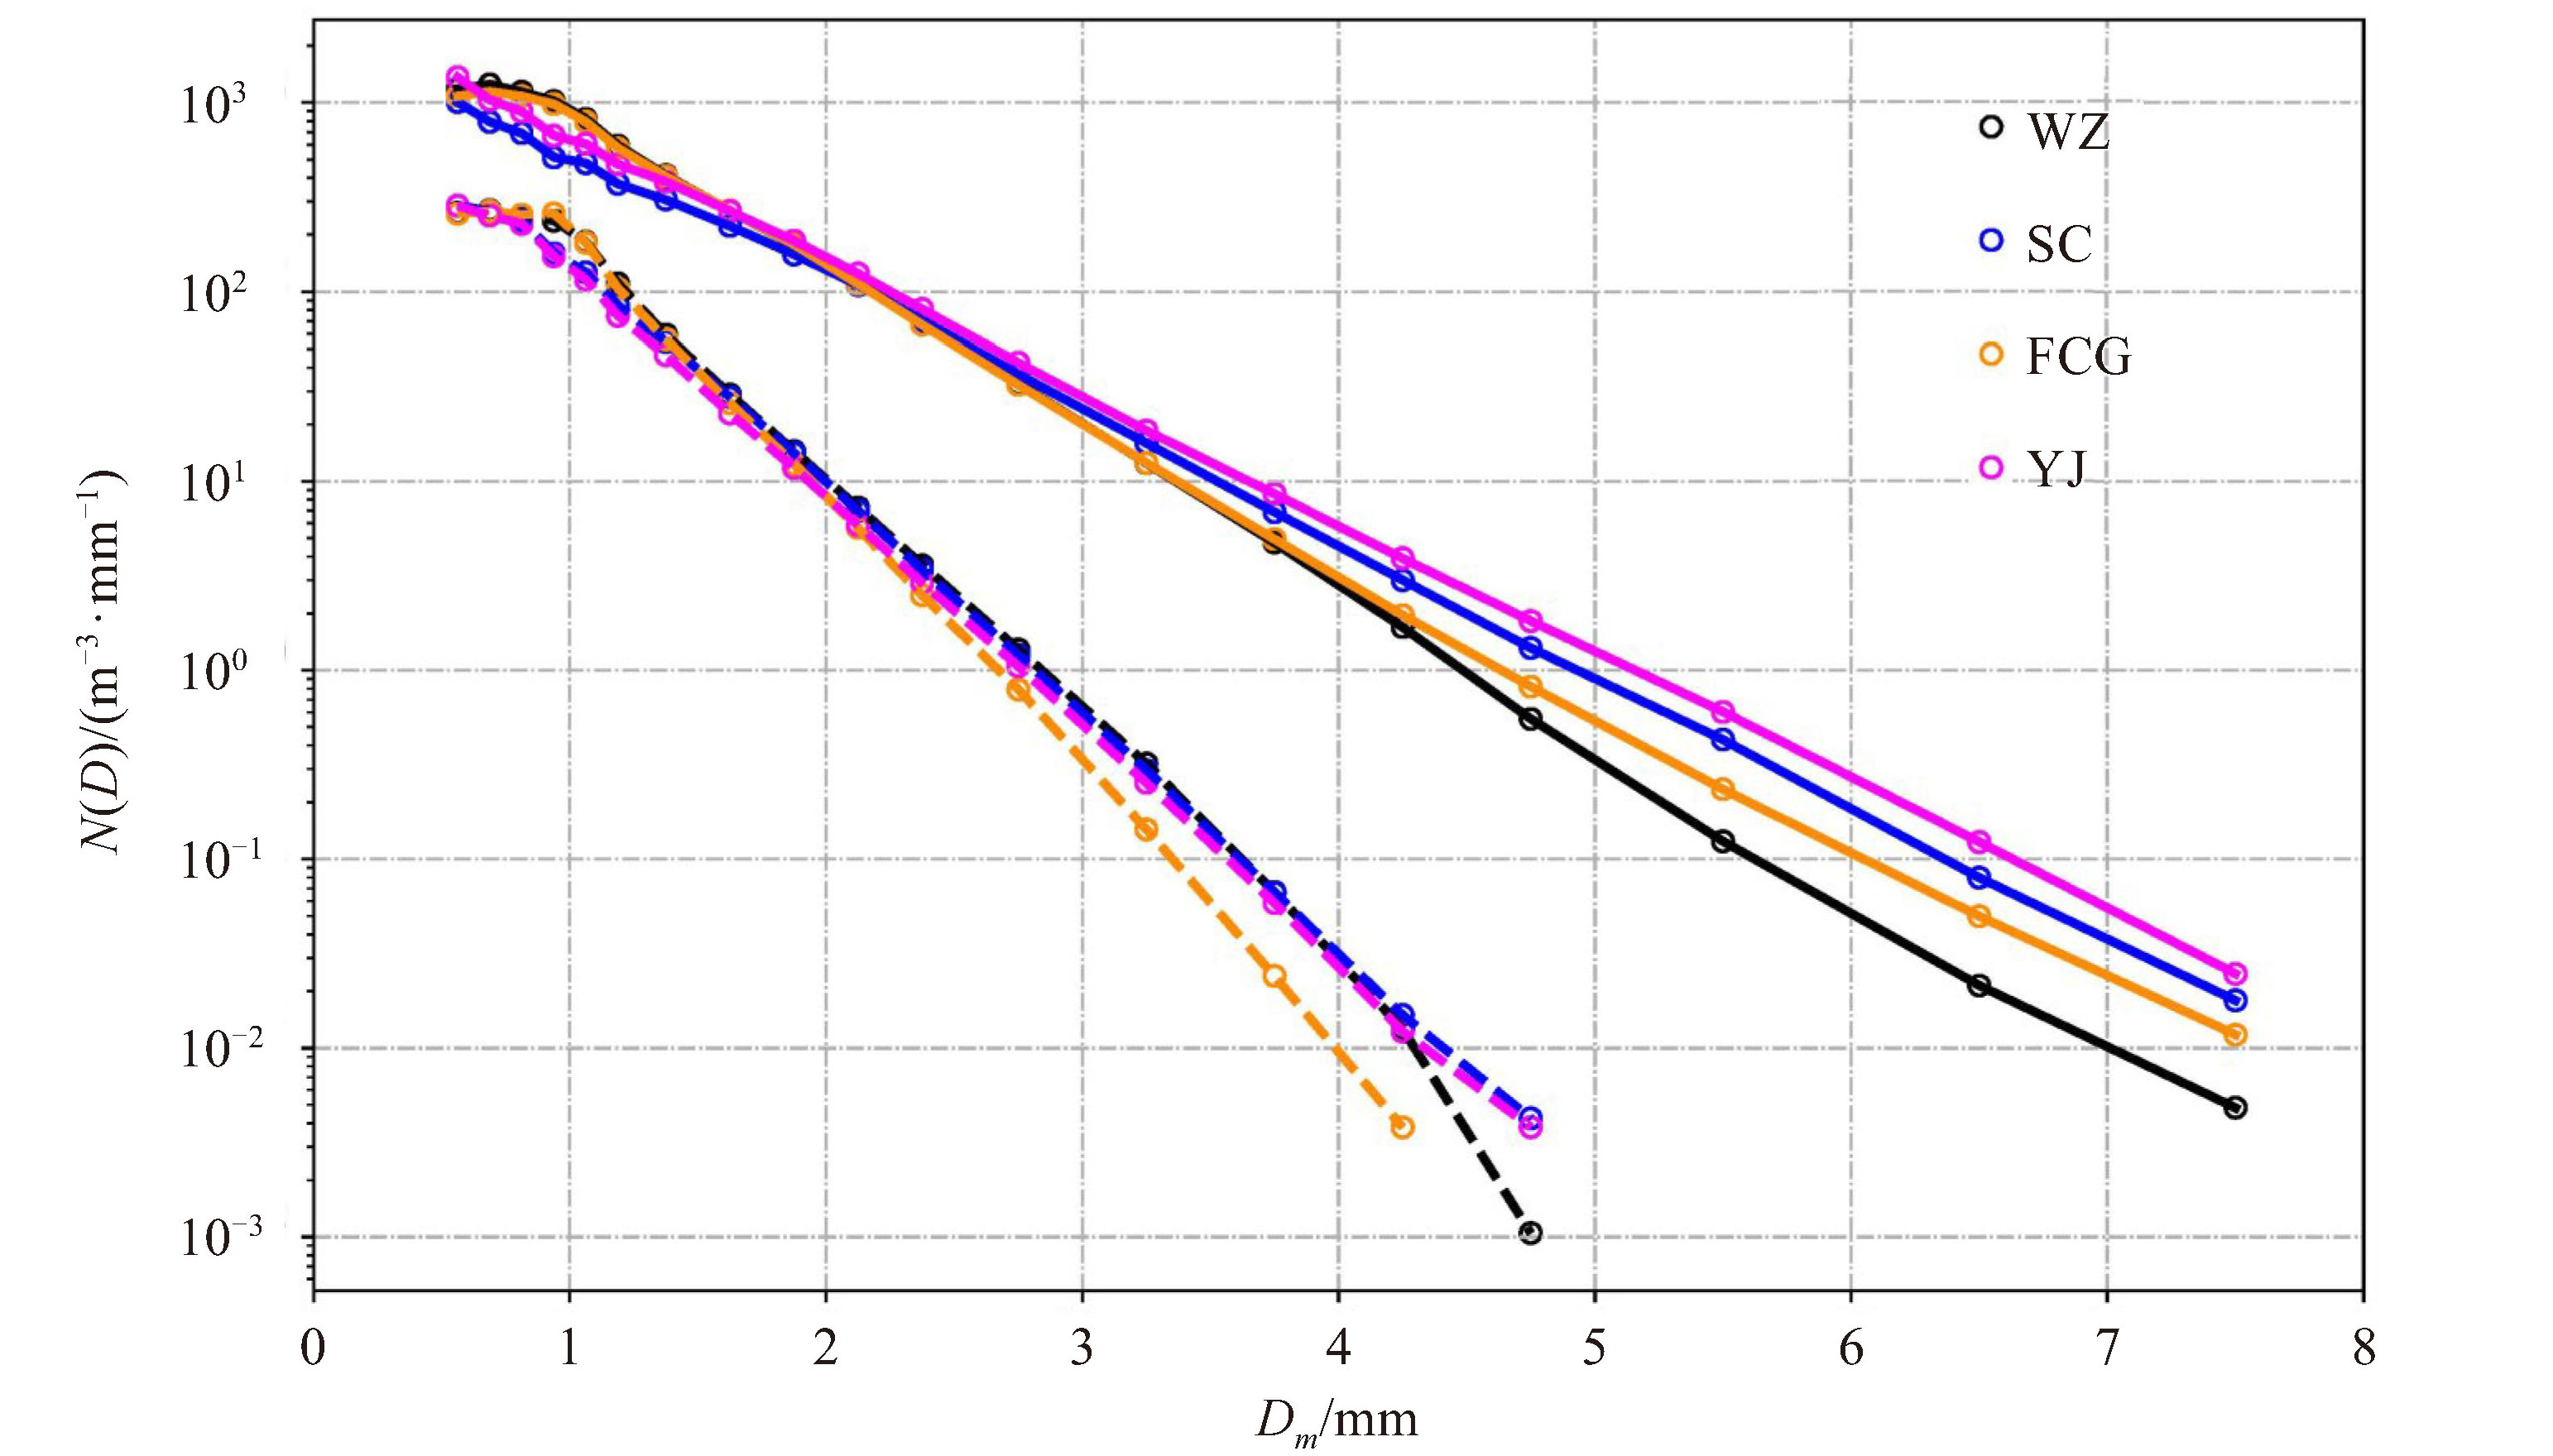
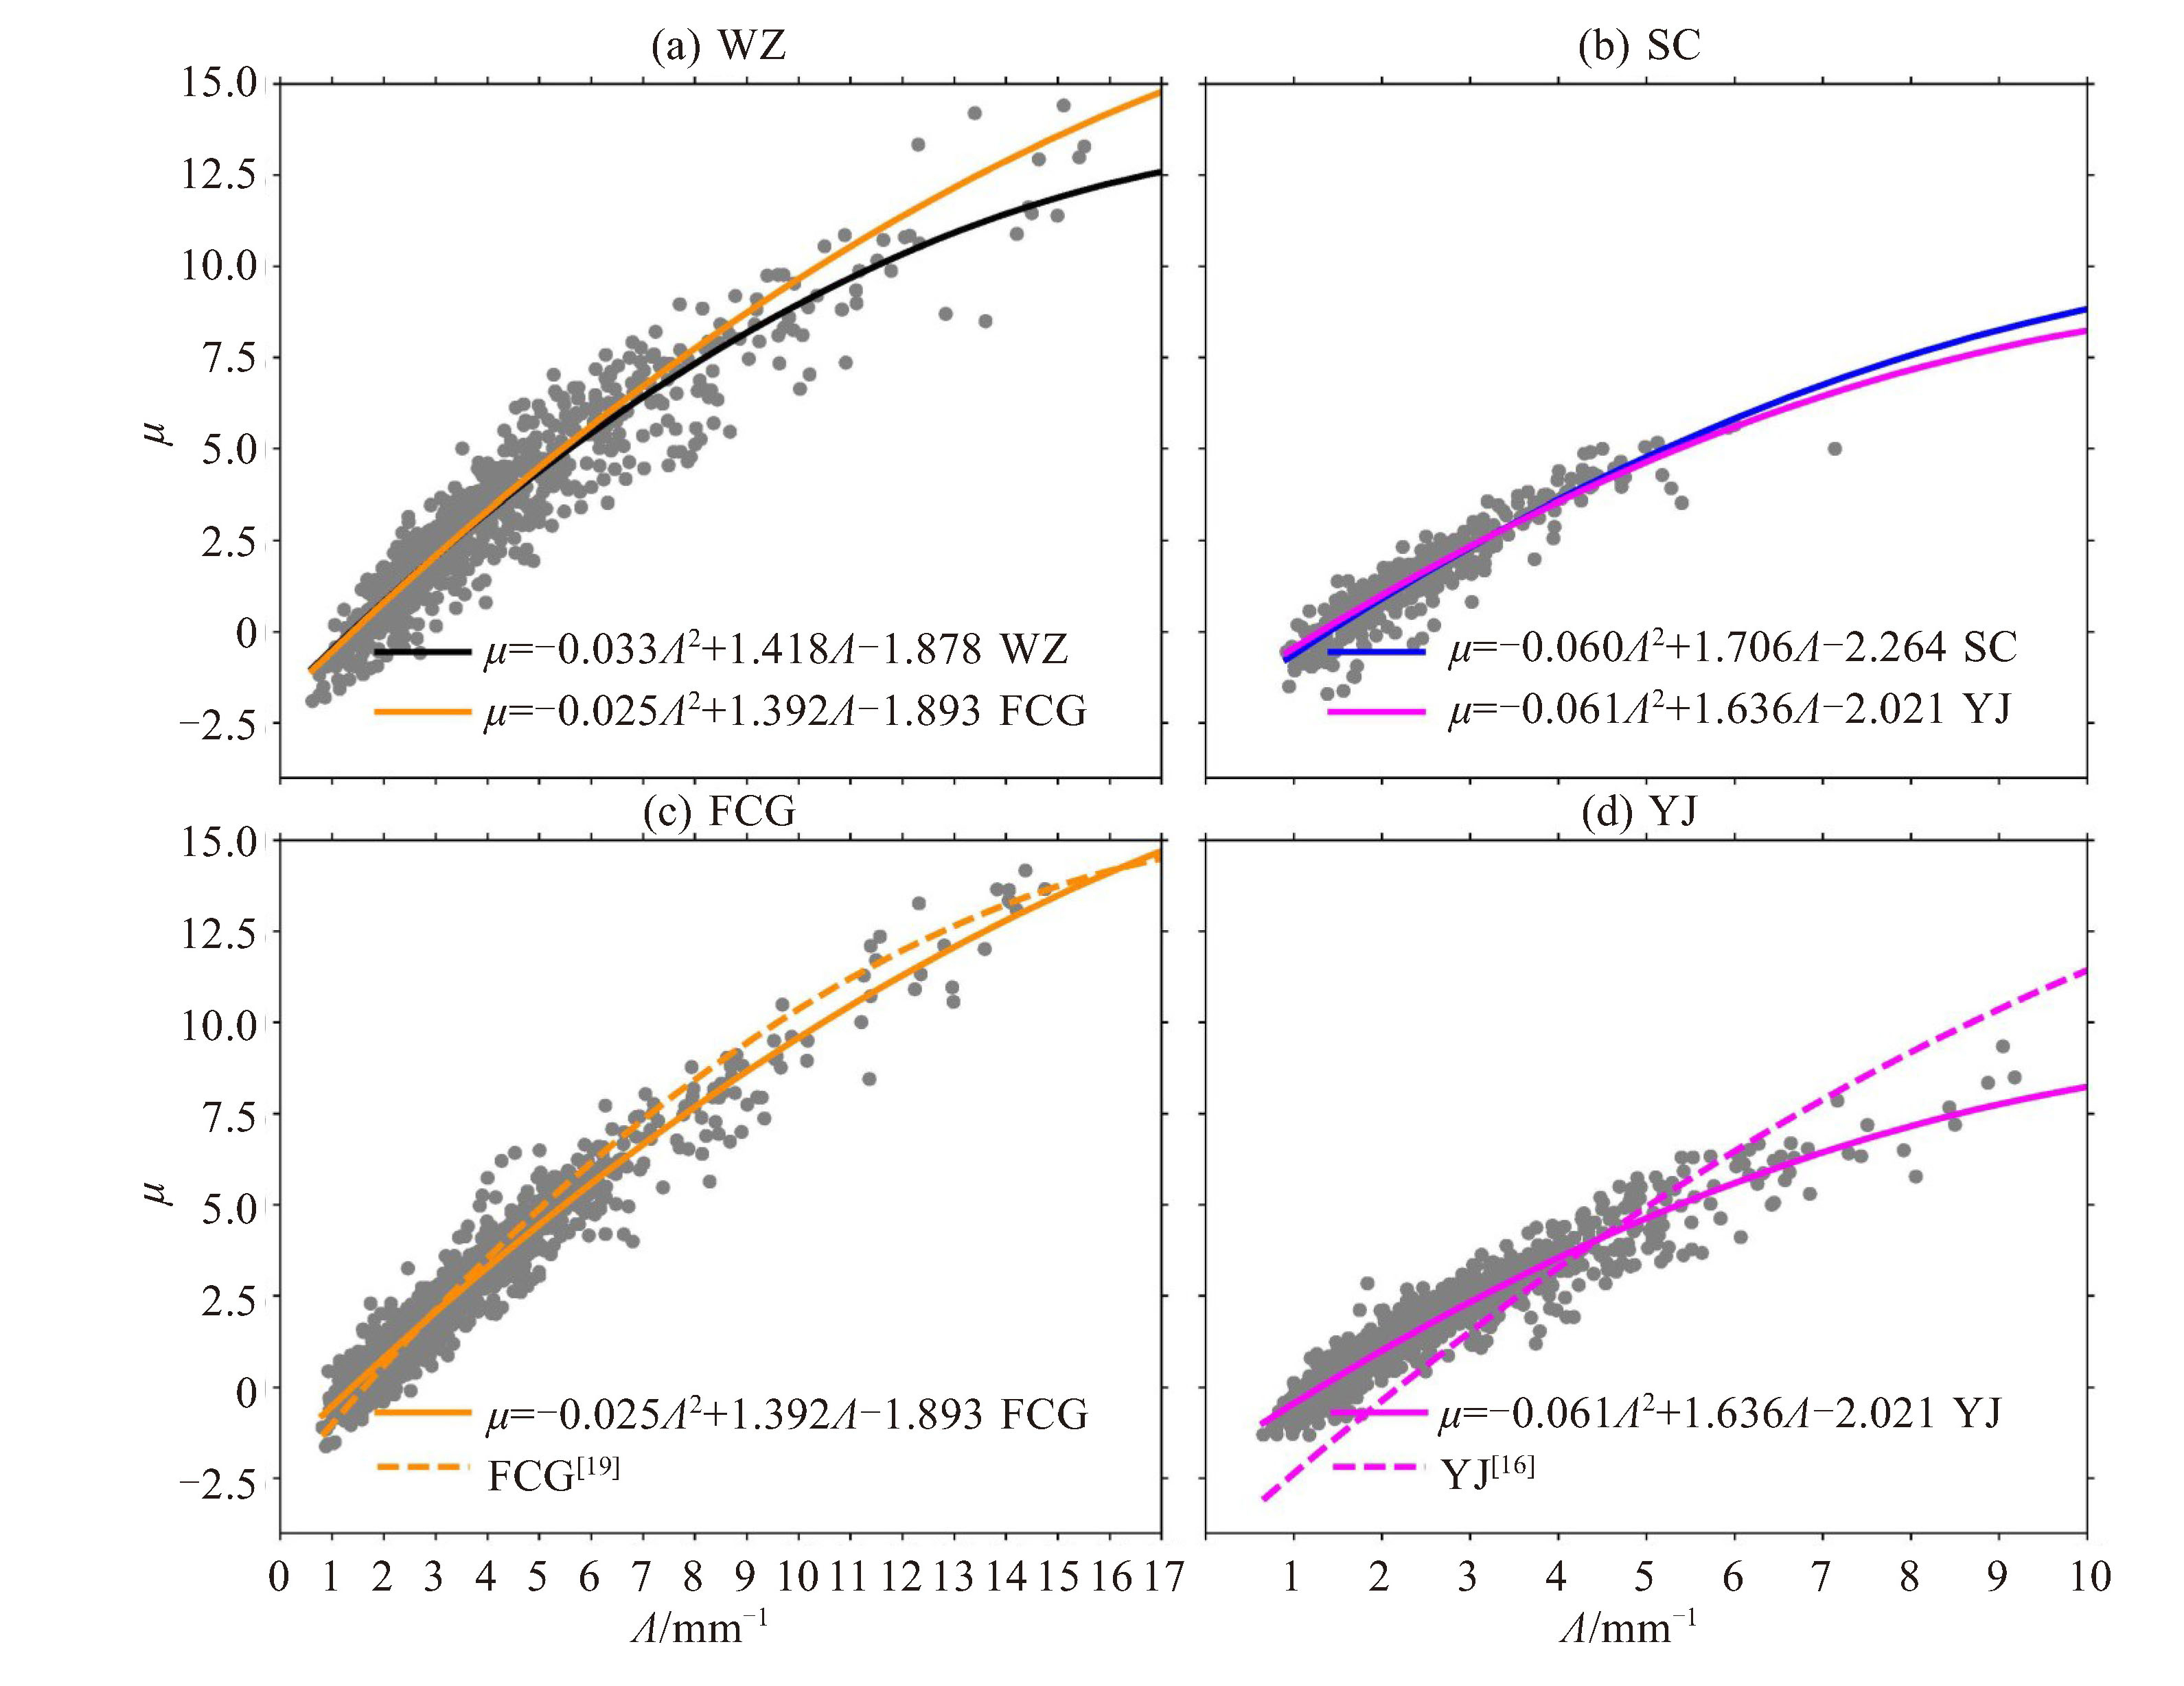
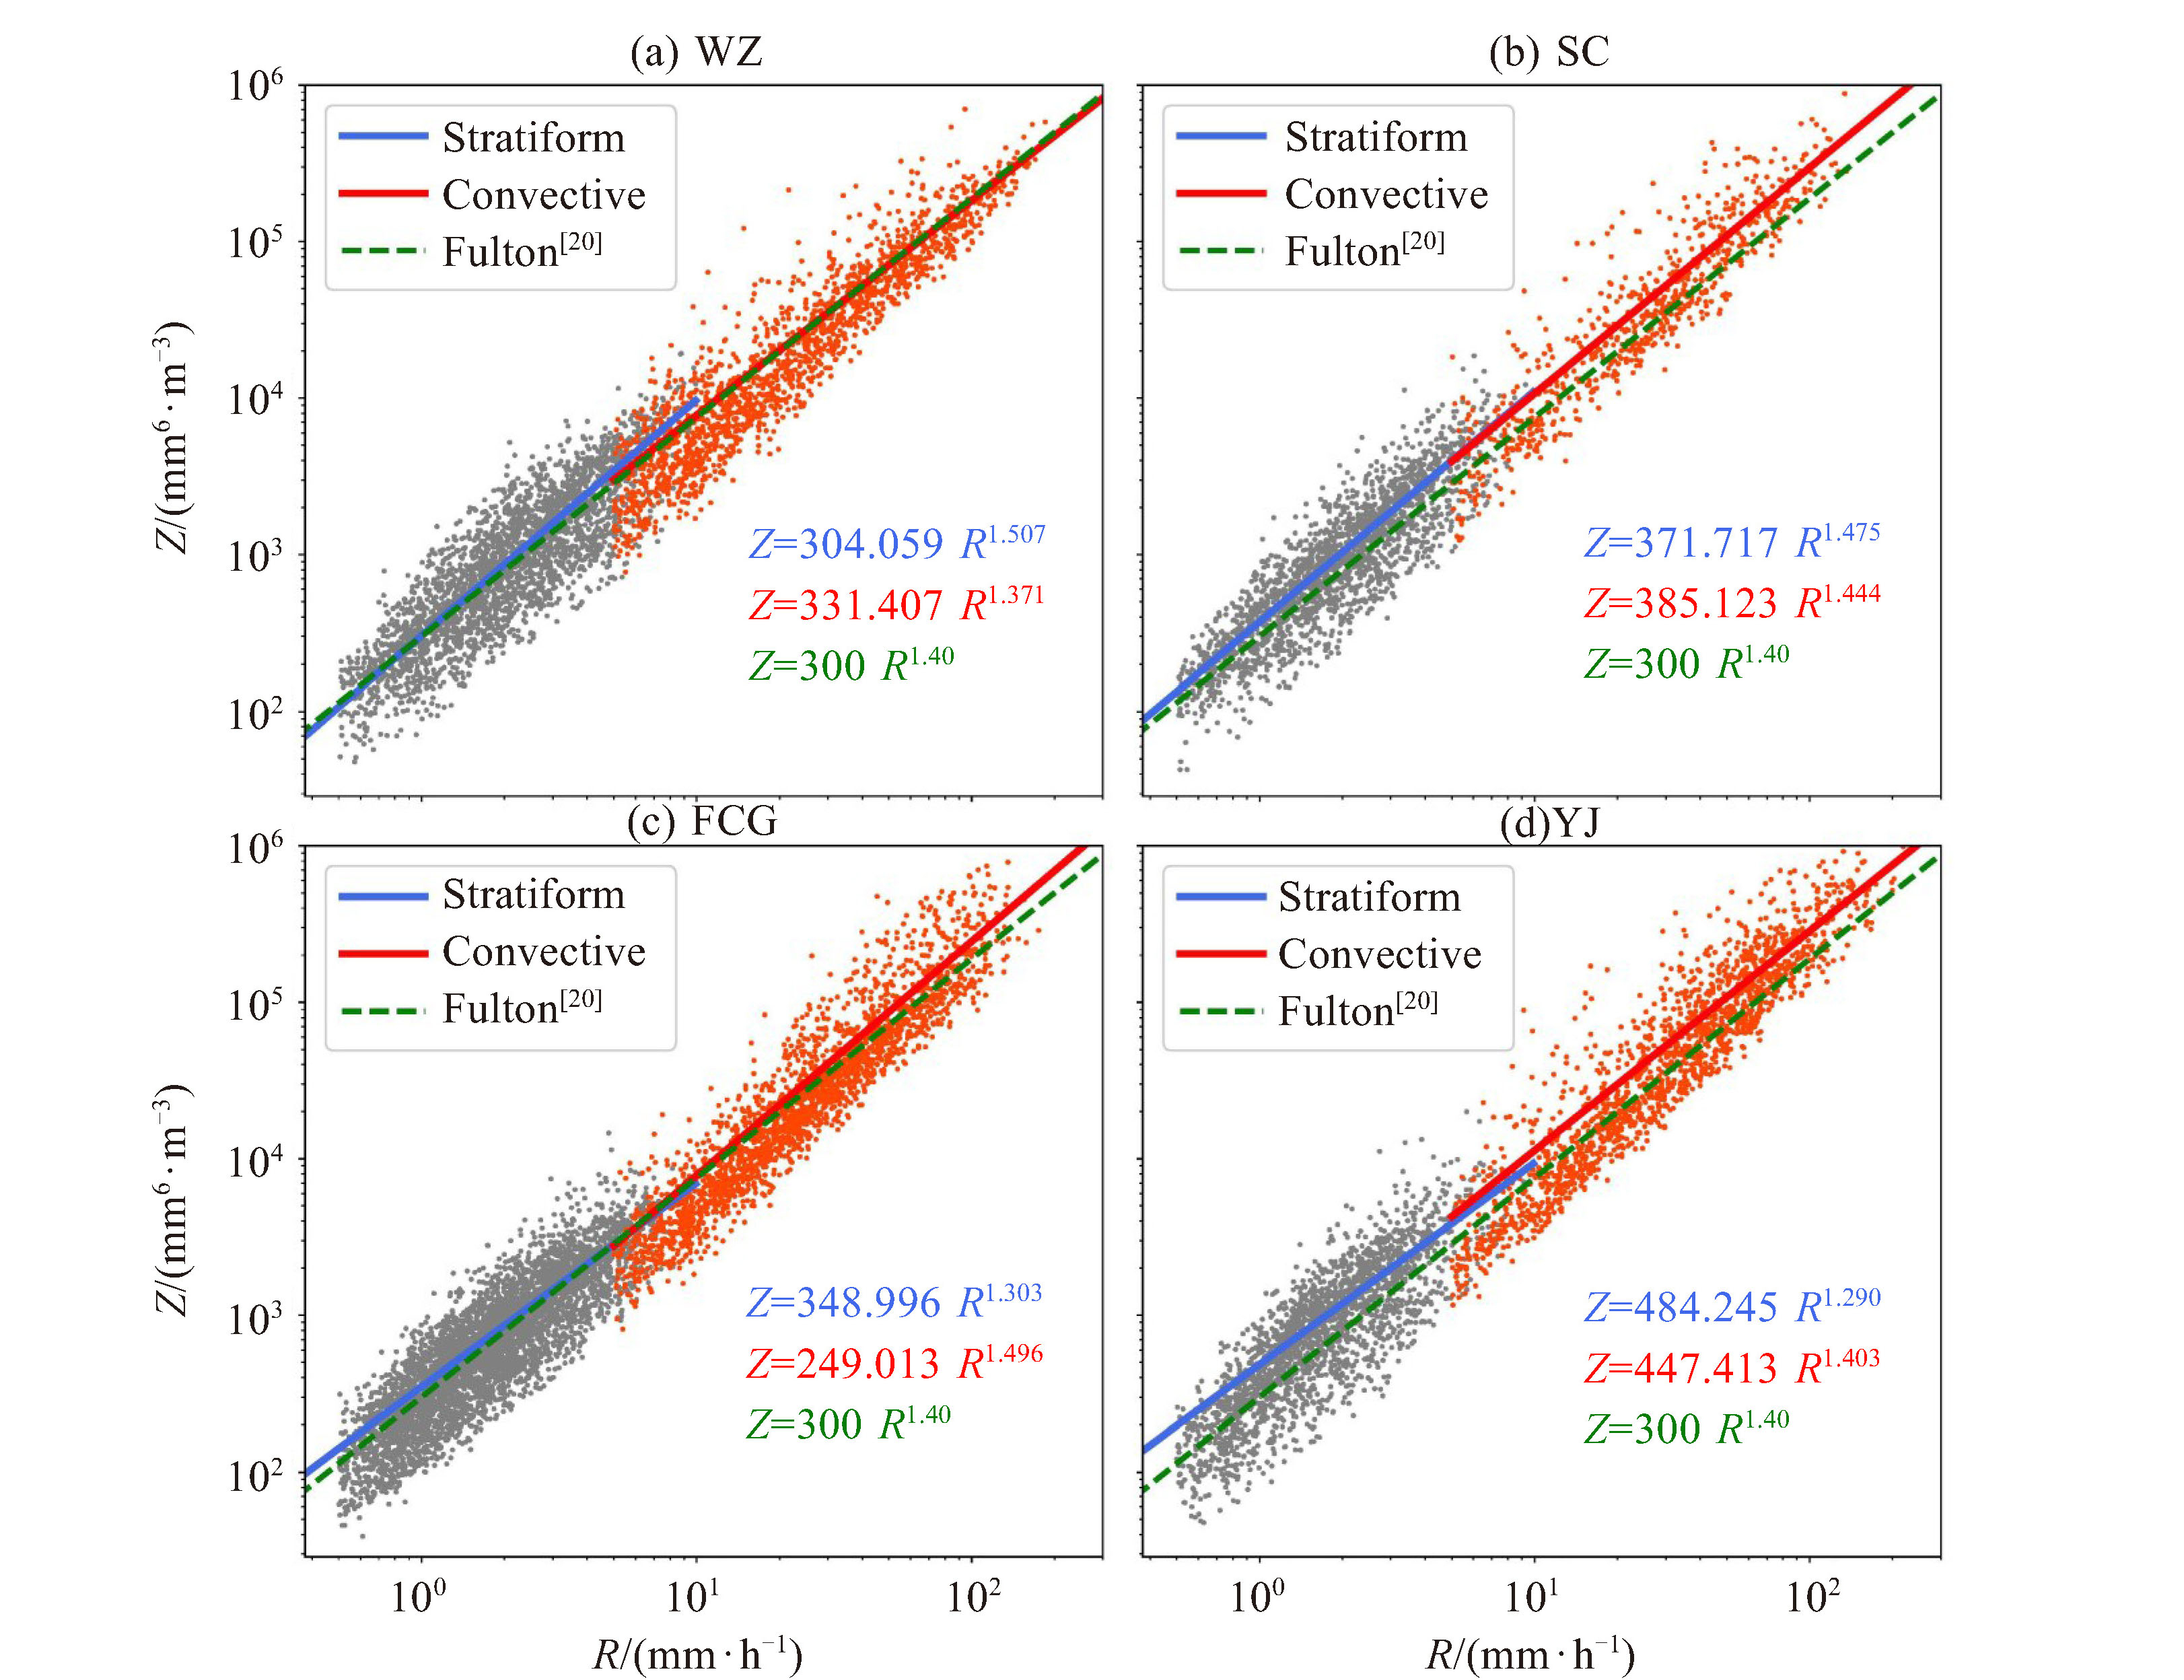
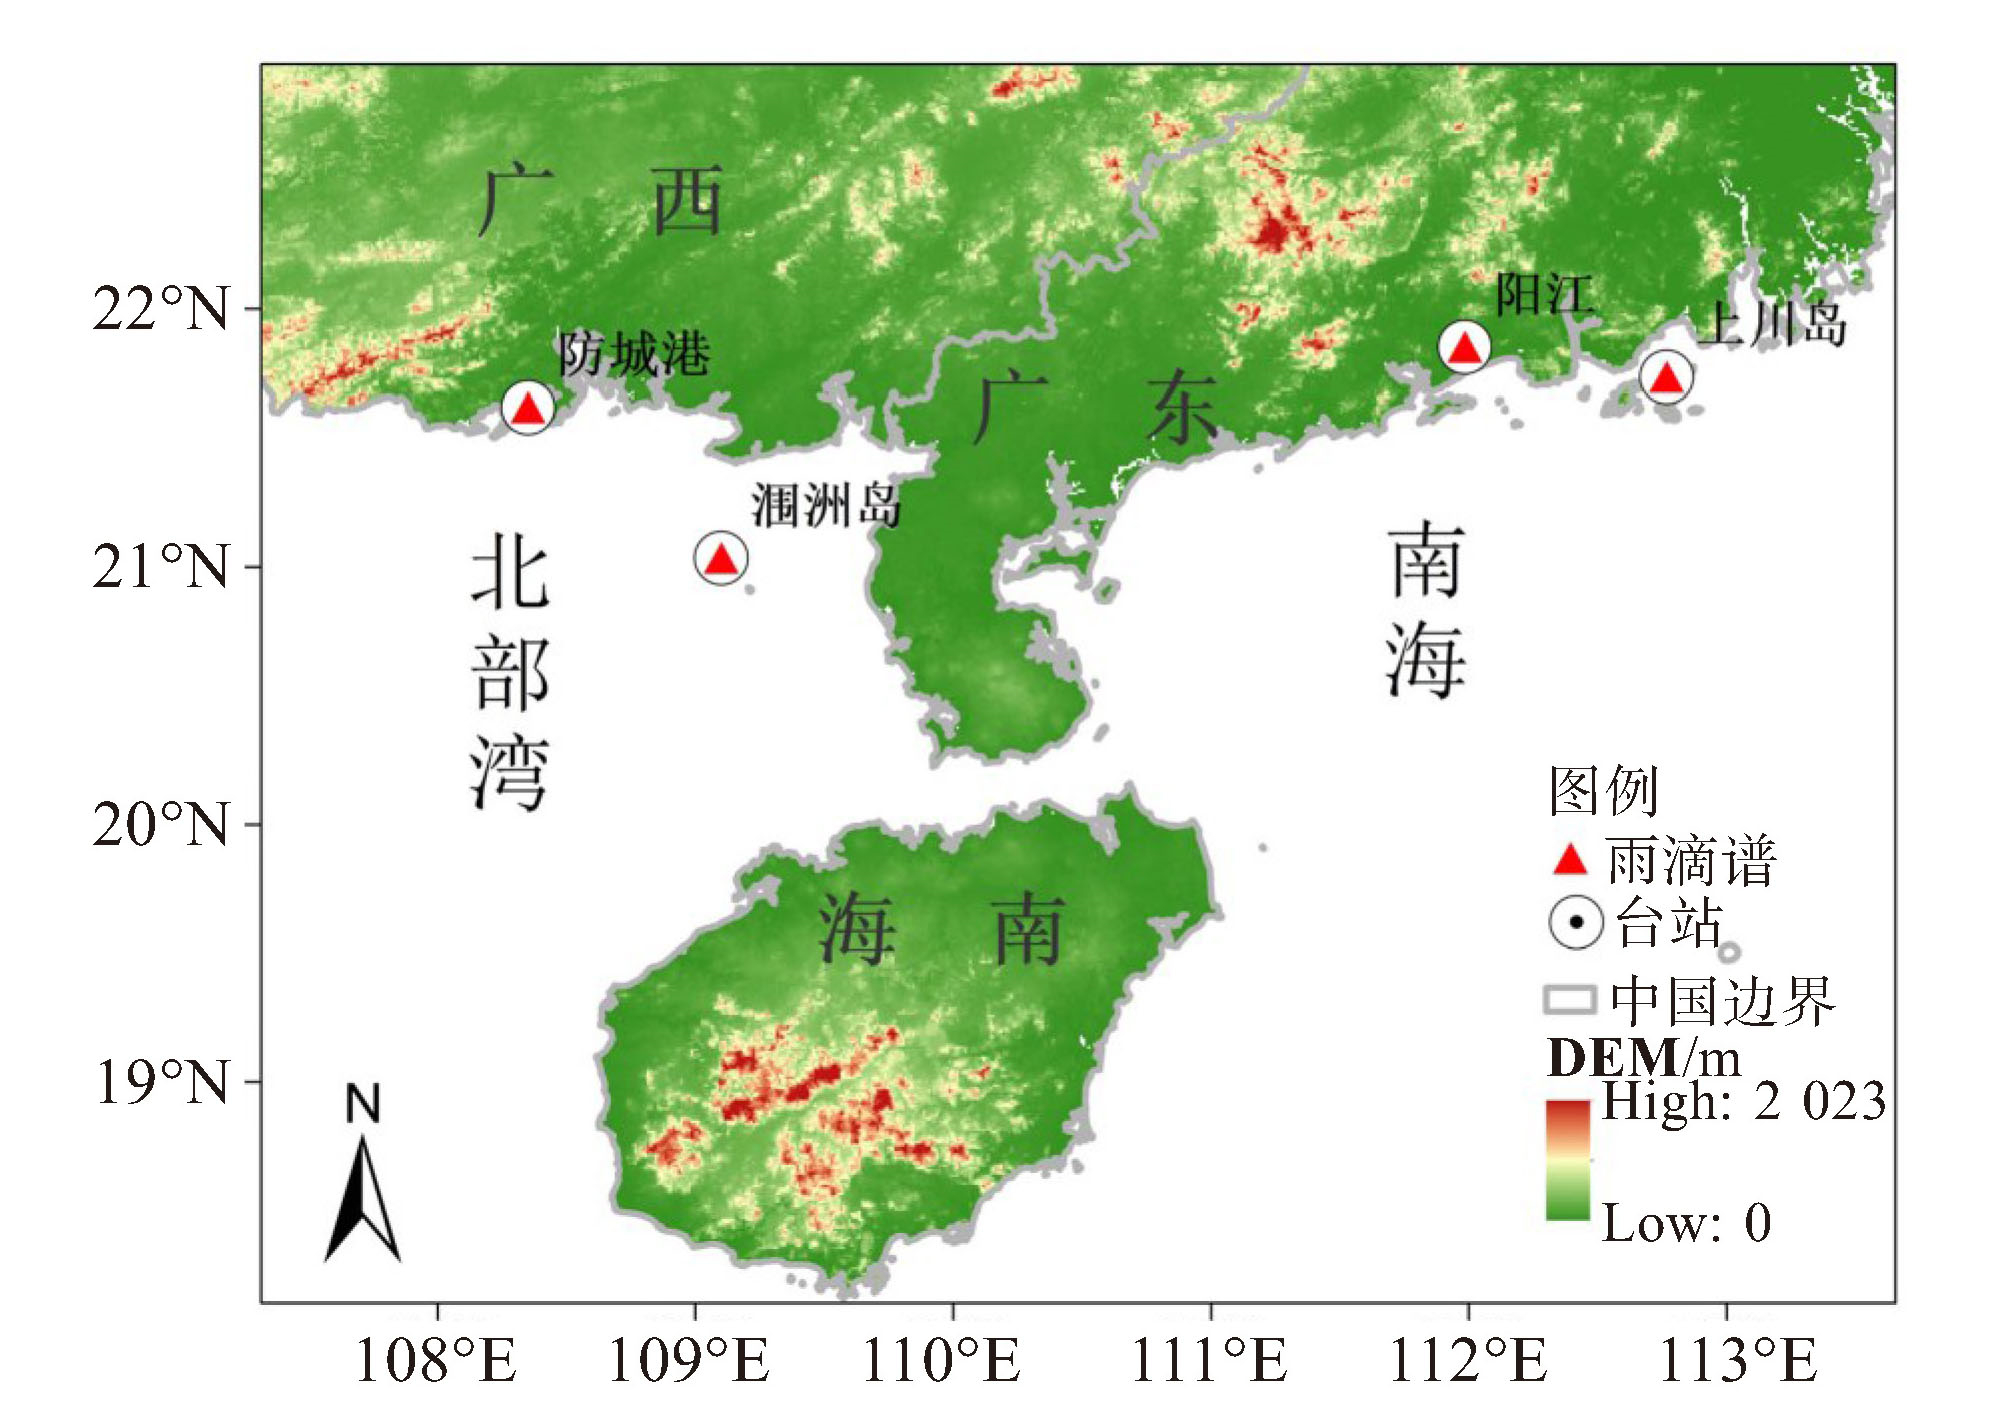
摘要: 充分理解降水微物理的局地变化特征有助于提升本地化降水的模拟和预报能力。利用我国华南地区夏季四个站点(广西北海涠洲岛、防城港,广东阳江、江门上川岛)的雨滴谱观测数据,研究对比近海岛屿与沿岸陆上的降水微物理特征差异。研究表明,对流性降水对华南地区夏季降水量的贡献最大,且对流性降水的微物理特征具有明显的局地差异,具体表现为东部站点(阳江、上川岛)大雨滴更多而小雨滴浓度偏低,而西部站点(涠洲岛、防城港)的小雨滴浓度更高。此外,沿岸站点(阳江、防城港)较岛屿站点(上川岛、涠洲岛)的大雨滴浓度更高。研究还讨论了降水微物理的局地差异与环境变量之间的关系,发现东部(沿岸)站较西部(岛屿)站具有更厚的暖云层,更长的雨滴下落路径增强了碰并过程,从而促进了雨滴粒径的增长。同时,还拟合了华南地区四站的μ-Λ关系和Z-R关系以应用于提高降水和雨滴谱的估计和反演精度。可为研究我国华南地区降水微物理的局地变化特征提供较全面的参考依据。Abstract: To improve precipitation estimation and forecasting, it is important to have a thorough understanding of the regional variability of raindrop size distribution (DSD) characteristics. This study aims to investigate the differences in DSDs between island and inland areas along the South China coastline, using observations from four disdrometers. The results of the study reveal that convective precipitation is the main contributor to summer rainfall in South China, with regional variations in DSD. The eastern stations (Shangchuan Island and Yangjiang) exhibit a higher concentration of large raindrops and a lower concentration of small raindrops compared to the western stations (Weizhou Island and Fangchenggang), which have more small raindrops. Additionally, the inland stations have a higher number of large raindrops (with a diameter greater than 3mm) compared to the island stations. The study also discusses the differences in environmental conditions that contribute to these variations. It is found that the warm cloud depth at the eastern (inland) stations is thicker than at the western (island) stations, indicating a longer pathway for raindrops to fall towards the ground and an enhanced collisional-coalescence process for raindrop growth. Furthermore, the shape-slope (μ-L) and radar reflectivity-rain rate (Z-R) relationships for the four stations also exhibit differences. Overall, this study provides a more comprehensive understanding of the regional variability of precipitation microphysics in South China.
-
Key words:
- precipitation microphysics /
- raindrop size distribution /
- South China /
- island /
- Z-R relationship
-

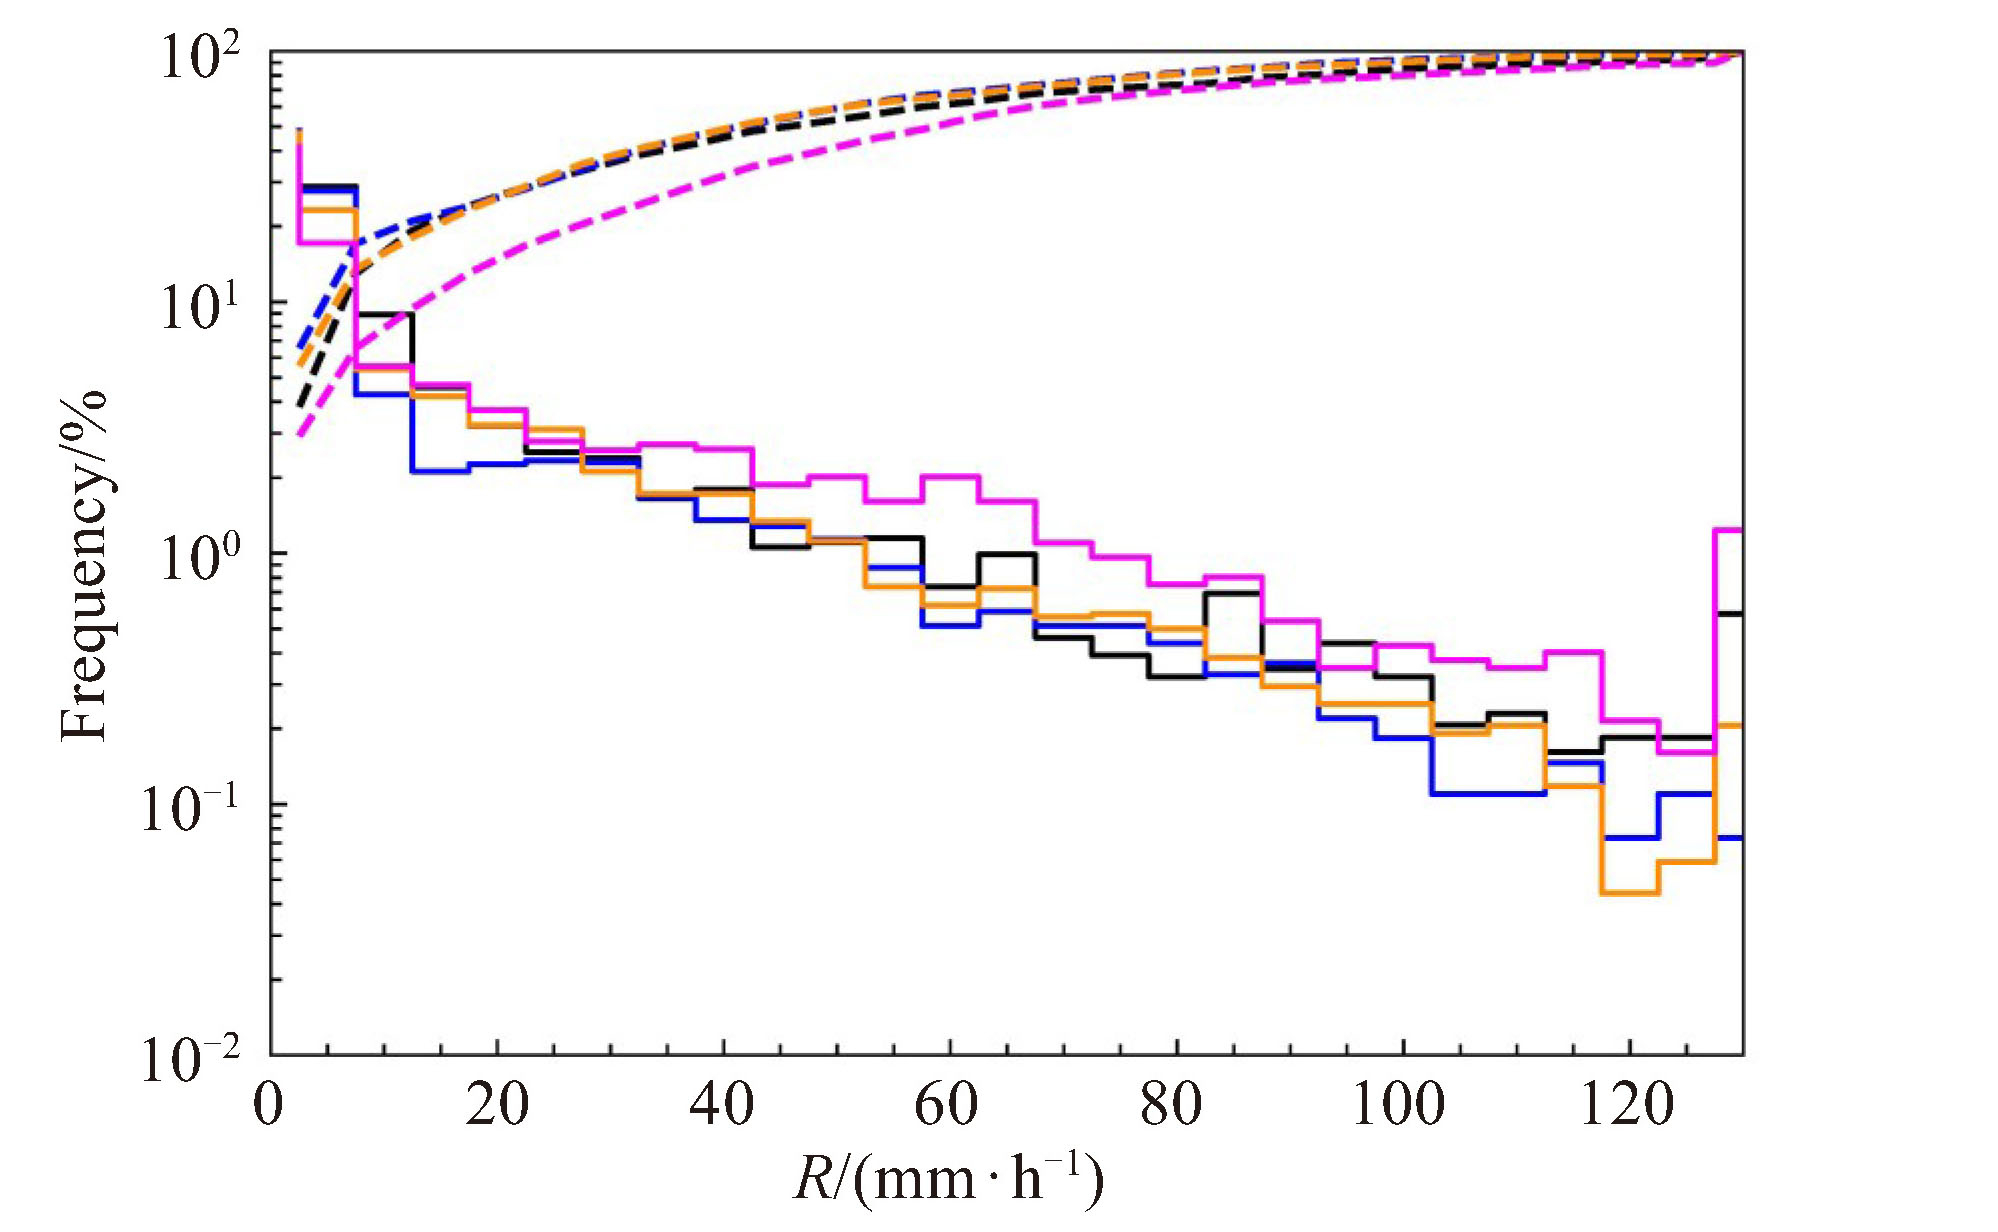
图 2 四个站点不同降水强度(单位:mm·h-1)的发生频率(实线,单位:%)和对总雨量的累计贡献(虚线,单位:%)
站点分别为涠洲岛(黑)、防城港(橙色)、上川岛(蓝)、阳江(紫)。

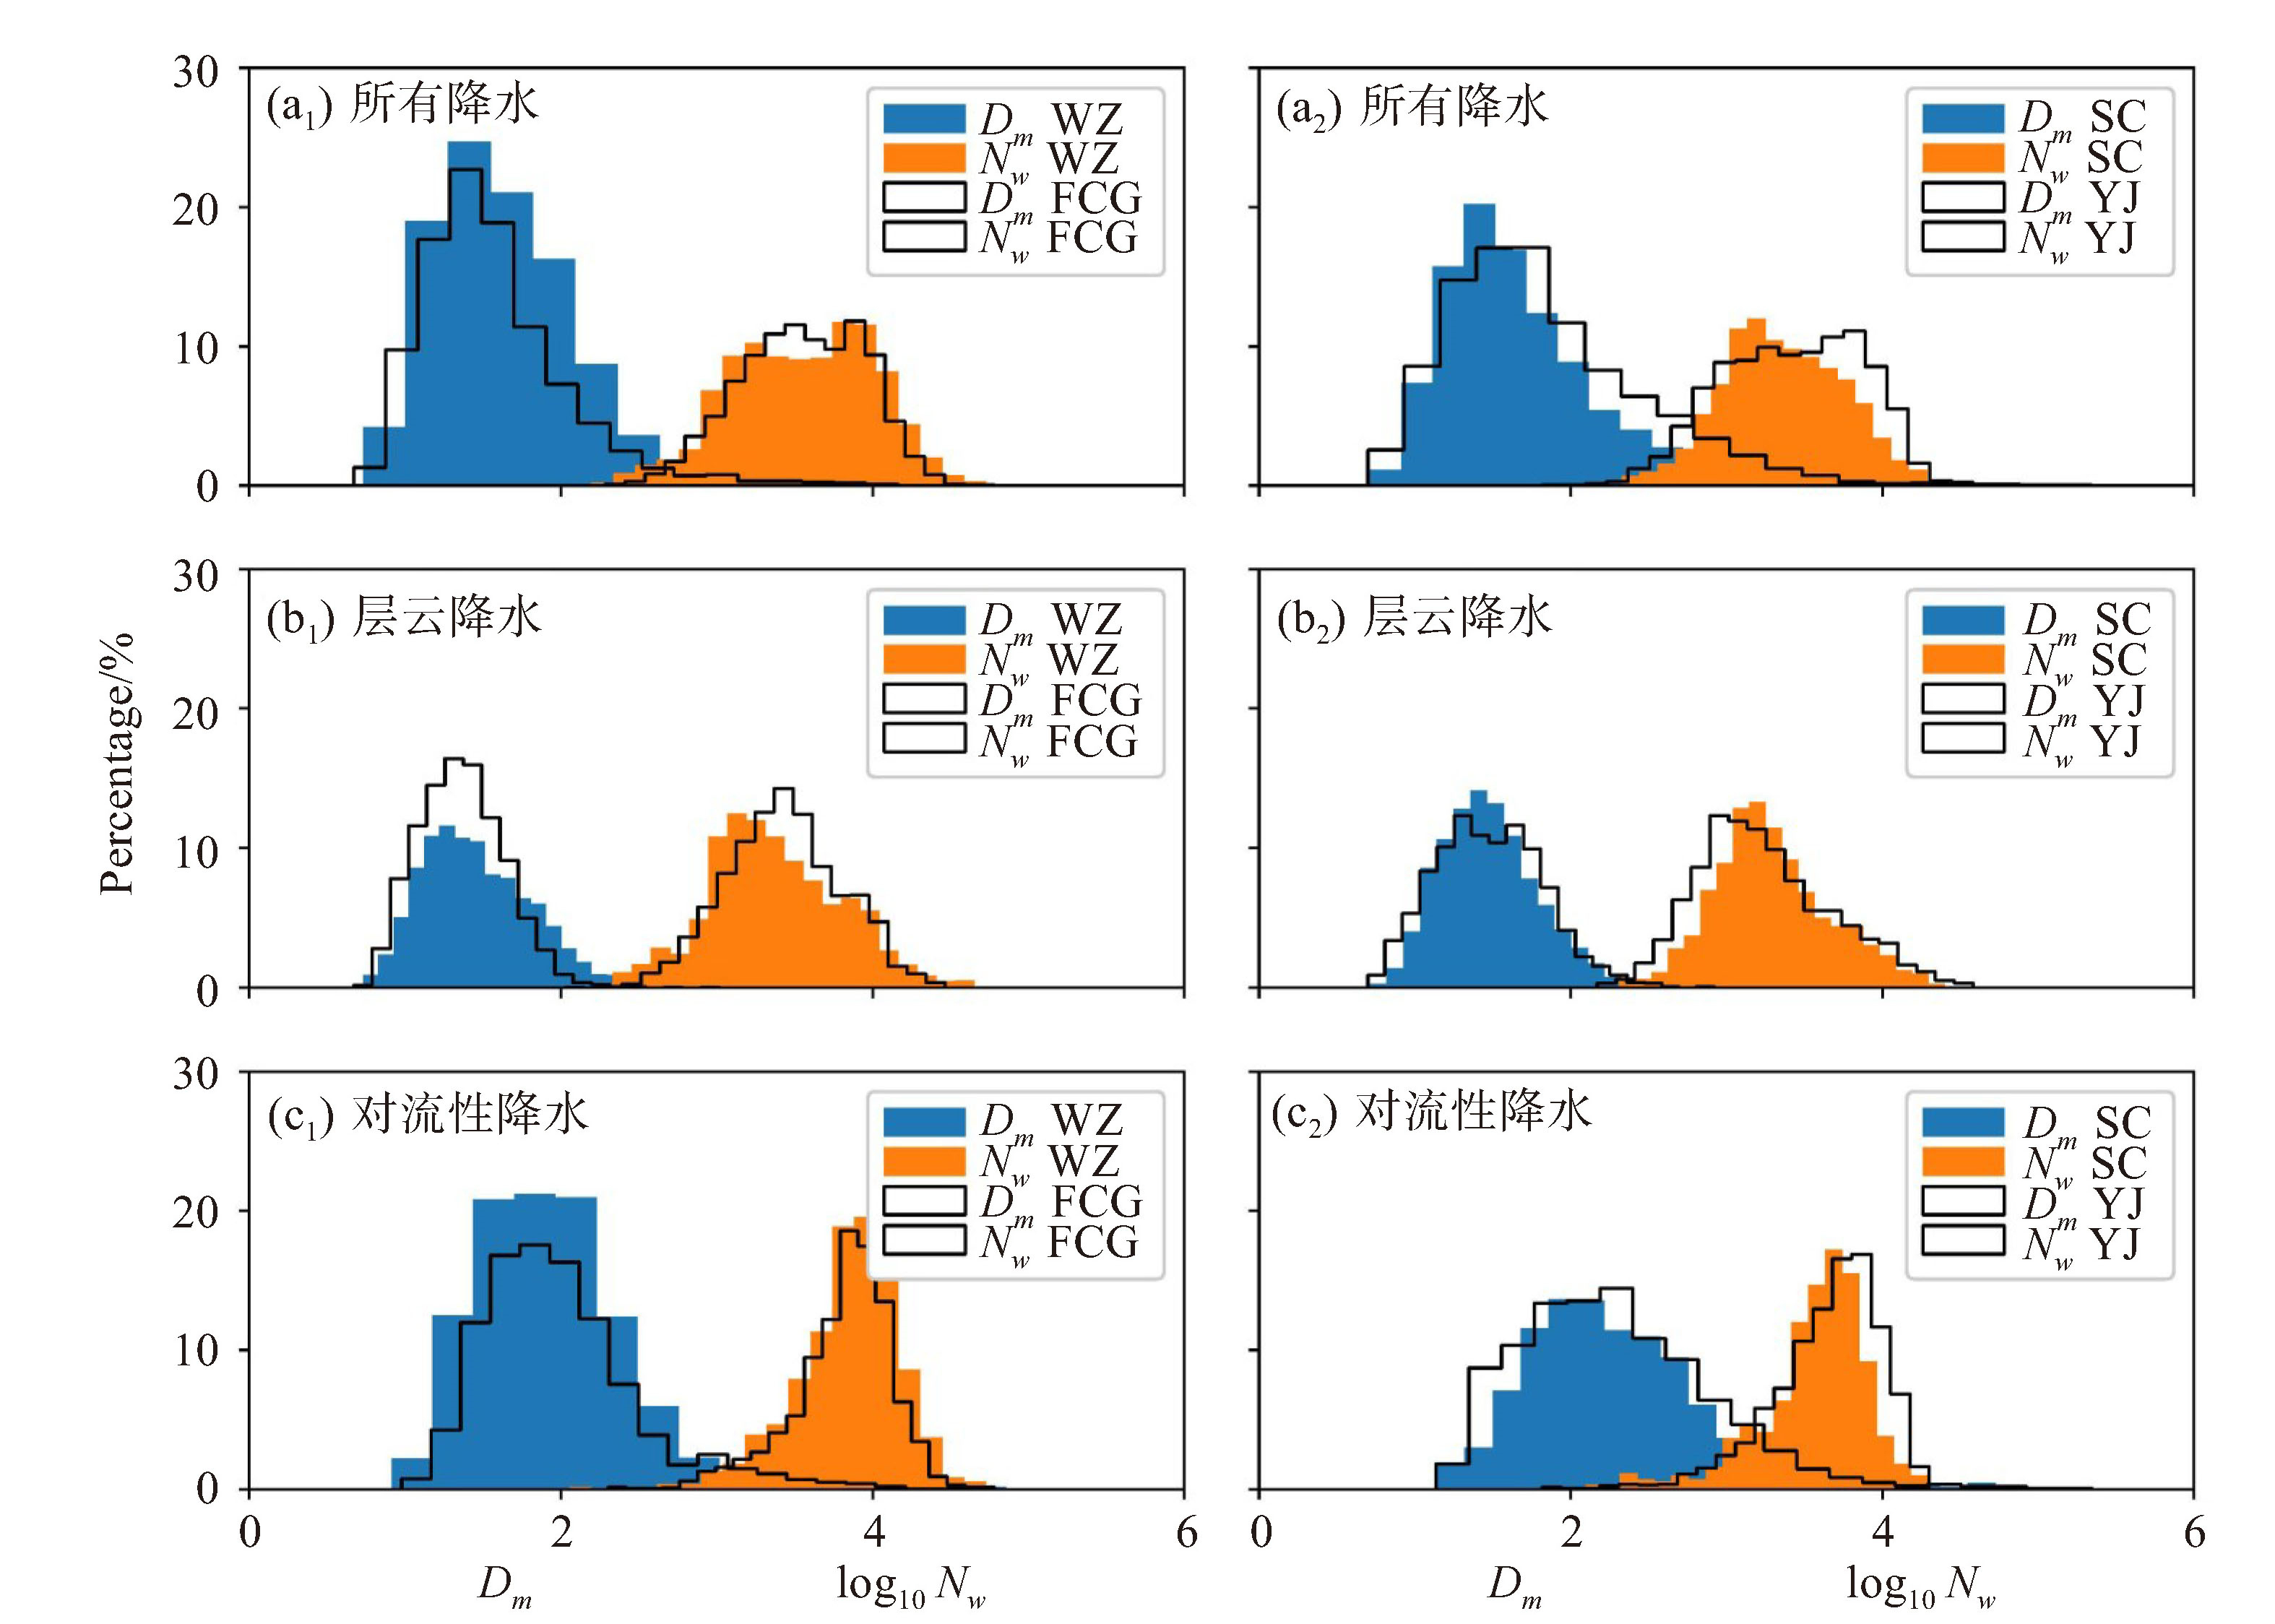
图 3 四个站点不同降水类型的Dm(单位:mm)和log10Nw(单位:mm-1·m-3)柱状分布
第一列为涠洲岛(WZ)、防城港(FCG);第二列为上川岛(SC)、阳江(YJ)。


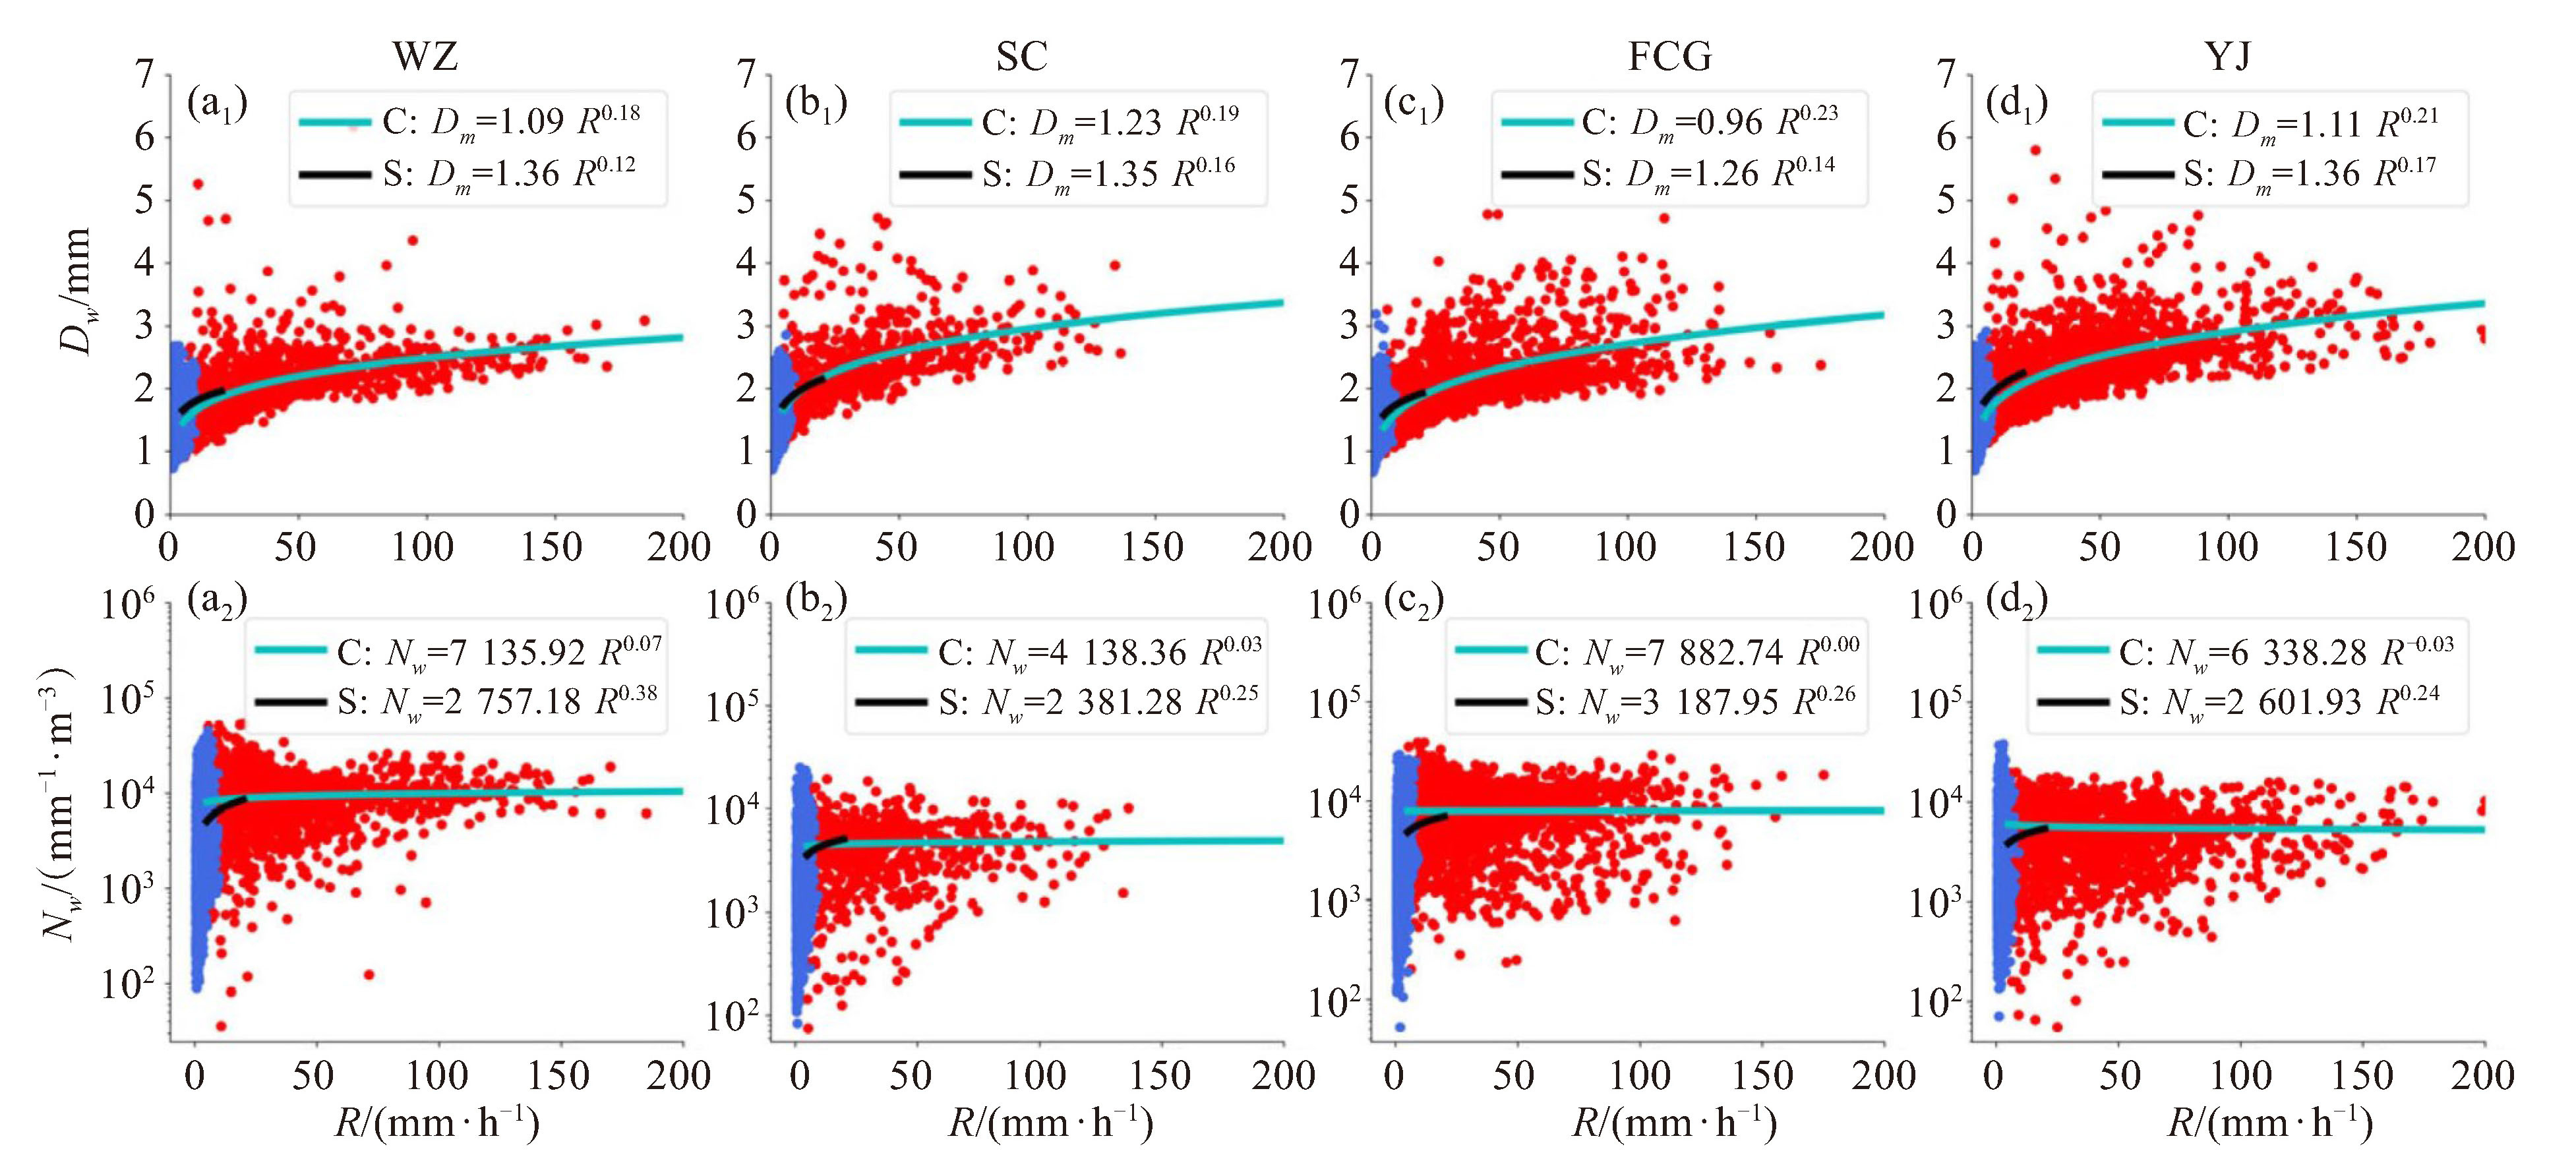
图 5 四站的对流(红)、层云(蓝)的Dm-R、Nw-R散点图及拟合曲线
a1、a2.涠洲岛;b1、b2.上川岛;c1、c2.防城港;d1、d2.阳江。黑色、绿色分别为层云降水、对流降水拟合线。

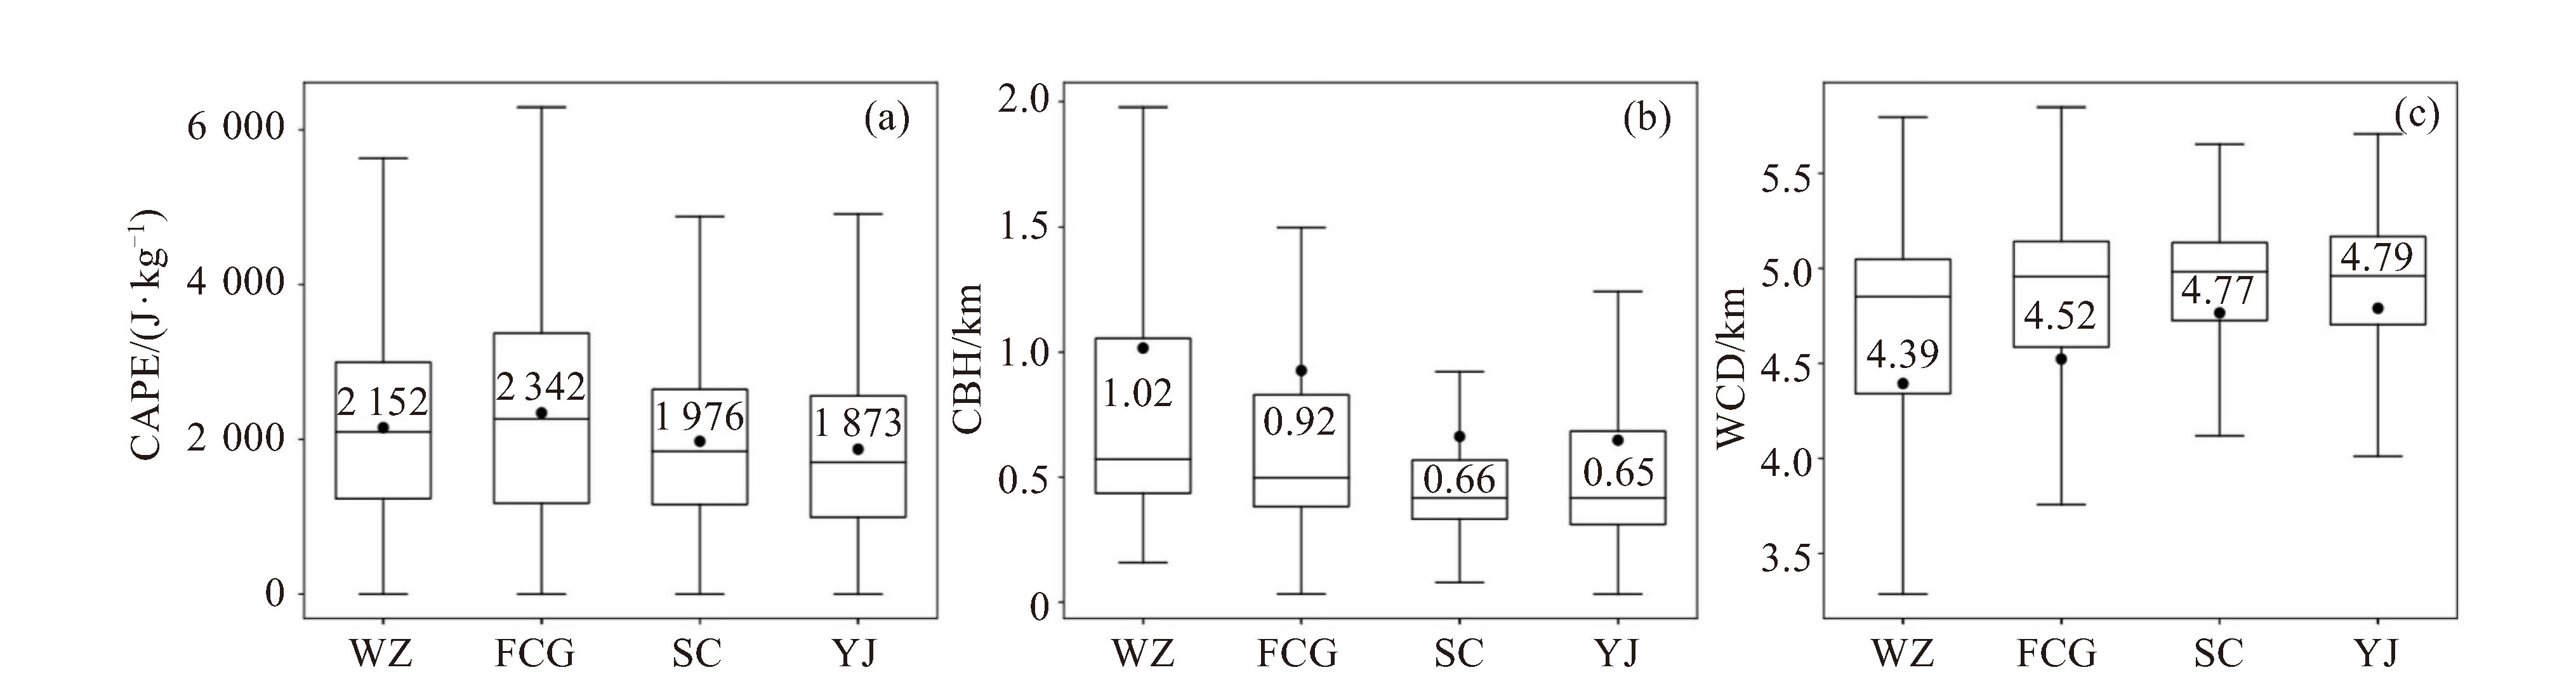
图 8 2019年、2020年6—8月ERA5逐时气候变量箱型图
a.对流有效位能CAPE;b.云底高度CBH;c.暖云厚度WCD。箱图从上至下分别代表上限、上四分位数、中位数、下四分位数、下限,散点代表平均值,异常点通过四分位距法筛选,已剔除。
表 1 四站不同降水类型Dm、log10Nw的相关统计参数(样本数、平均值、标准差和偏斜度)
降水类型 研究点 样本数/min Dm/mm log10Nw/(mm-1·m-3) 均值 标准差 偏斜度 均值 标注差 偏斜度 对流性降水 涠洲岛 1 617 1.92 0.47 0.15 3.84 0.34 -0.04 上川岛 711 2.29 0.59 0.20 3.55 0.36 -0.06 防城港 2 166 2.00 0.51 0.18 3.81 0.31 -0.03 阳江 1 656 2.29 0.62 0.21 3.64 0.35 -0.05 层云降水 涠洲岛 2 282 1.48 0.35 0.02 3.32 0.47 0 上川岛 2 091 1.49 0.32 0.02 3.26 0.40 0.01 防城港 4 697 1.37 0.28 0.01 3.41 0.38 -0.01 阳江 2 135 1.49 0.35 0.01 3.22 0.44 0.04 所有降水 涠洲岛 4 498 1.64 0.45 0.10 3.51 0.50 -0.05 上川岛 2 802 1.69 0.53 0.22 3.34 0.41 -0.01 防城港 6 863 1.57 0.47 0.16 3.54 0.41 -0.02 阳江 3 791 1.83 0.62 0.27 3.40 0.46 -0.02  下载: 导出CSV
-
[1] 张婷, 魏凤英. 华南地区汛期极端降水的概率分布特征[J]. 气象学报, 2009, 67(3): 442-451. [2] LI M X, LUO Y L, ZHANG D L. Analysis of a record-breaking rainfall event associated with a monsoon coastal megacity of South China using multisource data[J]. IEEE Trans Geosci Remote Sens, 2020, 59(8): 6 404-6 414. [3] 罗聪, 张华龙, 曾沁, 等. 多模式融合的广东网格定量降水预报方法的研发与评估[J]. 气象, 2021, 47(5): 539-549. [4] ZENG Z L, WANG D H. Observations of heavy short-term rainfall hotspots associated with warm-sector episodes over coastal South China[J]. Atmos Res, 2022, 276: 106273. [5] ROSENFELD D, ULBRICH C W. Cloud microphysical properties, processes, and rainfall estimation opportunities[J]. Radar and Atmospheric Science: A Collection of Essays in Honor of David Atlas, Meteorol Monogr, 2003, 30(52): 237-258. [6] 覃武, 刘国忠, 赖珍权, 等. 华南暖区暴雨预报失误及可预报性探讨[J]. 气象, 2020, 46(8): 1 039-1 052. [7] 朱格利, 林万涛, 曹艳华. 用WRF模式中不同云微物理参数化方案对华南一次暴雨过程的数值模拟和性能分析[J]. 大气科学, 2014, 38(3): 513-523. [8] ZHANG G F, SUN J Z, BRANDES E A. Improving parameterization of rain microphysics with disdrometer and radar observations[J]. J Atmos Sci, 2006, 63(4): 1 273-1 290. [9] SNOOK N, XUE M. Effects of microphysical drop size distribution on tornadogenesis in supercell thunderstorms[J]. Geophys Res Lett, 2008, 35(24): 24803. [10] MILBRANDT J, YAU M. A multimoment bulk microphysics parameterization. Part Ⅱ: A proposed three-moment closure and scheme description[J]. J Atmos Sci, 2005, 62(9): 3 065-3 081. [11] SUN J Z. Initialization and numerical forecasting of a supercell storm observed during STEPS[J]. Mon Wear Rev, 2005, 133(4): 793-813. [12] TOKAY A, SHORT D A. Evidence from tropical raindrop spectra of the origin of rain from stratiform versus convective clouds[J]. J Appl Meteor, 1996, 35(3): 355-371. [13] ZHANG G F, VIVEKANANDAN J, BRANDES E. A method for estimating rain rate and drop size distribution from polarimetric radar measurements[J]. IEEE Trans Geosci Remote Sens, 2001, 39(4): 830-841. [14] BRINGI V, CHANDRASEKAR V, HUBBERT J. Raindrop size distribution in different climatic regimes from disdrometer and dual-polarized radar analysis[J]. J Atmos Sci, 2003, 60(2): 354-365. [15] WEN L, ZHAO K, ZHANG G F. Statistical characteristics of raindrop size distributions observed in East China during the Asian summer monsoon season using 2D‐Video disdrometer and micro‐rain radar data[J]. J Geophys Res-atmos, 2016, 121(5): 2 265-2 282. [16] TANG Q, XIAO H, GUO C W. Characteristics of the raindrop size distributions and their retrieved polarimetric radar parameters in northern and southern China[J]. Atmos Res, 2014, 135: 59-75. [17] ZHENG J F, LIU L P, CHEN H N. Characteristics of warm clouds and precipitation in South China during the pre-flood season using datasets from a cloud radar, a ceilometer, and a disdrometer[J]. Remote Sens, 2019, 11(24): 3045. [18] LAI R Z, LIU X T, HU S. Raindrop size distribution characteristic differences during the dry and wet seasons in South China[J]. Atmos Res, 2022, 266: 105947. [19] LI X Y, CHEN S, LI Z. Statistical characteristics of warm season raindrop size distribution in the Beibu Gulf, South China[J]. Remote Sens, 2022, 14(19): 4 752. [20] FULTON R A, BREIDENBACH J P, SEO D J. The WSR-88D rainfall algorithm[J]. Wea Forecasting, 1998, 13(2): 377-395. [21] ZENG Y, YANG L M, TONG Z P. Statistical characteristics of raindrop size distribution during rainy seasons in Northwest China[J]. Adv Meteorol, 2021, 23(10): 1-12. [22] HUANG C Y, CHEN S, ZHANG A. Statistical characteristics of raindrop size distribution in monsoon season over South China Sea[J]. Remote Sens, 2021, 13(15): 2 878. [23] WEN L, ZHAO K, CHEN G. Drop size distribution characteristics of seven typhoons in China[J]. J Geophys Res-atmos, 2018, 123(12): 6 529-6 548. [24] HERSBACH H, BELL B, BERRISFORD P. The ERA5 global reanalysis[J]. Q J R Meteorol Soc, 2020, 146(730): 1 999-2 049. [25] TOKAY A, WOLFF D B, PETERSEN W A. Evaluation of the new version of the laser-optical disdrometer, OTT Parsivel2[J]. J Atmos and Ocean Technol, 2014, 31(6): 1 276-1 288. [26] WEN L, ZHAO K, ZHANG G F. Impacts of instrument limitations on estimated raindropsize distribution, radar parameters, and model microphysics during Mei-Yu Season in East China[J]. J Atmos Ocean Tech, 2017, 34(5): 1 021-1 037. [27] WU Z, ZHANG Y, ZHANG L. Characteristics of summer season raindrop size distribution in three typical regions of western Pacific[J]. J Geophys Res-atmos, 2019, 124(7): 4 054-4 073. [28] TOKAY A, PETERSEN W A, GATLIN P. Comparison of raindrop size distribution measurements by collocated disdrometers[J]. J Atmos Ocean Technol, 2013, 30(8): 1 672-1 690. [29] FRIEDRICH K, HIGGINS S, MASTERS F J. Articulating and stationary PARSIVEL disdrometer measurements in conditions with strong winds and heavy rainfall[J]. J Atmos Ocean Technol, 2013, 30(9): 2 063-2 080. [30] BRANDES E A, ZHANG G F, VIVEKANANDAN J. Experiments in rainfall estimation with a polarimetric radar in a subtropical environment[J]. J Appl Meteor, 2002, 41(6): 674-685. [31] ULBRICH C W. Natural variations in the analytical form of the raindrop size distribution[J]. J Climate Appl Meteor, 1983, 22(10): 1 764-1 775. [32] ZHANG G F, VIVEKANANDAN J, BRANDES E A. The shape-slope relation in observed gamma raindrop size distributions: Statistical error or useful information?[J]. J Atmos Ocean Technol, 2003, 20(8): 1 106-1 119. [33] VIVEKANANDAN J, ZHANG G F, BRANDES E. Polarimetric radar estimators based on a constrained gamma drop size distribution model[J]. J Appl Meteor, 2004, 43(2): 217-230. [34] RADHAKRISHNA B, RAO T N, RAO D N. Spatial and seasonal variability of raindrop size distributions in southeast India[J]. J Geophys Res-atmos, 2009, 114(D4): 1 984-2 012. [35] CHEN G, ZHAO K, WEN L. Microphysical characteristics of three convective events with intense rainfall observed by polarimetric radar and disdrometer in Eastern China[J]. Remote Sensing, 2019, 17(11): 2004. [36] MUNCHAK S J, CHRISTIAN D K, Gregory E. Relationships between the raindrop size distribution and properties of the environment and clouds inferred from TRMM[J]. J Climate, 2012, 25(8): 2 963-2 978. [37] WEN L, ZHAO K, YANG Z L. Microphysics of stratiform and convective precipitation during Meiyu season in Eastern China[J]. J Geophys Res-atmos, 2020, 125(24): e2020JD032677. -

 点击查看大图
计量
- 文章访问数: 249
- HTML全文浏览量: 45
- PDF下载量: 38
- 被引次数: 0
 粤公网安备 4401069904700003号