THE CHARACTERISTICS OF SPATIOTEMPORAL DISTRIBUTION OF HAZE WEATHER IN NORTH CHINA DURING 2003—2014
-
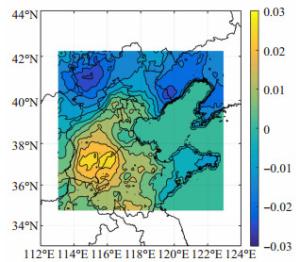
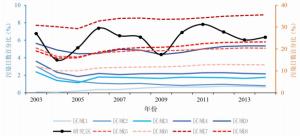
摘要: 华北及周边地区PM2.5造成的污染, 近十年来引起了社会的广泛关注, 也是科学研究的重要领域。利用2003—2014年的卫星遥感MODIS AOD数据和2014—2015年的地面观测PM2.5浓度数据, 采用聚类分析、混合效应模型、EOF分解等统计分析方法, 反演了2003—2014年华北及周边地区PM2.5浓度, 分析其时空分布特征。主要结论如下:(1)卫星遥感MODIS AOD与地面观测PM2.5值有较高的相关系数, 可利用MODIS卫星遥感AOD对地面观测的PM2.5浓度进行反演; (2)华北地区PM2.5浓度呈现出明显的空间分布特征:太行山脉是污染强弱明确的分界线, 山脉东南部的污染显著高于西部, 且在地势变化的地方出现明显的突变; 河北南部、河南北部和山东西北部分区域是污染最严重的地区; (3)2004年、2009年以及2013年后都是污染浓度比较低的年份。
-
关键词:
- AOD /
- PM2.5污染 /
- mixed effect model(混合效应模型) /
- 华北地区 /
- EOF分解
Abstract: In north China, haze pollution has aroused wide concern of the society in the past ten years. Based on satellite remote sensing of aerosol optical thickness (AOD) and ground-based observation of PM2.5 data, linear regression, cluster analysis, and other statistical analysis methods were used to study the spatiotemporal distribution characteristics. The results showed that: (1) The AOD had higher correlation coefficient with the ground-observed PM2.5 value, and can be used for the inversion of PM2.5 in the study area. (2) In north China and the surrounding areas, PM2.5 presented obvious spatial distribution, the Taihang Mountains was the clear dividing line of the intensity of pollution, contamination of the southeastern mountains was significantly higher than that of the northwest and there were obvious abrupt changes where the terrain varied. Small parts of the southern Hebei Province, northern Henan Province and southern and northwestern parts of Shandong Province were the most polluted areas. (3) Relatively low pollution concentrations happened in 2004, 2009 and the years after 2013.-
Key words:
- MODIS AOD /
- PM2.5 pollution /
- mixed effect model /
- North China /
- EOF
-
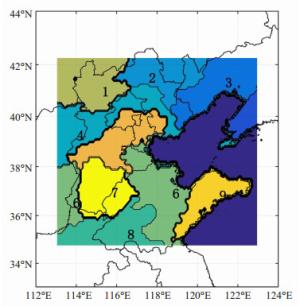
表 1 9个区域所在位置
区域编号 区域名称 1 张家口地区 2 赤峰-承德地区 3 辽宁西南地区 4 张家口南部-北京北部地区 5 河北中部-北京南部-天津地区 6 山东中部、山西东南地区 7 河北南部地区 8 山东西南-河南东北地区 9 山东半岛地区 表 2 不同区域污染情况的相关系数
均通过0.01显著性检验。 区域 区域1 区域2 区域3 区域4 区域5 区域6 区域7 区域8 区域9 区域1 1.00 0.67 0.44 0.69 0.56 0.36 0.38 0.21 0.14 区域2 0.67 1.00 0.71 0.78 0.67 0.47 0.46 0.29 0.23 区域3 0.44 0.71 1.00 0.73 0.64 0.50 0.43 0.31 0.38 区域4 0.69 0.78 0.73 1.00 0.82 0.59 0.57 0.35 0.33 区域5 0.56 0.67 0.64 0.82 1.00 0.67 0.72 0.42 0.27 区域6 0.36 0.47 0.50 0.59 0.67 1.00 0.80 0.72 0.59 区域7 0.38 0.46 0.43 0.57 0.72 0.80 1.00 0.69 0.35 区域8 0.21 0.29 0.31 0.35 0.42 0.72 0.69 1.00 0.45 区域9 0.14 0.23 0.38 0.33 0.27 0.59 0.35 0.45 1.00 -
[1] LIU X, LI J, QU Y. Formation and evolution mechanism of regional haze: a case study in the megacity Beijing, China[J]. Atmospheric Chemistry And Physics, 2013, 13(9): 4 501-4 514. [2] GUO Y, FENG N, CHRISTOPHER S A. Satellite remote sensing of fine particulate matter(PM2.5) air quality over Beijing using MODIS[J]. International Journal of Remote Sensing, 2014, 35(17): 6 522-6 544. [3] JERRETT M. The death toll from air-pollution sources[J]. Nature, 2015, 525(7 569): 330-331. [4] KAUFMAN YJ, TANRÉ D, BOUCHER O. A satellite view of aerosols in the climate system[J]. Nature, 2002, 419(6 903): 215-223. [5] NEL A. Air pollution-related illness: effect of particals[J]. Science, 2005, 308(5 723):804-806. [6] LELIEVELD J, EVANS JS, FNAIS M. The contribution of outdoor air pollution sources to premature mortality on a global scale[J]. Nature, 2015, 525(7 569): 367-371. [7] LIM S S, VOS T, FLAXMAN A D. A comparative risk assessment of burden of disease and injury attributableto 67 risk factors and risk factor clusters in 21 regions, 1990—2010: A systematic analysis for the global burdenof disease study 2010[J]. The Lancet, 2012, 380(9 859): 2 224-2 260. [8] LEVY R C, REMER L A, KLEIDMAN R G. Global evaluation of the Collection 5 MODIS dark-target aerosol products over land[J]. Atmospheric Chemistry and Physics, 2010, 10(21): 10 399-104 20. [9] REMER L A, KAUFMAN Y J, TANRé D. The MODIS aerosol algorithm, products, and Validation[J]. Amer Meteor Soc, 2005, 62(4): 947-973. [10] 范引琪, 李春强. 1980-2003年京津冀地区大气能见度变化趋势研究[J].高原气象, 2008, 27(6): 1 392-1 401. [11] 胡亚旦, 周自江.中国霾天气的气候特征分析[J].气象, 2009, 35(7): 73-78. [12] 吴兑, 吴晓京, 李菲. 1951-2005年中国大陆霾的时空变化[J].气象学报, 2010, 68(5): 680-688. [13] 邓玉娇, 王捷纯, 何全军.基于MODIS资料分析近15年广州城市热岛特征及演变规律[J].热带气象学报, 2018, 34(6): 755-762. [14] 陈立, 张杰, 刘振元.基于MODIS云产品的AIRS云相态的识别和云量产品的检验[J].热带气象学报, 2015, 31(4): 486-496. [15] 邓玉娇, 王捷纯, 曹静.基于MODIS遥感资料监测南海白天雾[J].热带气象学报, 2013, 29(6): 1 046-1 050. [16] 陈爱军, 周芬, 梁学伟.中国地区MODIS地表反照率反演结果的时空分布研究[J].大气科学学报, 2018, 41(2): 267-274. [17] ZHANG Q, JIANG X, TONG D. Transboundary health impacts of transported global air pollution and international trade[J]. Nature, 2017, 543(7 647): 705-709. [18] ENGEL-COX J A, HOFF R M, ROGERS R. Integrating lidar and satellite optical depth with ambient monitoring for 3-dimensional particulate characterization[J]. Atmos Environ, 2006, 40(40): 8 056-8 067. [19] GUPTA P, CHRISTOPHER S A. Particulate matter air quality assessment using integrated surface, satellite, and meteorological products: Multiple regression approach[J]. J Geophy Res, 2009, 114(D20205): 1-14 [20] LIU Y, PARK R J, JACOB D J. Mapping annual mean ground-level PM2.5 concentrations using Multiangle Imaging Spectroradiometer aerosol optical thickness over the contiguous United States[J]. J Geophy Res: Atmos, 2004, 109(D22206): 1-10. [21] VAN DONKELAAR A, MARTIN R V, LEVY R C. Satellite-based estimates of ground-level fine particulate matter during extreme events: A case study of the Moscow fires in 2010[J]. Atmos Environ, 2011, 45(34): 6 225-6 232. [22] RAMACHANDRAN S. Aerosol optical depth and fine mode fraction variations deduced from Moderate Resolution Imaging Spectroradiometer (MODIS) over four urban areas in India[J]. J Geophy Res, 2007, 112(D16): D16207-16217. [23] 林楚勇, 邓玉娇, 徐剑波.基于MODIS的广东省气溶胶光学厚度时空分布特征分析[J].热带气象学报, 2015, 31(6): 821-826. [24] 许潇锋, 刘晨璇, 唐志伟, 等.基于CALIPSO的华北地区气溶胶垂直分布特征[J].大气科学学报, 2018, 41(1): 126-134. [25] LIU Y, SARNAT JA, KILARU V. Estimating Ground-Level PM2.5 in the Eastern United States using satellite remote sensing[J]. Environmental Science & Technology, 2005, 39(9): 3 269-3 278. [26] 李本纲, 冉阳, 陶澍.北京市气溶胶的时间变化与空间分布特征[J].环境科学学报, 2008, 28(7): 1 425 -1 429. [27] XIE Y, ZHANG Y, XIONG X X. Validation of MODIS aerosol optical depth product over China using CARSNET measurements[J]. Atmos Env, 2011, 45(33): 5 970-5 978. [28] 焦利民, 张博恩, 许刚.气溶胶光学厚度与PM2.5浓度相关关系的时空变异[J].干旱区资源与环境, 2016, 30(12): 34-39. [29] 秦玮, 范广强, 袁琦.南京市近地面颗粒物浓度与MODIS气溶胶产品定量关系研究[J].环境科技, 2016, 29(4): 64-69. [30] 范萌, 张胜敏, 陈良富.珠三角地区长时间序列气溶胶时空变化特征分析[J].遥感学报, 2016, 20(6): 1 613-1 623. [31] KLOOG I, NORDIO F, COULL B A. Incorporating local land use regression and satellite aerosol optical depth in a hybrid model of spatiotemporal PM2.5 exposures in the Mid-Atlantic states[J]. Environmental Science and Technology, 2012, 46(21): 11 913-11 921. [32] LIU Y, PACIOREK CJ, KOUTRAKIS P. Estimating regional spatial and temporal variability of PM2.5 concentrations using satellite data, meteorology, and land use information[J]. Environ Health Perspect, 2009, 117(6): 886-892. [33] WANG J. Intercomparison between satellite-derived aerosol optical thickness and PM2.5 mass: Implications for air quality studies[J]. Geophy Res Lett, 2003, 30 (21): 267-283. [34] LIU Y, FRANKLIN M, KAHN R. Using aerosol optical thickness to predict ground-level PM2.5 concentrations in the St. Louis area: A comparison between MISR and MODIS[J]. Remote Sensing of Environment, 2007, 107(2): 33-44. [35] HENDERSON C R. Estimation of general specific and maternal combining abilities[J]. Nida Research Monograph, 1948, 37: 241-270. [36] LEE H J, LIU Y, COULL B A. A novel calibration approach of MODIS AOD data to predict PM2.5 concentrations[J]. Atmospheric Chemistry and Physics, 2011, 11(15): 7 991-8 002. [37] MA Z, LIU Y, ZHAO Q. Satellite-derived high resolution PM2.5 concentrations in Yangtze River Delta Region of China using improved linear mixed effects model[J]. Atmos Environ, 2016, 133: 156-164. [38] 康娜, 辛金元, 蔺永耀.北京山前典型细粒子污染过程的气象条件分析[J].环境科学研究, 2009, 22(9): 1 013-1 020. [39] 杨雨灵, 谭吉华, 孙家仁.华北地区一次强灰霾污染的天气学效应[J].气候与环境研究, 2015, 20(5): 555-570. [40] XIE Y, WANG Y, ZHANG K. Daily Estimation of Ground-Level PM2.5 Concentrations over Beijing Using 3 km Resolution MODIS AOD[J]. Environmental Science and Technology, 2015, 49(20): 12 280-12 288. [41] LORENZ E N. Emprical orthogonal functions and statistical weather prediction[M]. Cambridge: Statistical Forecasting Project Department of Meteorology, MIT, 1956: 49. [42] 曹国良, 张小曳, 龚山陵.中国区域主要颗粒物及污染气体的排放源清单[J].中国科学, 2011, 56(8): 781-788. [43] ZHANG Q, STREETS D G, CARMICHAEL G R. Asian emissions in 2006 for the NASA INTEX-B mission[J]. Atmospheric Chemistry and Physics, 2009, 9(14): 5 131-5 153. [44] BARNES W L, PAGANO T S, SALOMONSON V V. Prelaunch Characteristics of the Moderate Resolution Imaging Spectroradiometer (MODIS) on EOS-AM1[J]. IEEE Transactions on Geosciences & sremote Sensing, 1998, 36(4): 1 088-1 100. [45] 李璇, 聂滕, 齐珺. 2013年1月北京市PM2.5区域来源解析[J].环境科学, 2015, 36(4): 1 148-1 153. [46] 汤静, 王春林, 谭浩波, 等.利用PCA-kNN方法改进广州市空气质量模式PM2.5预报[J].热带气象学报, 2019, 35(1): 125-134. [47] 钱俊龙, 牛文胜, 查书瑶, 等.外来输送对江苏冬季PM2.5贡献的数值模拟研究[J].热带气象学报, 2019, 35(5):673-680. -


 下载:
下载:


 粤公网安备 4401069904700003号