


SPATIO-TEMPORAL CHARACTERISTICS OF RAINSTORM IN KUNSHAN AND RECKONING OF DESIGNED RAINSTORM INTENSITY FORMULA
-
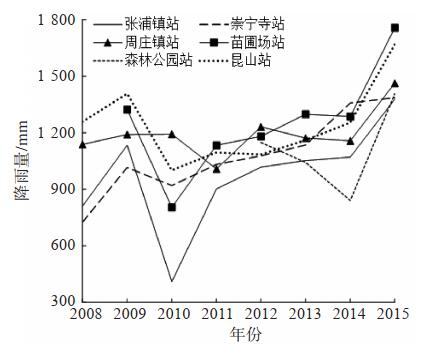
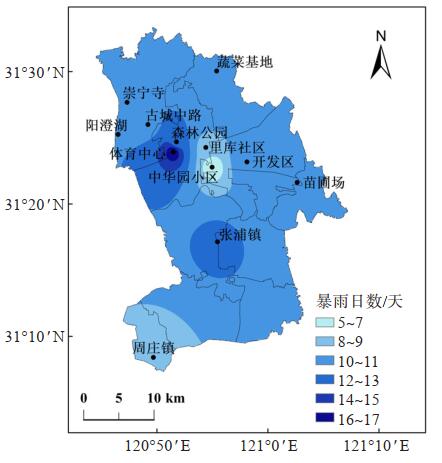
摘要: 基于江苏省昆山市2008—2015年12个自动气象站逐分钟降雨数据和常规气象站小时降雨量数据,并选取5个代表站分别代表不同的生态系统,先对昆山市降雨和暴雨的时空特征进行分析,然后采用年多个样法进行暴雨选样,利用指数分布、皮尔逊Ⅲ型分布和耿贝尔分布分析暴雨发生频率,最后使用高斯-牛顿法推求不同生态系统代表站的暴雨强度公式参数,结果表明:(1)昆山市各站点2008—2015年期间年降雨量都呈增长趋势,夏季降雨量最多、冬季最少,一天中01时(北京时间,下同)左右为降雨谷值,18时左右为降雨峰值,白天降雨多于夜晚; 在空间分布上,农田和城市生态系统的年降雨量、年降雨日数最多,湿地和湖泊生态系统较少。(2)暴雨日数年际差异大,年内暴雨主要集中在夏季,暴雨发生频次日变化呈“双峰型”分布,暴雨发生频次在02时和18时最多,09时和24时最少; 市区的暴雨日数空间变异系数大于郊区,且从市中心向外递减。(3)城市生态系统适宜采用皮尔逊Ⅲ型分布推求暴雨强度公式,其他类型生态系统适宜采用指数分布推求暴雨强度公式。Abstract: Based on the minute-by-minute precipitation data from 12 automatic weather stations and hourly rainfall data from conventional weather stations in Kunshan City from 2008 to 2015, and by selecting five stations to represent different ecosystems, the present study analyzed the spatio-temporal variation characteristics of precipitation and heavy rain in Kunshan City. Multiple rainstorm samples were selected, and the frequency of rainstorm was analyzed by using methods such as exponential distribution, Pearson type III distribution and Gumbel distribution. Finally, the Gauss-Newton method was used to estimate the rainstorm intensity formula parameters of different stations selected to represent ecosystems. The results are as follows. (1) The annual precipitation of each station in Kunshan had an increasing trend during the period of 2008—2015. As for seasonal variation, the precipitation of each station was more in summer and less in winter. In terms of diurnal variation, the valley value of precipitation was reached around 1:00, and the peak value of precipitation was reached around 18:00. The precipitation during daytime was relatively more than that at night. In terms of spatial distribution, the annual precipitation and annual precipitation days of farmland and urban ecosystems were the largest, and those of wetland and lake ecosystems were small. (2) The number of rainstorm days varied greatly from year to year and the rainstorm mainly occurred in summer. The daily variation of the frequency of rainstorm showed a "double-peak" distribution: rainstorms occurred most frequently around 2:00 and around 18:00, and least frequently around 9:00 and around 24:00. The spatial variation coefficient of urban rainstorm days was larger than that of the suburbs, and it decreased from the downtown to peripheral areas. (3) Pearson type III distribution is suitable to derive the rainstorm intensity formula for the urban ecosystem, and exponential distribution is suitable to derive the rainstorm intensity formula for other types of ecosystems.
-

图 12 昆山市2012—2015年年平均的有暴雨月各月暴雨日数空间分布
a.4月; b.5月; c.6月; d.7月; e.8月; f.9月; g.10月; h.12月。
表 1 5个代表站和昆山站一日中峰值时段与谷值时段降雨量差值的全年平均和夏季平均的统计结果
单位:mm。 试点 张浦镇站 崇宁寺站 周庄镇站 苗圃场站 森林公园站 昆山站 全年平均 0.037 0.043 0.027 0.076 -0.001 0.047 夏季平均 0.154 0.194 0.146 0.199 0.054 0.303  下载: 导出CSV
表 2 5个代表站和昆山站白天降雨量和夜晚降雨量的全年平均和夏季平均的统计结果
单位:mm。 时段 张浦镇站 崇宁寺站 周庄镇站 苗圃场站 森林公园站 昆山站 全年平均 白天 1.390 1.287 1.458 1.602 1.486 1.818 夜晚 1.242 1.097 1.234 1.352 1.716 1.500 夏季平均 白天 2.650 2.727 2.949 3.453 2.725 3.977 夜晚 1.737 1.642 1.769 2.141 2.446 2.226
下载: 导出CSV
表 3 基于年多个样法的张浦镇站暴雨选样数据
单位:mm/min。 排序 降雨历时/min 5 10 15 20 30 45 60 90 120 150 180 1 3.64 2.83 2.56 2.27 1.92 1.45 1.16 0.83 0.63 0.51 0.42 2 3.44 2.82 2.55 2.26 1.92 1.45 1.16 0.83 0.63 0.51 0.42 …… …… …… …… …… …… …… …… …… …… …… …… 31 1.76 1.48 1.35 1.10 0.74 0.52 0.40 0.31 0.27 0.26 0.22 32 1.70 1.47 1.35 1.10 0.74 0.51 0.40 0.31 0.27 0.26 0.22
下载: 导出CSV
表 4 张浦镇站降雨数据指数分布的P-i-t表
单位:mm/min。 重现期/a 降雨历时/min 5 10 15 20 30 45 60 90 120 150 180 10 4.047 3.233 3.000 2.745 2.284 1.707 1.405 1.001 0.741 0.582 0.480 5 3.652 2.930 2.690 2.439 2.011 1.500 1.234 0.878 0.654 0.517 0.429 3 3.360 2.707 2.461 2.213 1.810 1.346 1.108 0.787 0.590 0.469 0.391 2 3.129 2.530 2.279 2.034 1.651 1.225 1.009 0.716 0.539 0.431 0.361 1 2.733 2.227 1.969 1.728 1.378 1.017 0.838 0.593 0.452 0.366 0.310 0.5 2.338 1.924 1.658 1.421 1.106 0.809 0.667 0.470 0.365 0.302 0.259 0.33 2.101 1.743 1.472 1.238 0.943 0.685 0.565 0.396 0.313 0.263 0.228 0.25 1.942 1.622 1.348 1.115 0.833 0.601 0.496 0.347 0.278 0.237 0.208 绝对方差 0.113 0.091 0.112 0.121 0.100 0.088 0.069 0.041 0.029 0.023 0.019
下载: 导出CSV
表 5 张浦镇站降雨数据皮尔逊Ⅲ型分布的P-i-t表
单位:mm/min。 重现期/a 降雨历时/min 5 10 15 20 30 45 60 90 120 150 180 10 3.640 2.830 2.560 2.265 1.917 1.453 1.157 0.833 0.633 0.508 0.424 5 3.440 2.790 2.530 2.259 1.913 1.451 1.155 0.833 0.633 0.508 0.424 3 3.350 2.740 2.487 2.238 1.908 1.450 1.154 0.831 0.633 0.508 0.424 2 3.240 2.580 2.330 2.138 1.707 1.232 1.024 0.741 0.561 0.450 0.375 1 3.170 2.400 2.170 2.023 1.507 1.016 0.895 0.652 0.489 0.391 0.326 0.5 2.890 2.330 2.117 1.993 1.507 1.012 0.894 0.652 0.489 0.391 0.326 0.33 2.640 2.285 2.083 1.940 1.505 1.010 0.891 0.652 0.489 0.391 0.326 0.25 2.554 2.203 2.008 1.830 1.447 0.971 0.839 0.628 0.475 0.382 0.319 绝对方差 0.048 0.028 0.038 0.033 0.044 0.041 0.027 0.019 0.015 0.011 0.009
下载: 导出CSV
表 6 张浦镇站降雨数据耿贝尔分布的P-i-t表
单位:mm/min。 重现期/a 降雨历时/min 5 10 15 20 30 45 60 90 120 150 180 10 3.640 2.830 2.560 2.265 1.917 1.453 1.157 0.833 0.633 0.508 0.424 5 3.440 2.790 2.530 2.259 1.913 1.451 1.155 0.833 0.633 0.508 0.424 3 3.350 2.740 2.487 2.238 1.908 1.450 1.154 0.831 0.633 0.508 0.424 2 3.240 2.580 2.330 2.138 1.707 1.232 1.024 0.741 0.561 0.450 0.375 1 3.170 2.400 2.170 2.023 1.507 1.016 0.895 0.652 0.489 0.391 0.326 0.5 2.890 2.330 2.117 1.993 1.507 1.012 0.894 0.652 0.489 0.391 0.326 0.33 2.640 2.285 2.083 1.940 1.505 1.010 0.891 0.652 0.489 0.391 0.326 0.25 2.568 2.224 2.023 1.846 1.457 0.978 0.861 0.631 0.475 0.381 0.318 绝对方差 0.046 0.029 0.040 0.035 0.045 0.041 0.029 0.019 0.015 0.011 0.009
下载: 导出CSV
表 7 5个代表站在三种频率分布下的绝对方差
单位:mm/min。 站点 指数分布 皮尔逊Ⅲ型分布 耿贝尔分布 张浦镇 0.073 1 0.028 4 0.029 1 崇宁寺 0.108 5 0.046 6 0.032 2 周庄镇 0.098 2 0.035 7 0.035 6 苗圃场 0.121 1 0.048 7 0.048 6 森林公园 0.072 8 0.023 1 0.028 1
下载: 导出CSV
表 8 张浦镇站的设计暴雨强度总公式及误差
频率曲线 历时
t/min暴雨强度公式 绝对方差/(mm/min) 相对方差% P-Ⅲ 5~180 $i=\frac{207.328 \times(1+0.192 \lg P)}{(t+30.481)^{1.188}}$ 0.064 4.945 指数分布 5~180 $i=\frac{158.118 \times(1+0.53 \lg P)}{(t+28.502)^{1.163}}$ 0.074 4.994 耿贝尔 5~180 $i=\frac{210.027 \times(1+0.19 \lg P)}{(t+30.602)^{1.19}}$ 0.074 4.976
下载: 导出CSV
表 9 崇宁寺站的设计暴雨强度总公式及误差
频率曲线 历时
t/min暴雨强度公式 绝对方差/(mm/min) 相对方差% P-Ⅲ 5~180 $i=\frac{66.253 \times(1+0.186 \lg P)}{(t+22.849)^{0.995}}$ 0.110 8.413 指数分布 5~180 $i=\frac{106.2 \times(1+0.775 \lg P)}{(t+30.44)^{1.115}}$ 0.041 4.415 耿贝尔 5~180 $i=\frac{87.179 \times(1+0.201 \lg P)}{(t+26.403)^{1.045}}$ 0.081 6.515
下载: 导出CSV
表 10 周庄镇站的设计暴雨强度总公式及误差
频率曲线 历时
t/min暴雨强度公式 绝对方差/(mm/min) 相对方差% P-Ⅲ 5~180 $i=\frac{97.245 \times(1+0.24 \lg P)}{(t+23.303)^{1.064}}$ 0.111 8.408 指数分布 5~180 $i=\frac{56.915 \times(1+0.836 \lg P)}{(t+19.366)^{1.002}}$ 0.068 5.693 耿贝尔 5~180 $i=\frac{91.193 \times(1+0.231 \lg P)}{(t+22.492)^{1.052}}$ 0.111 8.392
下载: 导出CSV
表 11 苗圃场站的设计暴雨强度总公式及误差
频率曲线 历时
t/min暴雨强度公式 绝对方差/(mm/min) 相对方差% P-Ⅲ 5~180 $i=\frac{86.773 \times(1+0.244 \lg P)}{(t+31.186)^{0.905}}$ 0.161 5.874 指数分布 5~180 $i=\frac{35.827 \times(1+0.755 \lg P)}{(t+23.05)^{0.76}}$ 0.115 5.595 耿贝尔 5~180 $i=\frac{84.275 \times(1+0.2421 \lg P)}{(t+30.857)^{0.898}}$ 0.162 5.920
下载: 导出CSV
表 12 森林公园站的设计暴雨强度总公式及误差
频率曲线 历时
t/min暴雨强度公式 绝对方差/(mm/min) 相对方差% P-Ⅲ 5~180 $i=\frac{17.939 \times(1+0.185 \lg P)}{(t+12.401)^{0.722}}$ 0.085 7.353 指数分布 5~180 $i=\frac{4.14 \times(1+0.584 \lg P)}{(t+2.203)^{0.467}}$ 0.062 7.079 耿贝尔 5~180 $i=\frac{18.432 \times(1+0.1861 \lg P)}{(t+12.576)^{0.729}}$ 0.082 7.114
下载: 导出CSV
表 13 指数分布推求的各代表站设计暴雨强度公式参数
站点 A1 C b n 绝对方差/(mm/min) 相对方差/% 张浦镇(城市) 158.118 0.530 28.502 1.163 0.064 4.945 崇宁寺(湖泊) 106.200 0.775 30.440 1.115 0.041 4.415 周庄镇(湿地) 56.915 0.836 19.366 1.002 0.068 5.693 苗圃场(农田) 35.827 0.755 23.050 0.760 0.115 5.595 森林公园(森林) 4.140 0.584 2.203 0.467 0.062 7.079
下载: 导出CSV
表 14 皮尔逊Ⅲ型分布推求的各代表站设计暴雨强度公式参数
站点 A1 C b n 绝对方差/(mm/min) 相对方差/% 张浦镇(城市) 207.328 0.192 30.481 1.188 0.074 4.994 崇宁寺(湖泊) 66.253 0.186 22.849 0.995 0.110 8.413 周庄镇(湿地) 97.245 0.240 23.303 1.064 0.111 8.408 苗圃场(农田) 86.773 0.244 31.186 0.905 0.161 5.874 森林公园(森林) 17.939 0.185 12.401 0.722 0.085 7.353
下载: 导出CSV
表 15 耿贝尔分布推求的各代表站设计暴雨强度公式参数
站点 A1 C b n 绝对方差/(mm/min) 相对方差/% 张浦镇(城市) 210.027 0.190 30.602 1.190 0.074 4.976 崇宁寺(湖泊) 87.179 0.201 26.403 1.045 0.081 6.515 周庄镇(湿地) 91.193 0.230 22.492 1.052 0.111 8.392 苗圃场(农田) 84.275 0.242 30.857 0.898 0.162 5.920 森林公园(森林) 18.432 0.186 12.576 0.729 0.082 7.114
下载: 导出CSV
-
[1] 刘家宏, 李泽锦, 梅超, 等.基于TELEMAC-2D的不同设计暴雨下厦门岛城市内涝特征分析[J].科学通报, 2019, 64(19): 2055-2066. [2] 梅超, 刘家宏, 王浩, 等.城市设计暴雨研究综述[J].科学通报, 2017, 62(33): 3873-3884. [3] 孔锋, 方建, 吕丽莉.1961-2015年中国暴雨变化诊断及其与多种气候因子的关联性研究[J].热带气象学报, 2018, 34(1): 34-47. [4] HE X H, HU W F.A two-stage queue model to optimize layout of urban drainage system considering extreme rainstorms[J].Mathematical Problems in Engineering, 2017: 1-18. [5] 李亚平.为江苏高水平全面建成小康社会提供坚实水利保障[J].中国水利, 2016(24): 71-72. [6] 张红华, 姚秀萍, 高媛, 等.2016年江淮地区梅汛期首场持续性暴雨的持续原因初探[J].热带气象学报, 2018, 34(5): 674-684. [7] 孔锋, 刘凡, 吕丽莉, 等.1961~2010年中国大尺度区域暴雨时空分布特征研究[J].长江流域资源与环境, 2017, 26(4): 631-640. [8] 刘媛媛, 刘洪伟, 霍风霖, 等.基于机器学习短历时暴雨时空分布规律研究[J].水利学报, 2019, 50(6): 773-779. [9] KOUTSOYIANNIS D, BALOUTSOS G.Analysis of a long record of annual maximum rainfall in Athens, Greece, and design rainfall inferences[J].Natural Hazards, 2000, 22(1): 29-48. [10] YUE S, OUARDA T B M J, BOBÉE B, et al.The Gumbel mixed model for flood frequency analysis[J].Journal of Hydrology, 1999, 226(1-2): 88-100. [11] KARIM T H, KEYA D R, AMIN Z A.Temporal and spatial variations in annual rainfall distribution in Erbil province[J].Outlook on Agriculture, 2018, 47(1): 59-67. [12] 夏宗尧.编制暴雨强度公式中应用P-Ⅲ曲线与指数曲线的比较[J].中国给水排水, 1990, 6(3): 32-38. [13] 邓培德.暴雨选样与频率分布模型及其应用[J].给水排水, 1996, 22(2): 5-9. [14] 邓培德.城市暴雨两种选样方法的概率关系与应用评述[J].给水排水, 2006, 32(6): 39-42. [15] 芮孝芳, 蒋成煜, 陈清锦.论城市排水防涝工程水文问题[J].水利水电科技进展, 2015, 35(1): 42-48. [16] 周文德, 张永平.城市暴雨排水设计问题的预测--概率的考虑[J].水文, 1983(1): 40-43. [17] 方浩, 乔云亭.中国东部夏季极端降水时空分布及环流背景[J].热带气象学报, 2019, 35(4): 517-527. [18] 何红艳, 郭志华, 肖文发.降水空间插值技术的研究进展[J].生态学杂志, 2005, 24(10): 1187-1191. [19] 朱求安, 张万昌, 余钧辉.基于GIS的空间插值方法研究[J].江西师范大学学报(自然版), 2004, 28(2): 183-188. [20] 永静, 叶兴成, 王飞, 等.不同拟合方法推求暴雨强度公式研究[J].水资源与水工程学报, 2017, 28(5): 76-79+86. [21] 刘俊, 周宏, 鲁春辉, 等.城市暴雨强度公式研究进展与述评[J].水科学进展, 2018, 29(6): 898-910. [22] 周玉文, 高琳, 杨伟明, 等.不同选样方法下暴雨频率指数分布曲线的适用性[J].北京工业大学学报, 2016, 42(8): 1245-1251. [23] 新版规范局部修订编制组.2014版《室外排水设计规范》局部修订解读[J].给水排水, 2014, 40(4): 7-11. [24] 刘可新, 胡宇丰, 李匡, 等.基于抽样分布理论的P-Ⅲ型分布均值的不确定性分析[J].水利学报, 2019, 50(4): 420-427. [25] 高琳, 周玉文, 唐颖, 等.城市暴雨强度公式皮尔逊Ⅲ型适线问题研究[J].给水排水, 2016, 52(8): 47-51. [26] FAROOQ M, SHAFIQUE M, KHATTAK M S.Flood frequency analysis of river swat using log Pearson type 3, Generalized Extreme Value, Normal, and Gumbel Max distribution methods[J].Arabian Journal of Geosciences, 2018, 11(9): 1-12. [27] 金光炎.广义极值分布及其在水文中的应用[J].水文, 1998(2): 9-15. [28] BOUDRISSA N, CHERAITIA H, CHERAITIA H.Modelling maximum daily yearly rainfall in northern Algeria using generalized extreme value distributions from 1936 to 2009[J].Meteorological Applications, 2017, 24(1): 1114-1119. [29] 张子贤.用高斯-牛顿法确定暴雨公式参数[J].河海大学学报(自然科学版), 1995, 23(5): 106-111. [30] 樊建军, 王峰, 陈鹏飞.利用MATLAB推导城市暴雨强度公式[J].中国给水排水, 2010, 26(11): 111-115. [31] 王杰, 万程炜, 郑敏杰, 等.高斯牛顿法在皮尔逊Ⅲ型曲线适线中的应用[J].人民黄河, 2014, 36(9): 27-30. [32] 林爱兰, 谷德军, 彭冬冬, 等.体现大尺度特征的区域持续性强降水过程定义指标[J].热带气象学报, 2020, 36(3): 289-298. [33] 齐庆华.中国东部降水的极端特性及其气候特征分析[J].热带气象学报, 2019, 35(6): 742-755. [34] 翁笃鸣.小气候和农田小气候[M].北京:农业出版社, 1981: 163-164. [35] 费启, 杨建全, 阿不都外力·阿不力克木, 等.江苏南部汛期降水日变化特征分析[J].气象科学, 2014, 34(6): 678-683. -


 点击查看大图

计量
- 文章访问数: 969
- HTML全文浏览量: 168
- PDF下载量: 26
- 被引次数: 0
 粤公网安备 4401069904700003号