Evaluation of Simulation Effect of Urban Rainstorm Waterlogging Model in Guangzhou
-
摘要: 基于水动力方法构建的广州城市暴雨内涝模型,结合精细化降水预报,对内涝点的积水深度及风险等级进行模拟,结果表明,模型对近两年内涝点内涝风险等级命中率达65%,对总降水量为50~100 mm的降水过程命中率最高为72.8%。模型对2020年“5.22”特大暴雨过程模拟的积水深度和实况相比偏弱,误差主要分布在30 cm以内,大约占64%,大部分模型模拟积水深度偏小,主要位于广州中北部地区;此外,模型对积水1m以下内涝点的积水有不错的模拟能力,而对2m左右的深积水模拟能力还有限。不同重现期雨情下,广州中心城区的降雨量和历时越大,积水面积越大。1 h重现期雨情下,积水深度一般在20 cm以下,部分在20~59 cm;3 h降雨情景下,积水明显加深,积水深度一般在20~59 cm,部分在0~20 cm和60~119 cm。总体而言,模型模拟结果与实测内涝积水情况基本一致,模型准确度可满足业务需求。Abstract: In the present study, a Guangzhou urban rainstorm waterlogging model which is developed using the hydrodynamic method, combined with refined precipitation forecast data, is used to simulate the ponding depth and risk level of waterlogging points in Guangzhou. The results demonstrate that the model has a hit rate of 65% for the waterlogging risk level of the waterlogging points in the past two years, while the highest hit rate is 72.8% for the precipitation processes with accumulated precipitation of 50~100 mm. The simulated ponding depth for the precipitation event on May 22 is relatively shallower compared with the real situation, and the error is mainly found in the simulation for the ponding depth within 30 cm, accounting for about 64%. Most of the simulated ponding depth is shallower and these ponding points are mainly located in the north-central part of Guangzhou. The model has good simulation ability for ponding with depth below 1 m, while the simulation ability for deep ponding around 2 m is still limited. Moreover, the waterlogging conditions are different in the central urban area under different return periods. Under the 1-hour rain condition, the ponding depth is generally less than 20 cm, and some range within 20~59 cm; under the 3-hour rain condition, the ponding depth is generally between 20~59 cm, with some ranging between 0~20 cm and 60~119 cm. Overall, the simulation results roughly match the actual waterlogging situation, and the model accuracy can meet general operational needs.
-
Key words:
- Guangzhou /
- rainstorm waterlogging model /
- waterlogging point /
- ponding depth /
- risk level
-
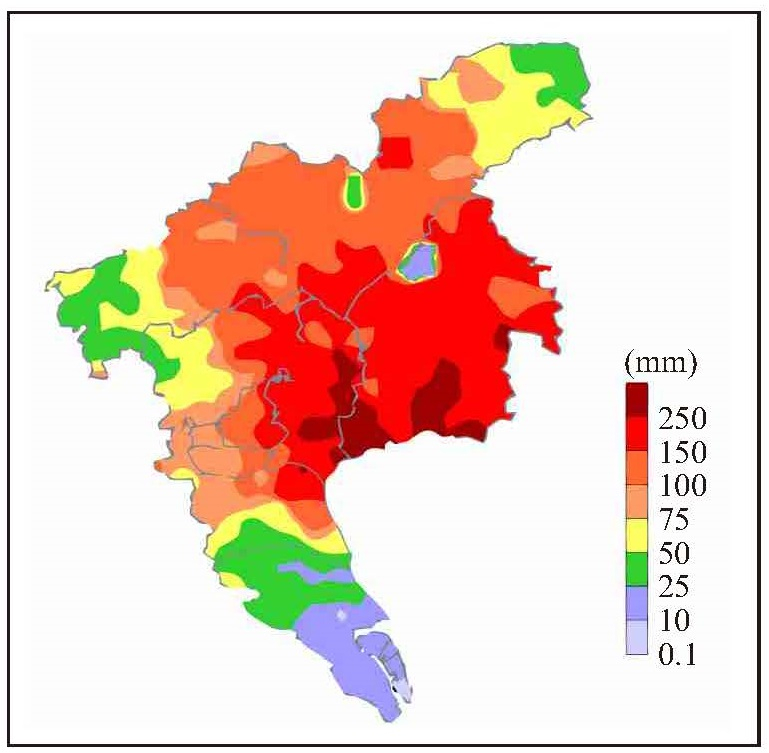
图 3 同图 2,但为模型模拟结果
表 1 广州市暴雨内涝预报等级划分
内涝等级 Ⅰ级 Ⅱ级 Ⅲ级 Ⅳ级 积水深度/cm ≥120.0 60.0~119.9 20.0~59.9 5.0~19.9 表 2 广州暴雨内涝模型积水深度误差统计
降水过程 降水总量/cm 内涝点/个 误差 ≤10 cm 10~20 cm 20~30 cm ≥30 cm 2020年5月21—22日 377 408 25% 15% 24% 36% 表 3 “5.22”积水模拟和实况对比(m)
内涝点 天河立交 车陂隧道北 仙村沙窖石场路 官湖地铁站 开源大道隧道桥底 万洲大桥 新塘沙埔市场 观测 0.3 0.9 2.0 1.5 3.0 0.3 4.0 模拟 0.7 0.6 0.5 0.3 1.2 0.2 0.2 内涝点 天河客运站 广园路桥底 永宁街第一小学 科学大道 派潭小径村 东联学校 新街村祠堂 观测 0.5 0.4 1.6 1.4 1.0 0.6 1.5 模拟 0.3 0.3 1.5 0.1 0.0 0.5 1.1 内涝点 白石瑶田市场 黄埔大道人行隧道 开创大道与广园路交界桥底 科学大道与光宝路 观测 0.8 0.4 2.0 0.5 模拟 0.3 0.0 0.7 0.1 表 4 1 h重现期雨量下的积水模拟结果
重现期/a 雨量/mm 不同深度等级面积/km2 0.05~0.19 m 0.20~0.59 m 0.60~1.19 m > 1.20 m 总面积 10 75 9.67 5.06 1.43 0.07 16.23 20 83 9.55 6.78 2.13 0.18 18.64 30 87 9.29 7.52 2.47 0.23 19.51 50 92 10.02 8.77 2.88 0.21 21.88 100 99 9.25 9.63 3.30 0.46 22.64 表 5 3 h重现期雨量下的积水模拟结果
重现期/a 雨量/mm 不同深度等级面积/km2 0.05~0.19 m 0.20~0.59 m 0.60~1.19 m > 1.20 m 总面积 10 124 7.47 13.27 6.33 0.61 27.68 20 143 5.94 13.48 7.48 0.60 27.50 30 154 5.68 14.83 9.00 0.69 30.20 50 167 4.25 13.89 11.11 0.82 30.07 100 184 5.97 15.51 10.02 0.96 32.46 -
[1] 陈洋波, 覃建明, 董礼明, 等. 广州内涝形成原因与防治对策[J]. 中国防汛抗旱, 2017, 27(5): 72-76. [2] 唐颖, 张永祥, 王昊, 等. 基于雷达外推的城市内涝实时预警[J]. 哈尔滨工业大学学报, 2019, 51(2): 58-62. [3] 陈洋波, 周浩澜, 张会, 等. 东莞市内涝预报模型研究[J]. 武汉大学学报(工学版), 2015, 48(5): 608-614. [4] 石赟赟, 万东辉, 陈黎, 等. 基于GIS和SWMM的城市暴雨内涝淹没模拟分析[J]. 水电能源科学, 2014, 32(6): 57. [5] 万榆, 黄岳文, 彭晓春. 广州城市内涝原因分析与对策研究[J]. 广东水利水电, 2016, 3(3): 27-30. [6] 王婷, 胡琳, 谌志刚. 2020年"5·22"暴雨致广州地铁被淹的原因及解决对策[J]. 广东气象, 2020, 42(4): 52-55. [7] 马晓群, 张爱民, 张家鼎, 等. 基于GIS的市(县) 级旱涝风险区划[J]. 安徽地质, 2002, 12(3) : 171-175. [8] 解以扬, 韩素芹, 由立宏, 等. 天津市暴雨内涝灾害风险分析[J]. 气象科学, 2004, 24(3): 342-349. [9] 解以扬, 李大鸣, 李培彦, 等. 城市暴雨内涝数学模型的研究与应用[J]. 水科学进展, 2005, 16(3): 384-390. [10] 陈波, 冯光柳. 武汉城市强降水内涝仿真模拟系统研制[J]. 暴雨灾害, 2008, 27(4): 330-333. [11] 张萍萍, 王丽, 张宁. 武汉市城市积涝预警系统及其仿真模拟效果[J]. 暴雨灾害, 2010, 29(1): 71-88. [12] 扈海波, 轩春怡, 诸立尚. 北京地区城市暴雨积涝灾害风险预评估[J]. 应用气象学报, 2013, 24(1): 99-108. [13] 尤凤春, 郭丽霞, 史印山, 等. 北京强降雨与道路积水统计分析及应用[J]. 气象, 2013, 39(8): 1 050-1 056. [14] 尹志聪, 郭文利, 李乃杰, 等. 北京城市内涝积水的数值模拟[J]. 气象, 2015, 41(9): 1 111-1 118. [15] 杨辰, 王强, 顾宇丹. 上海市城市暴雨内涝评估建模及模拟研究[J]. 气象, 2017, 43(7): 879-886. [16] LIU M, YANG H Q, XIANG Y C. Risk assessment andregionalization of waterlogging disasters in Hubei Provence[J]. Resour Environ Yangtze Basin, 2002, 11(5): 476-481. [17] HUANG D P, LIU C, FANG H J, et al. Assessment of water logging risk in Lixiahe region of Jiangsu Province based on AVHRR and MODIS image[J]. Chin Geogr Sci, 2008, 18(2): 178-183. [18] 仇劲卫, 李娜, 程晓陶, 等. 天津市城区暴雨沥涝仿真模拟系统[J]. 水利学报, 2000, 31(11): 34-42. [19] 何文华. 城市化对济南市暴雨洪水的影响及其洪水模拟研究[D]. 广州: 华南理工大学, 2010. [20] 喻海军. 城市洪涝数值模拟技术研究[D]. 广州: 华南理工大学, 2015. [21] 黄清雨, 董军刚, 李梦雅, 等. 暴雨内涝危险性情景模拟方法研究——以上海中心城区为例[J]. 地球信息科学学报, 2016, 18(4): 506- 513. [22] 苑希民, 秦旭东, 张晓鹏, 等. 石家庄市暴雨内涝精细化水动力模型应用[J]. 水利水运工程学报, 2017(3): 41-50. [23] 宋利祥, 徐宗学. 城市暴雨内涝水文水动力耦合模型研究进展[J]. 北京师范大学学报(自然科学版), 2019, 55(5): 581-587. [24] 陈靖, 张容焱, 解以扬, 等. 基于城市暴雨内涝数学模型的福州内涝灾害风险评估[J]. 暴雨灾害, 2020, 160(1): 92-98. [25] 潘银, 邵振峰, 程涛, 等. 利用深度学习模型进行城市内涝影响分析[J]. 武汉大学学报(信息科学版), 2019, 44(1): 132-138. [26] 张会, 李铖, 程炯, 等. 基于"H-E-V"框架的城市洪涝风险评估研究进展[J]. 地理科学进展, 2019, 38(2): 175-190. [27] 王静, 李娜, 程晓陶. 城市洪涝仿真模型的改进与应用[J]. 水利学报, 2010(12): 1 393-1 400. [28] 段丽瑶, 解以扬, 陈靖, 等. 基于城市内涝仿真模型的天津风暴潮灾害评估[J]. 应用气象学报, 2014, 25(3): 354-359. [29] 李春梅, 唐力生, 章国才. 城市内涝风险预警服务业务技术指南[M]. 北京: 气象出版社, 2015. [30] 张振国, 温家洪. 城市社区暴雨内涝灾害风险评估[M]. 北京: 民族出版社, 2015. -


 下载:
下载:


 粤公网安备 4401069904700003号