


IMPACT OF TC INTENSITY CHANGE ON PRECIPITATION DISTRIBUTION OVER THE NORTHWESTERN PACIFIC
-
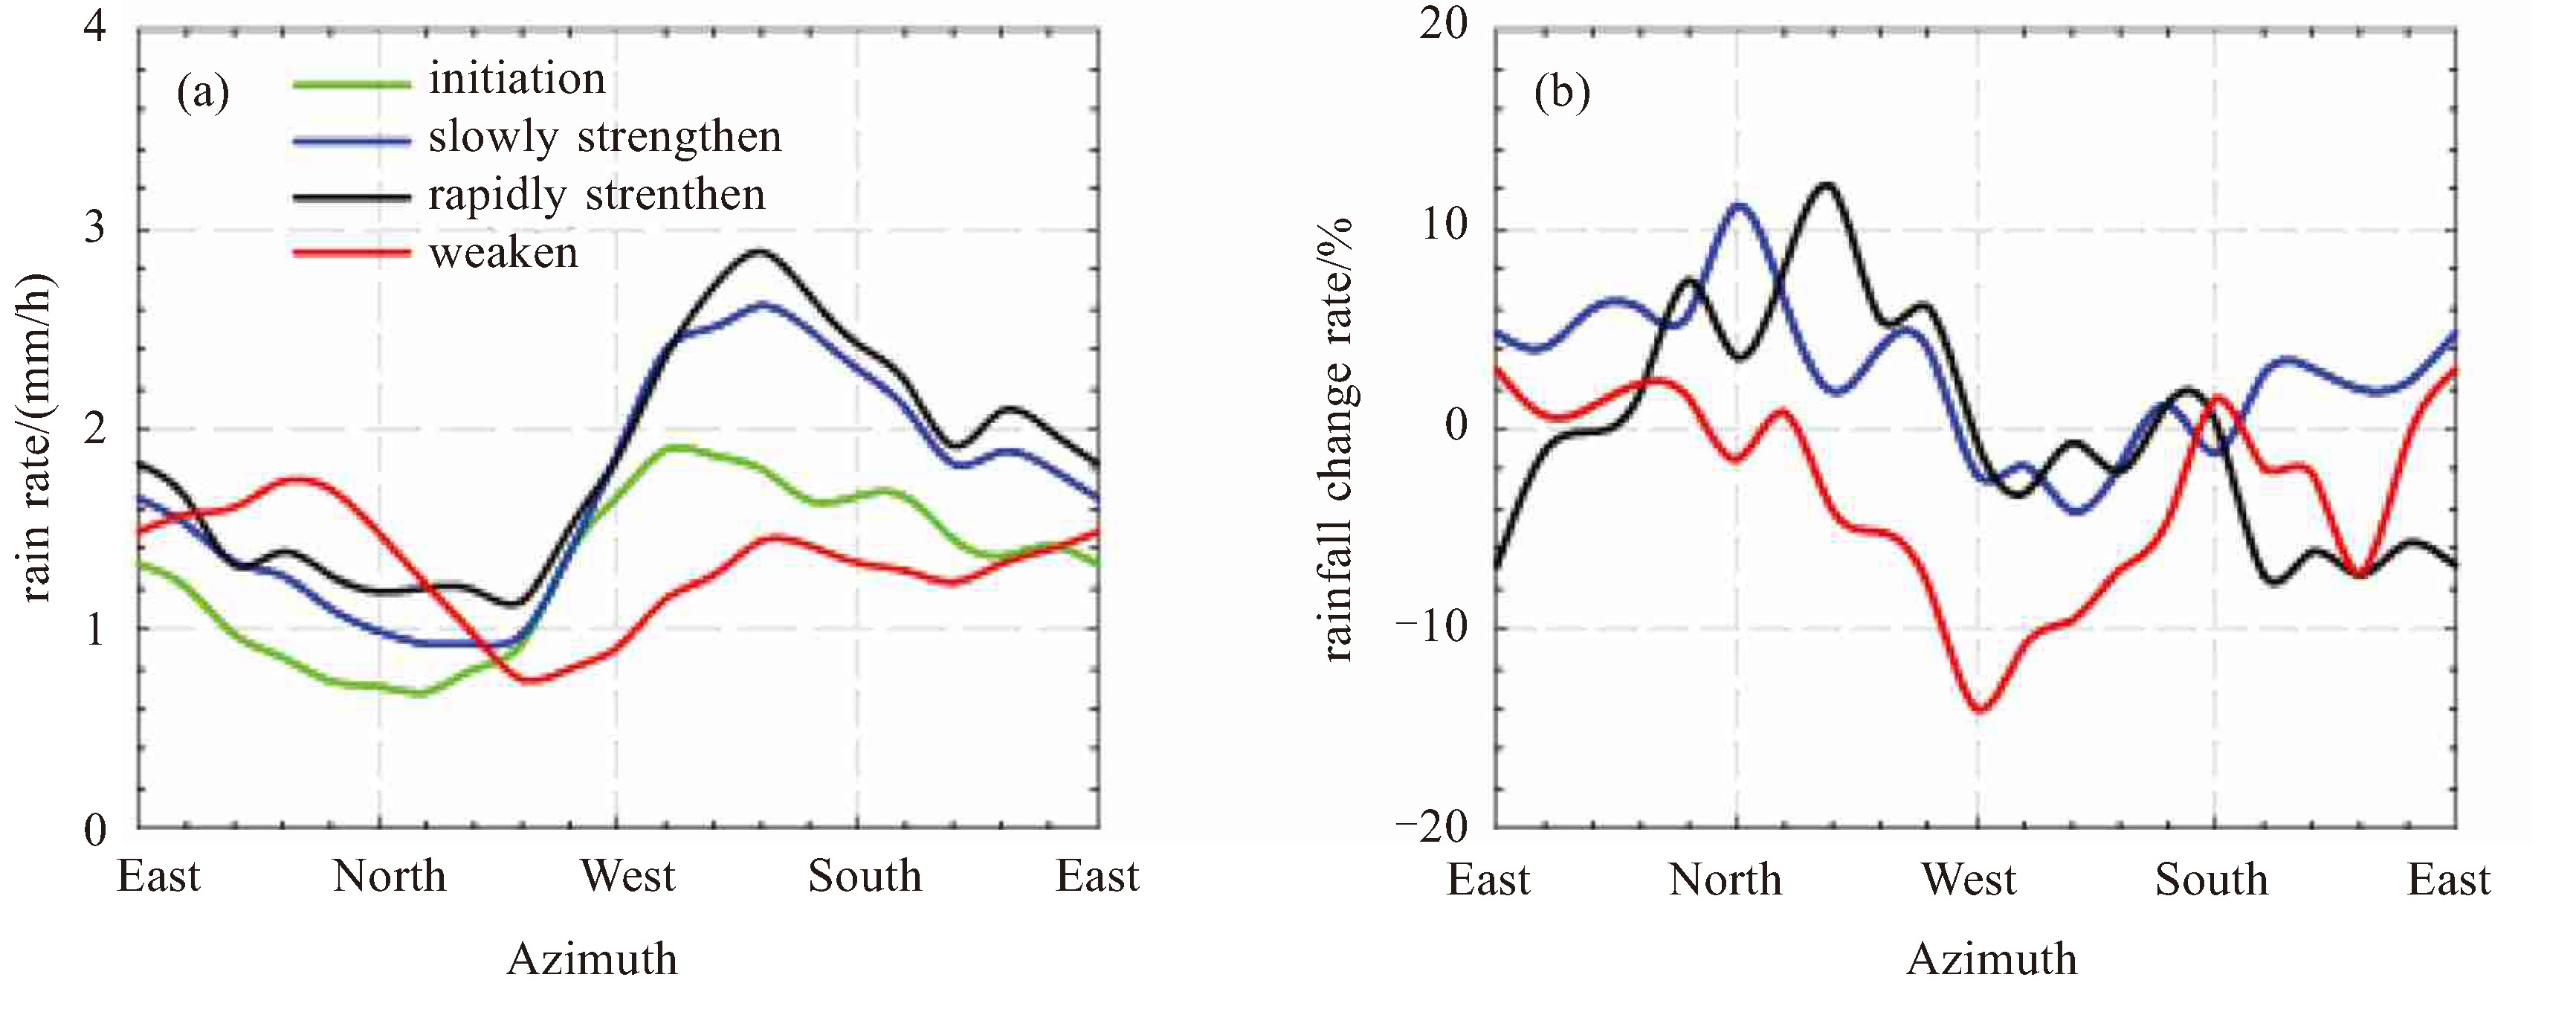
摘要: 已有研究表明热带气旋强度变化与雨带分布间存在紧密联系,然而其在西北太平洋区域的量化特征尚待揭示。利用2000—2018年6—9月的中国气象局(CMA)热带气旋最佳路径数据集和全球测雨计划(GPM)格点级降水数据(IMERG)降水数据,建立了西北太平洋区域热带气旋移动坐标系,并根据气旋中心气压变化将热带气旋分为初生、缓慢增强、快速增强、稳定和消散共五类,在此基础上研究了各类气旋的降水分布及变化特征。结果表明,初生型气旋的降水率在距离气旋中心10 km和40 km处分别存在两个峰值;快速增强型气旋也存在两个峰值,分别出现在10 km和30 km处;缓慢增强和减弱型气旋的降水率随径向距离的变化均呈现出单峰分布,峰值分别出现在40 km和60 km处。气旋内雨带降水变化与气旋强度变化间存在显著的正相关关系;而外雨带降水变化与气旋强度变化间则存在负相关关系。气旋各个方位降水变化对强度变化的响应不同,减弱型热带气旋的降水率减小主要发生在气旋西侧,应与热带气旋登陆过程有关。研究结果可为西北太平洋热带气旋强度及降水模拟提供事实依据。Abstract: Previous studies have revealed the close relationships between the intensity change and rainband distributions of tropical cyclones. However, their quantitative characteristics over the northwestern Pacific are yet to be revealed. In this paper, we used the CMA best track dataset and the GPM IMERG precipitation data from June to September 2000-2018. The tropical cyclones over the northwestern Pacific were classified into five categories, namely initiating, slowly strengthening, rapidly strengthening, stable, and weakening typhoons, respectively. The precipitation distribution as well as its changes for various types of tropical cyclones was studied based on a mobile cyclonic coordinate system. It is shown that the radial rainfall of initiating cyclones peaks at 10 km and 40 km away from cyclonic centers, respectively; the radial rainfall of rapidly strengthening cyclones peaks at 10 km and 30 km away from cyclonic centers, respectively; the radial precipitation distributions for both the slowly strengthening and weakening cyclones present a unimodal distribution, with the peaks appearing at 40 km, and 60 km to the centers, respectively. A significant positive correlation exists between the rainfall change of the inner rainband and cyclonic intensity change, whereas a negative correlation exists between the change of the outer rainband and cyclonic intensity change. Moreover, the precipitation changes in various azimuths of cyclonic centers respond differently to intensity change. Specifically, the decrease of precipitation in weakening cyclones mainly occurs on the west side, which is likely related to the cyclonic landing process. These findings could provide observational evidence for the model of tropical cyclones over the northwestern Pacific.
-
Key words:
- tropical cyclone /
- intensity change /
- rainband distribution /
- precipitation change
-

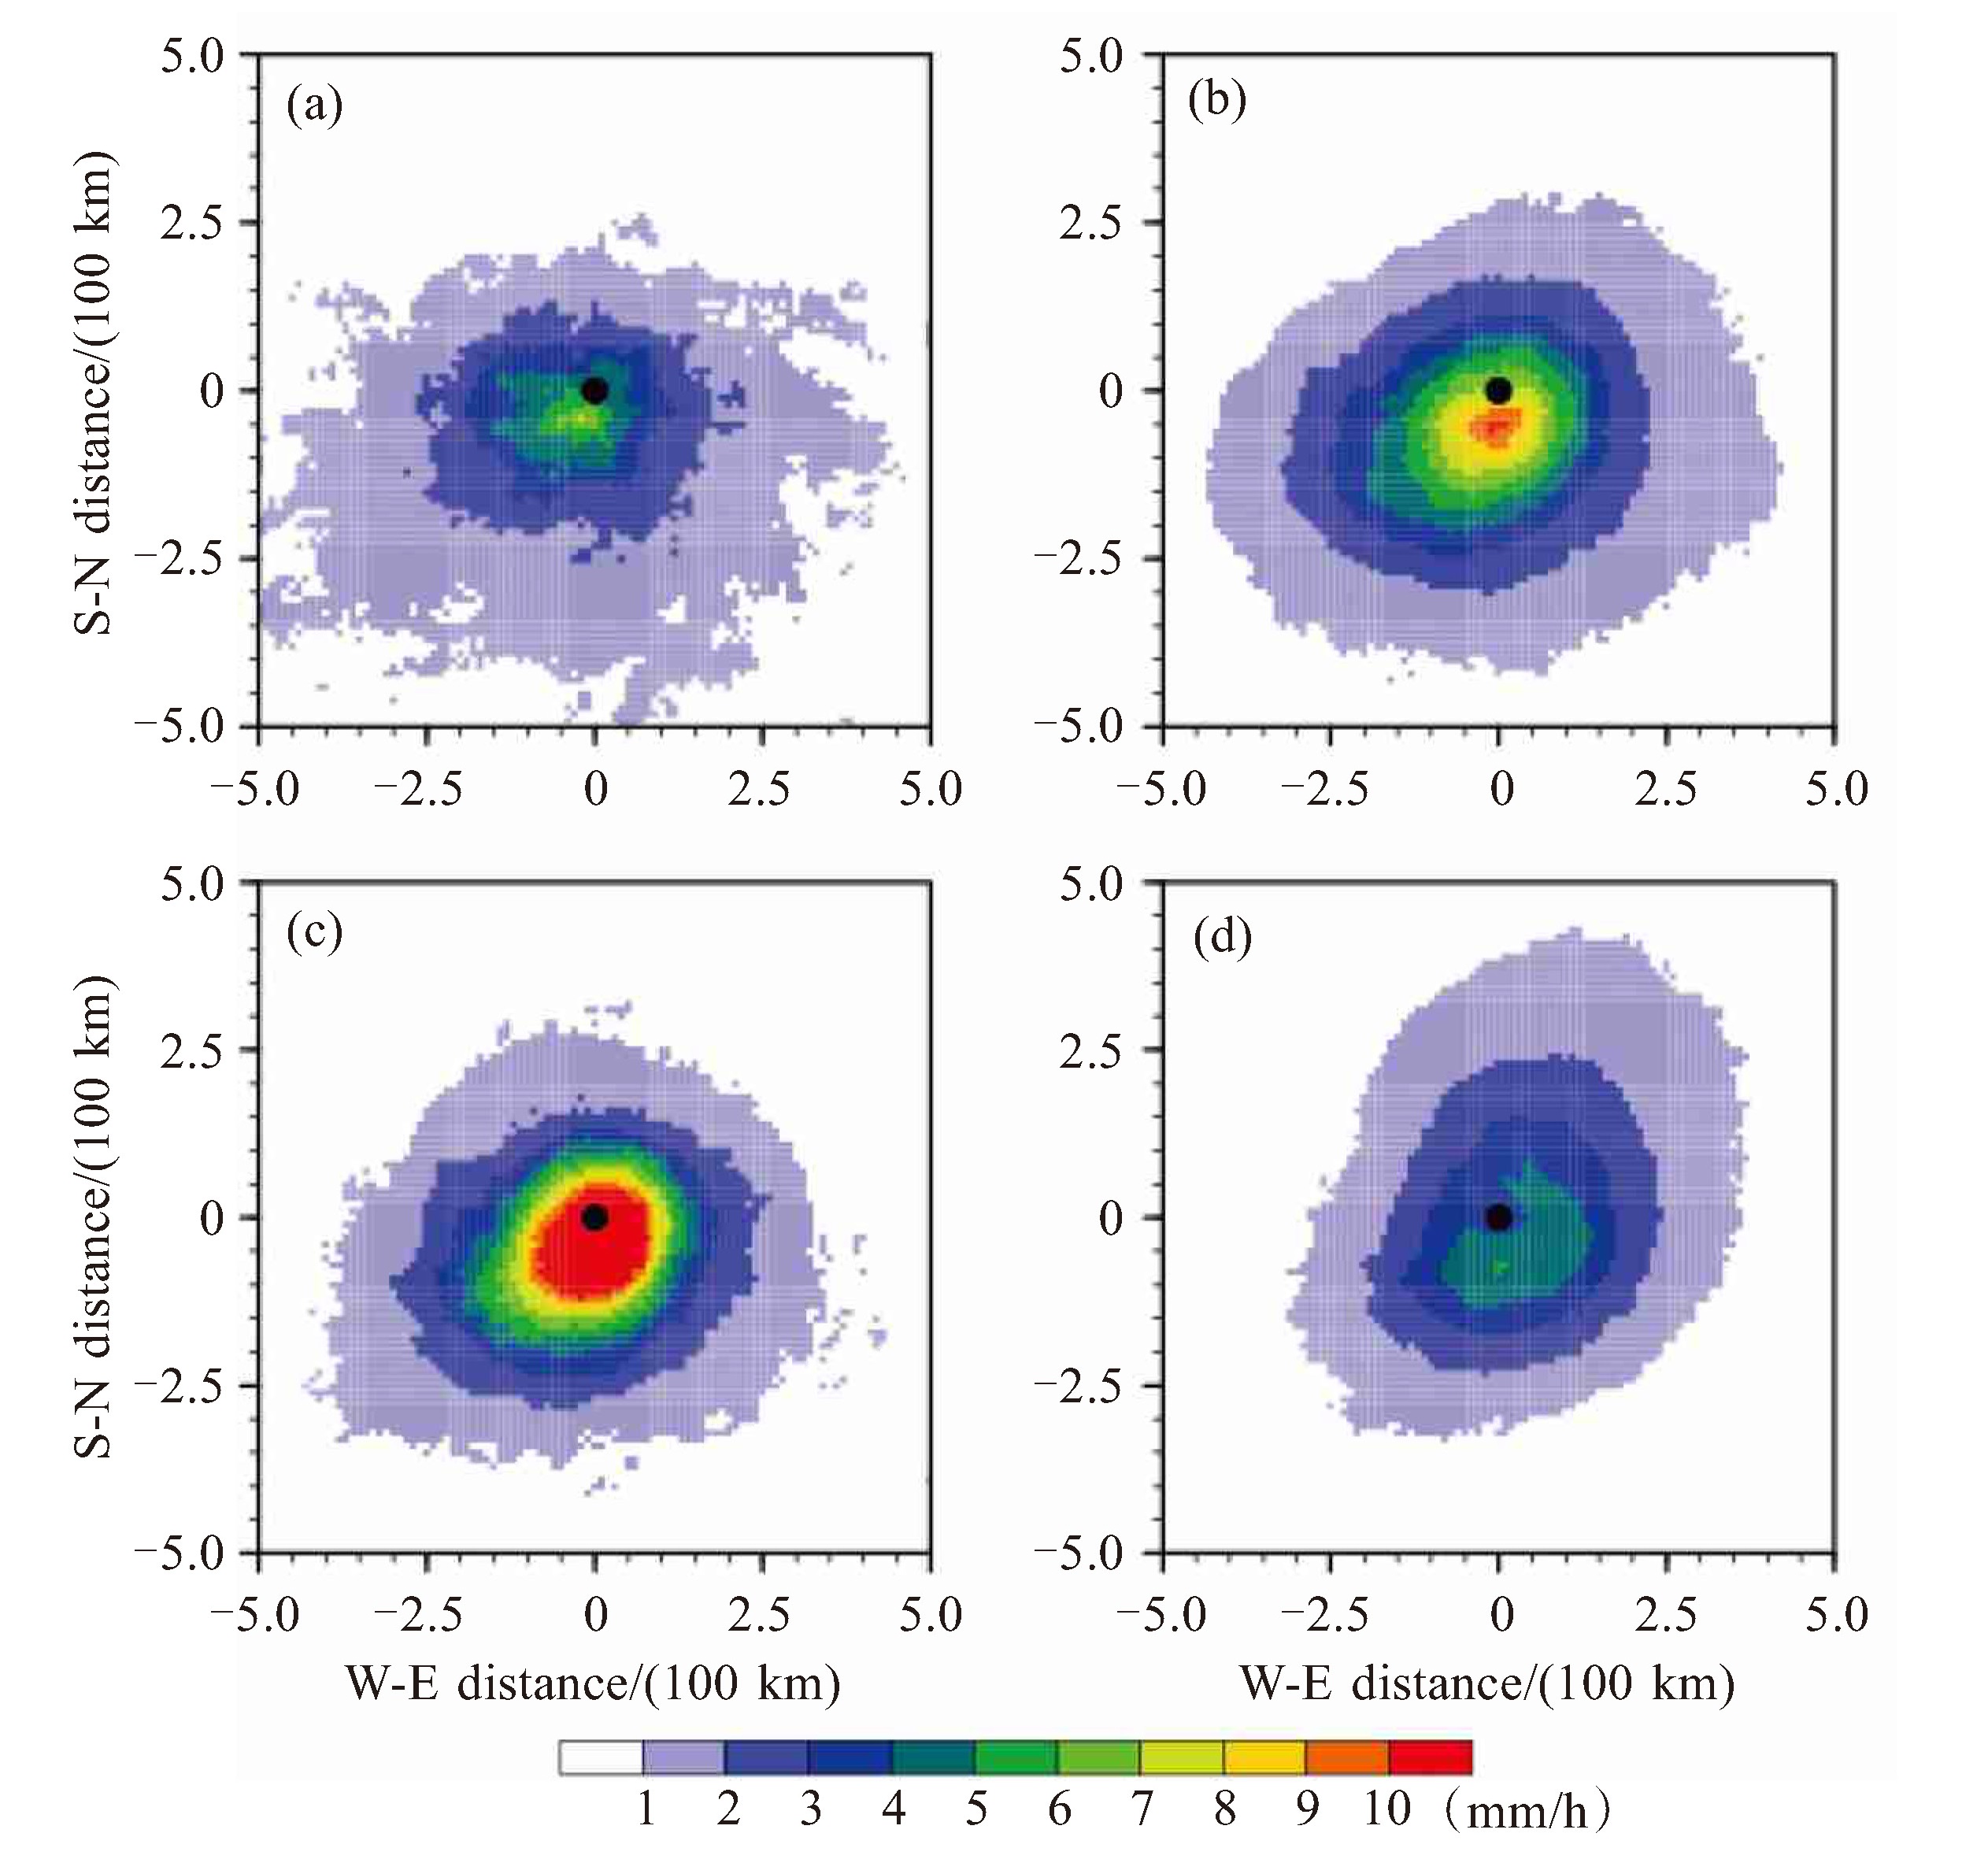
图 3 移动气旋坐标系下初生型(a)、缓慢增强型(b)、快速增强型(c)、减弱型(d)热带气旋降水的空间分布特征
图中黑点指示着气旋中心,x轴和y轴的采样间隔均为10 km。

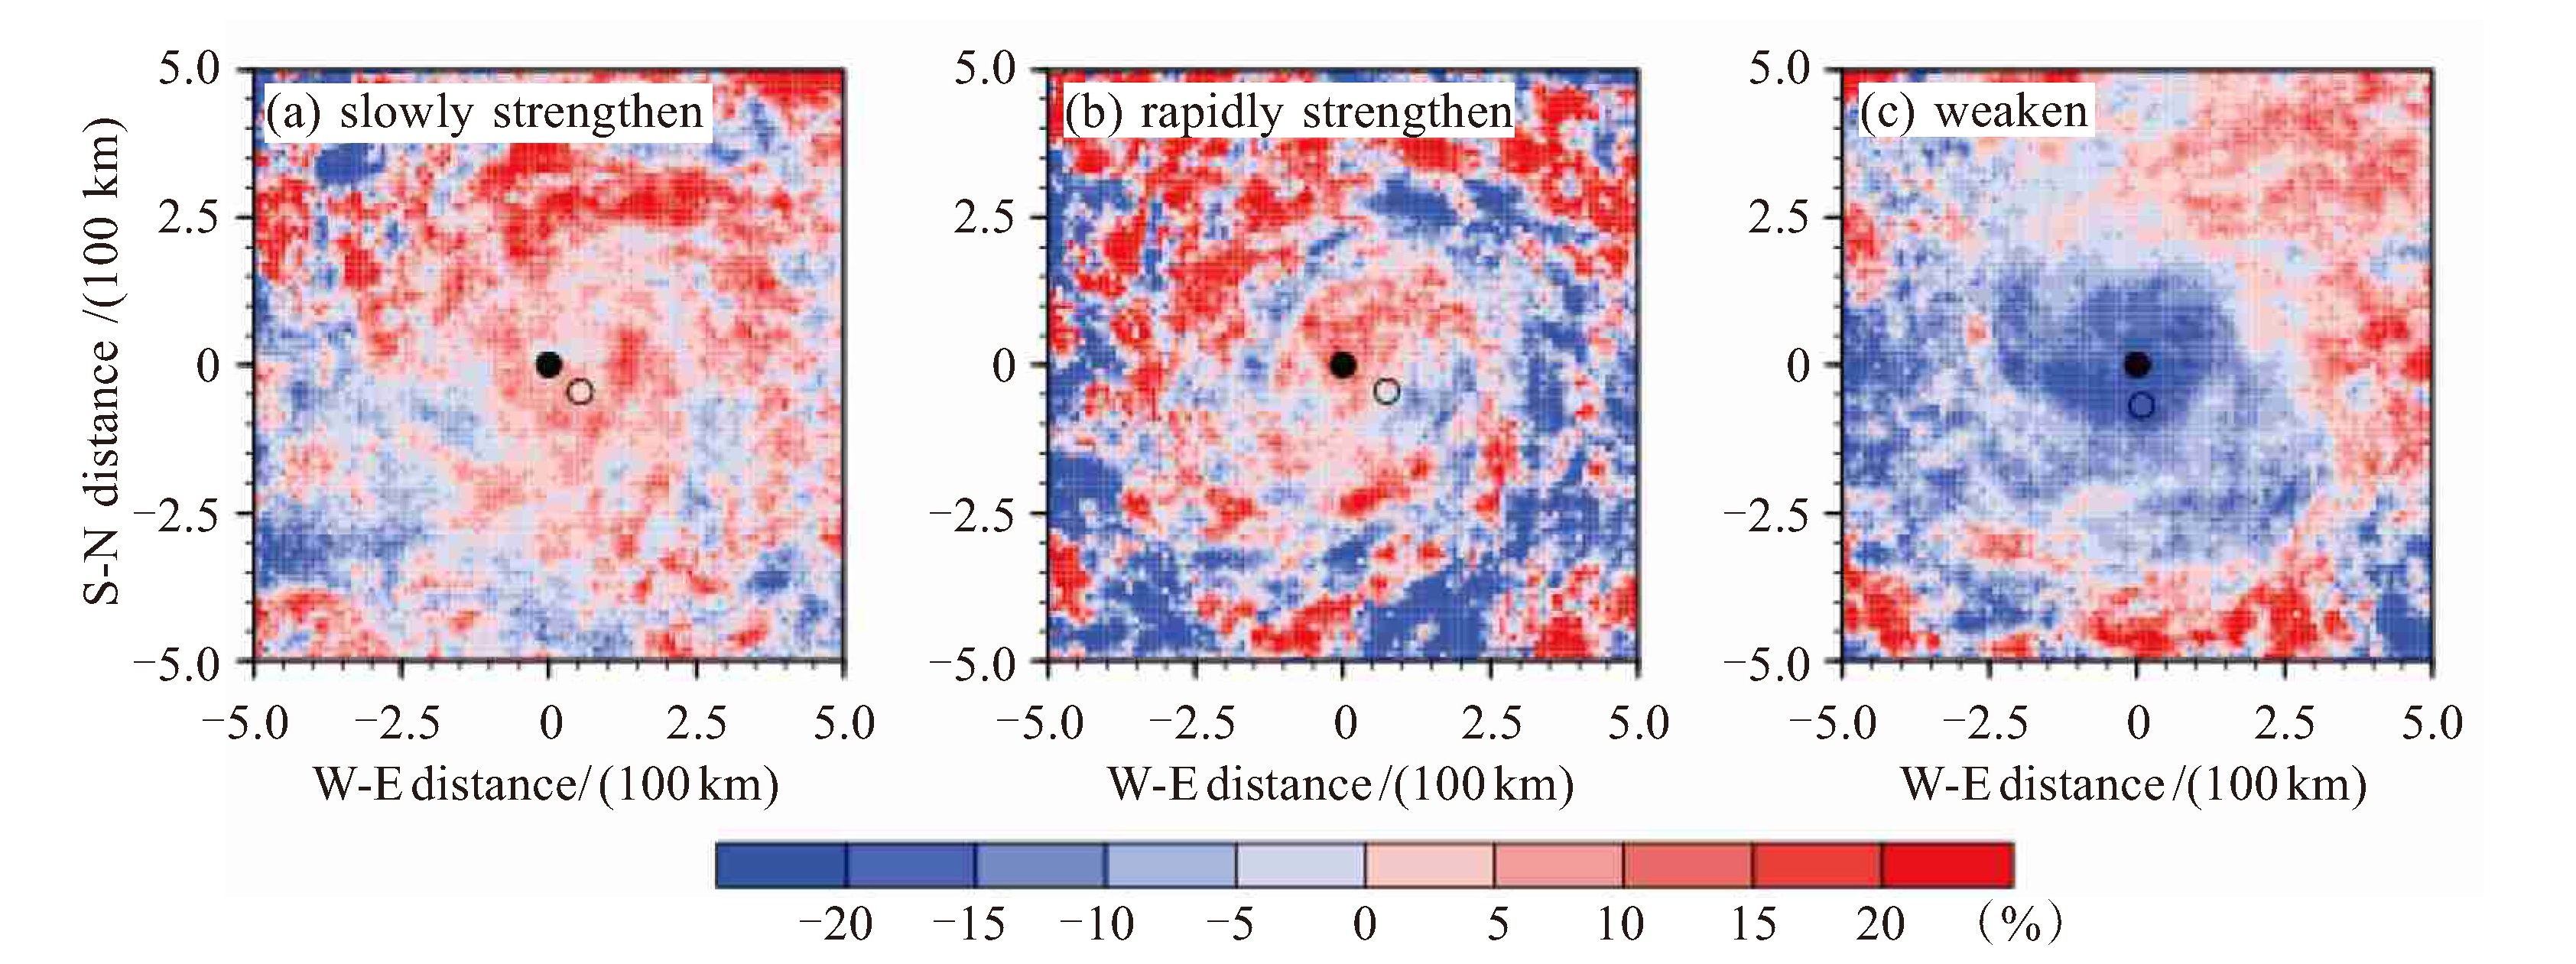
图 4 移动气旋坐标系下缓慢增强型(a)、快速增强型(b)、减弱型(c)气旋降水相对上一个时次的变化率
图中黑点指示着此刻的气旋中心,圆圈指示着上一个时刻的台风中心,x轴和y轴的采样间隔均为10 km。

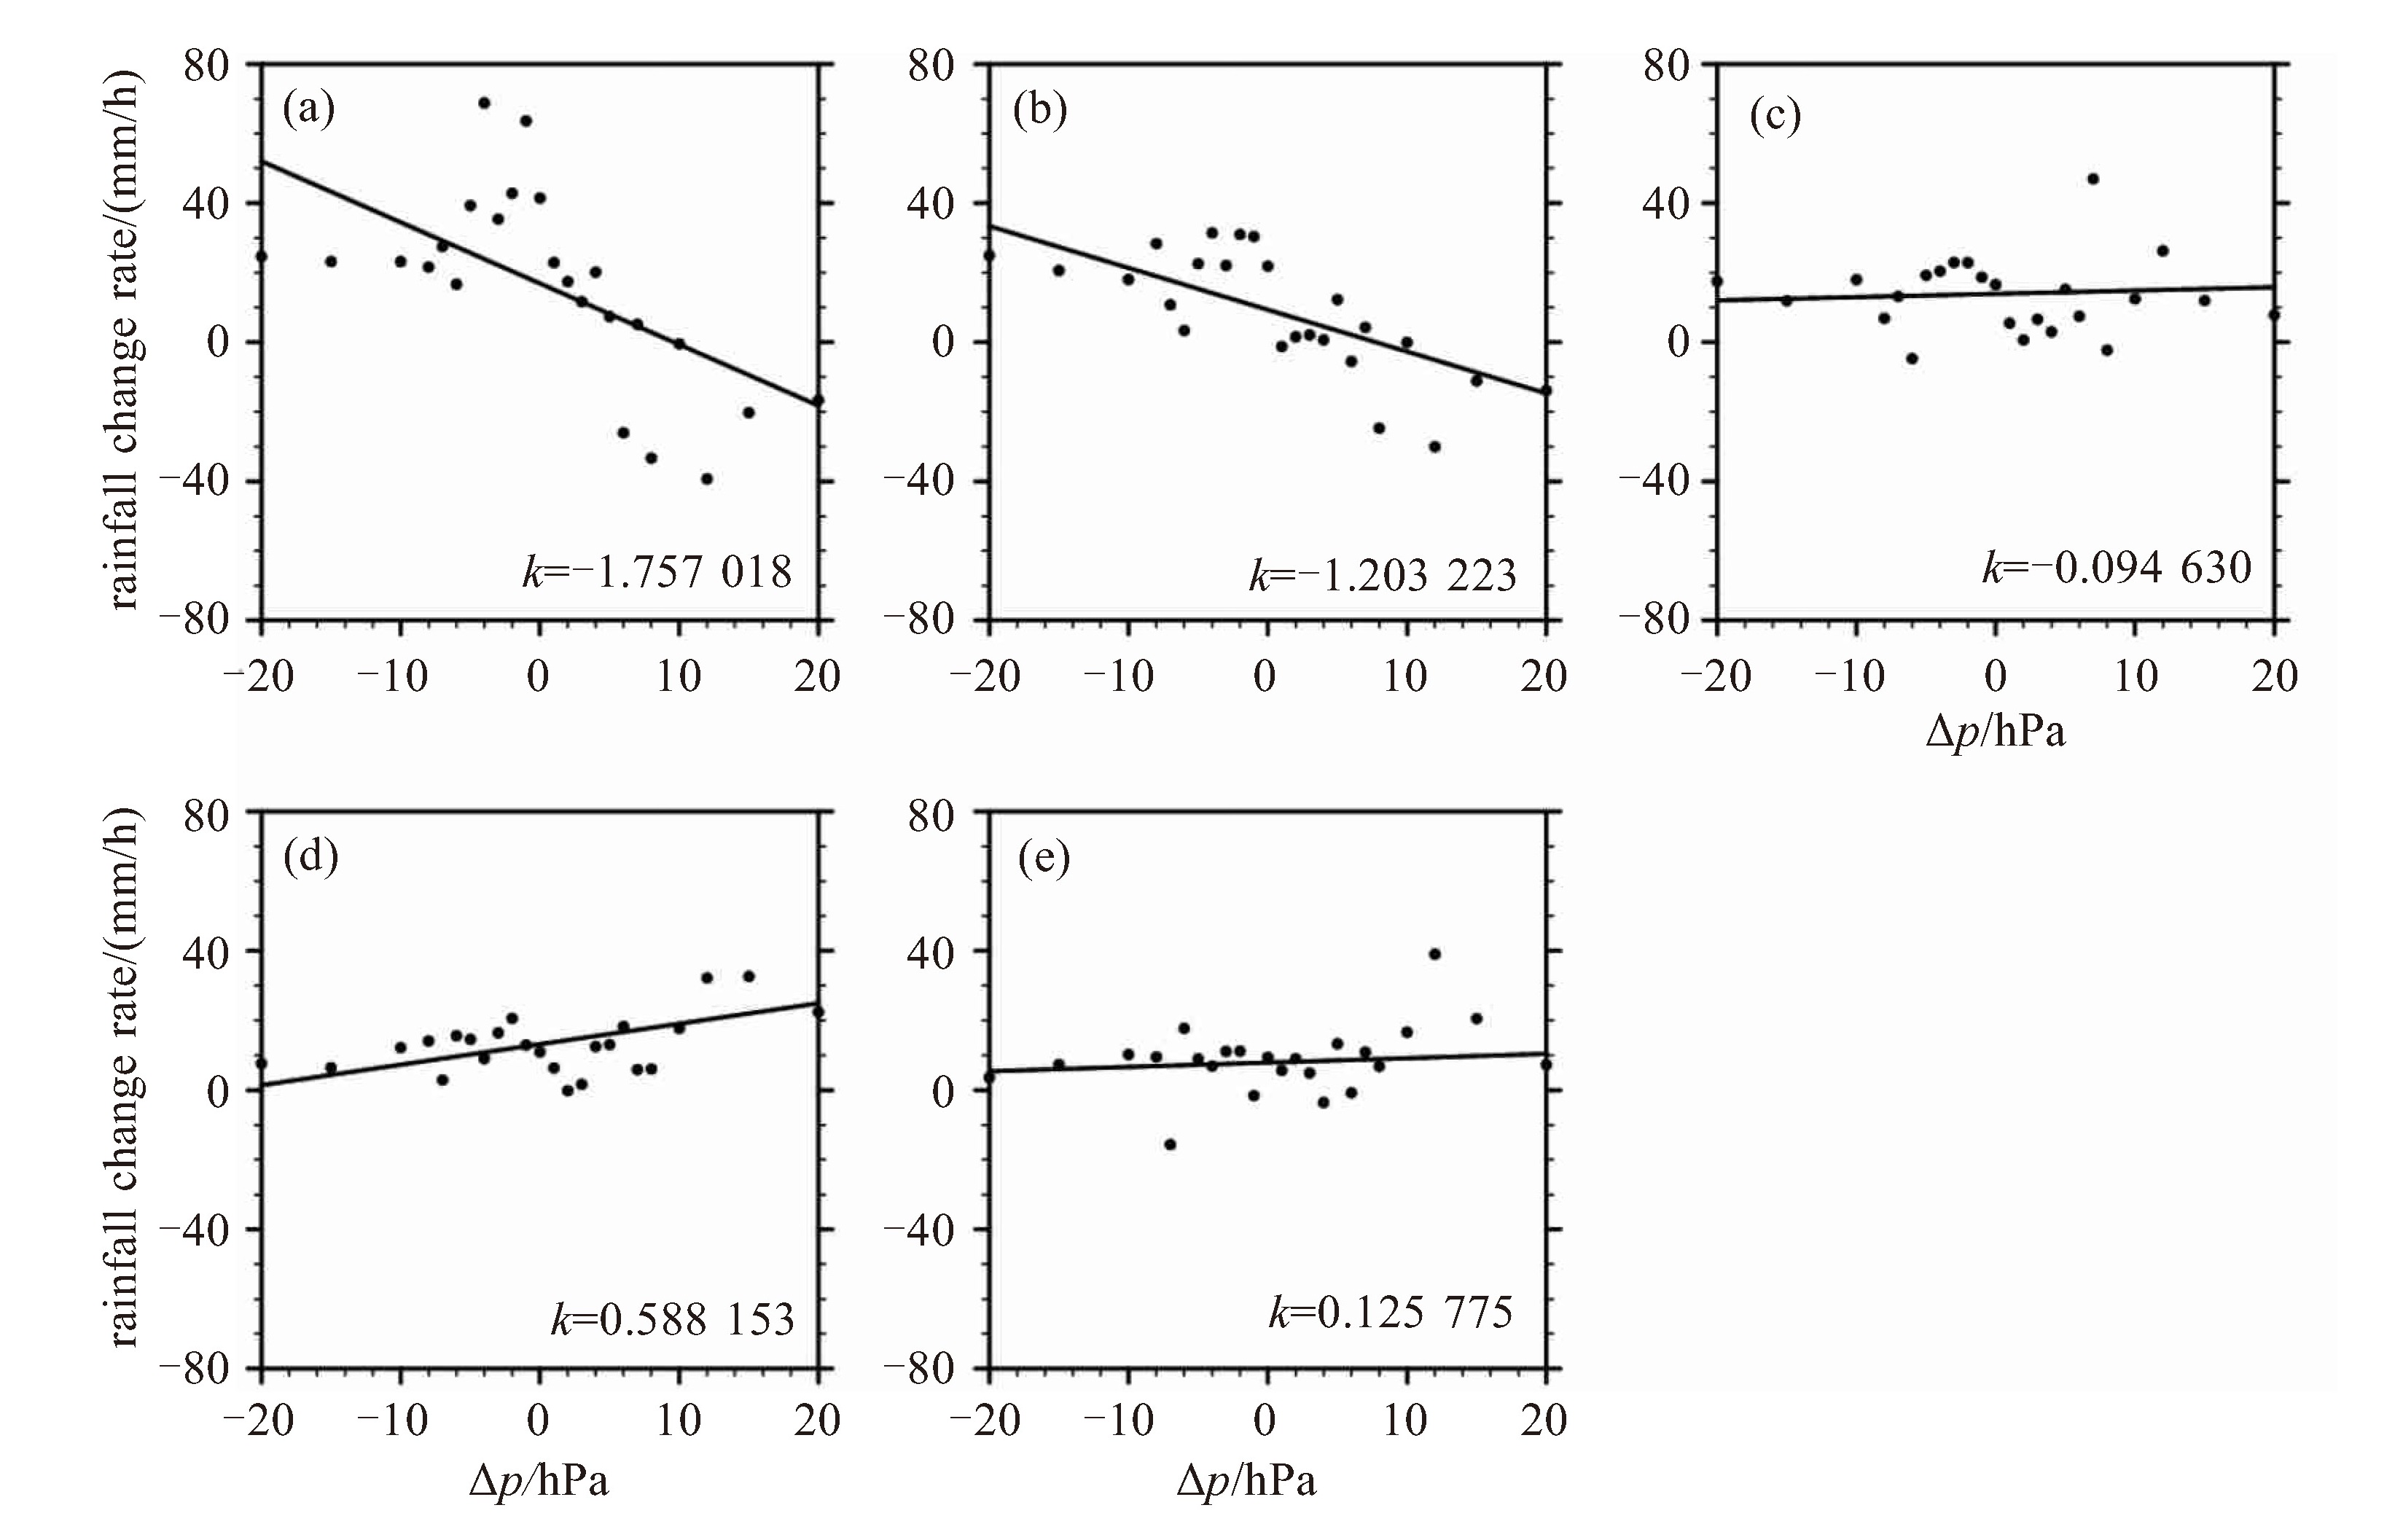
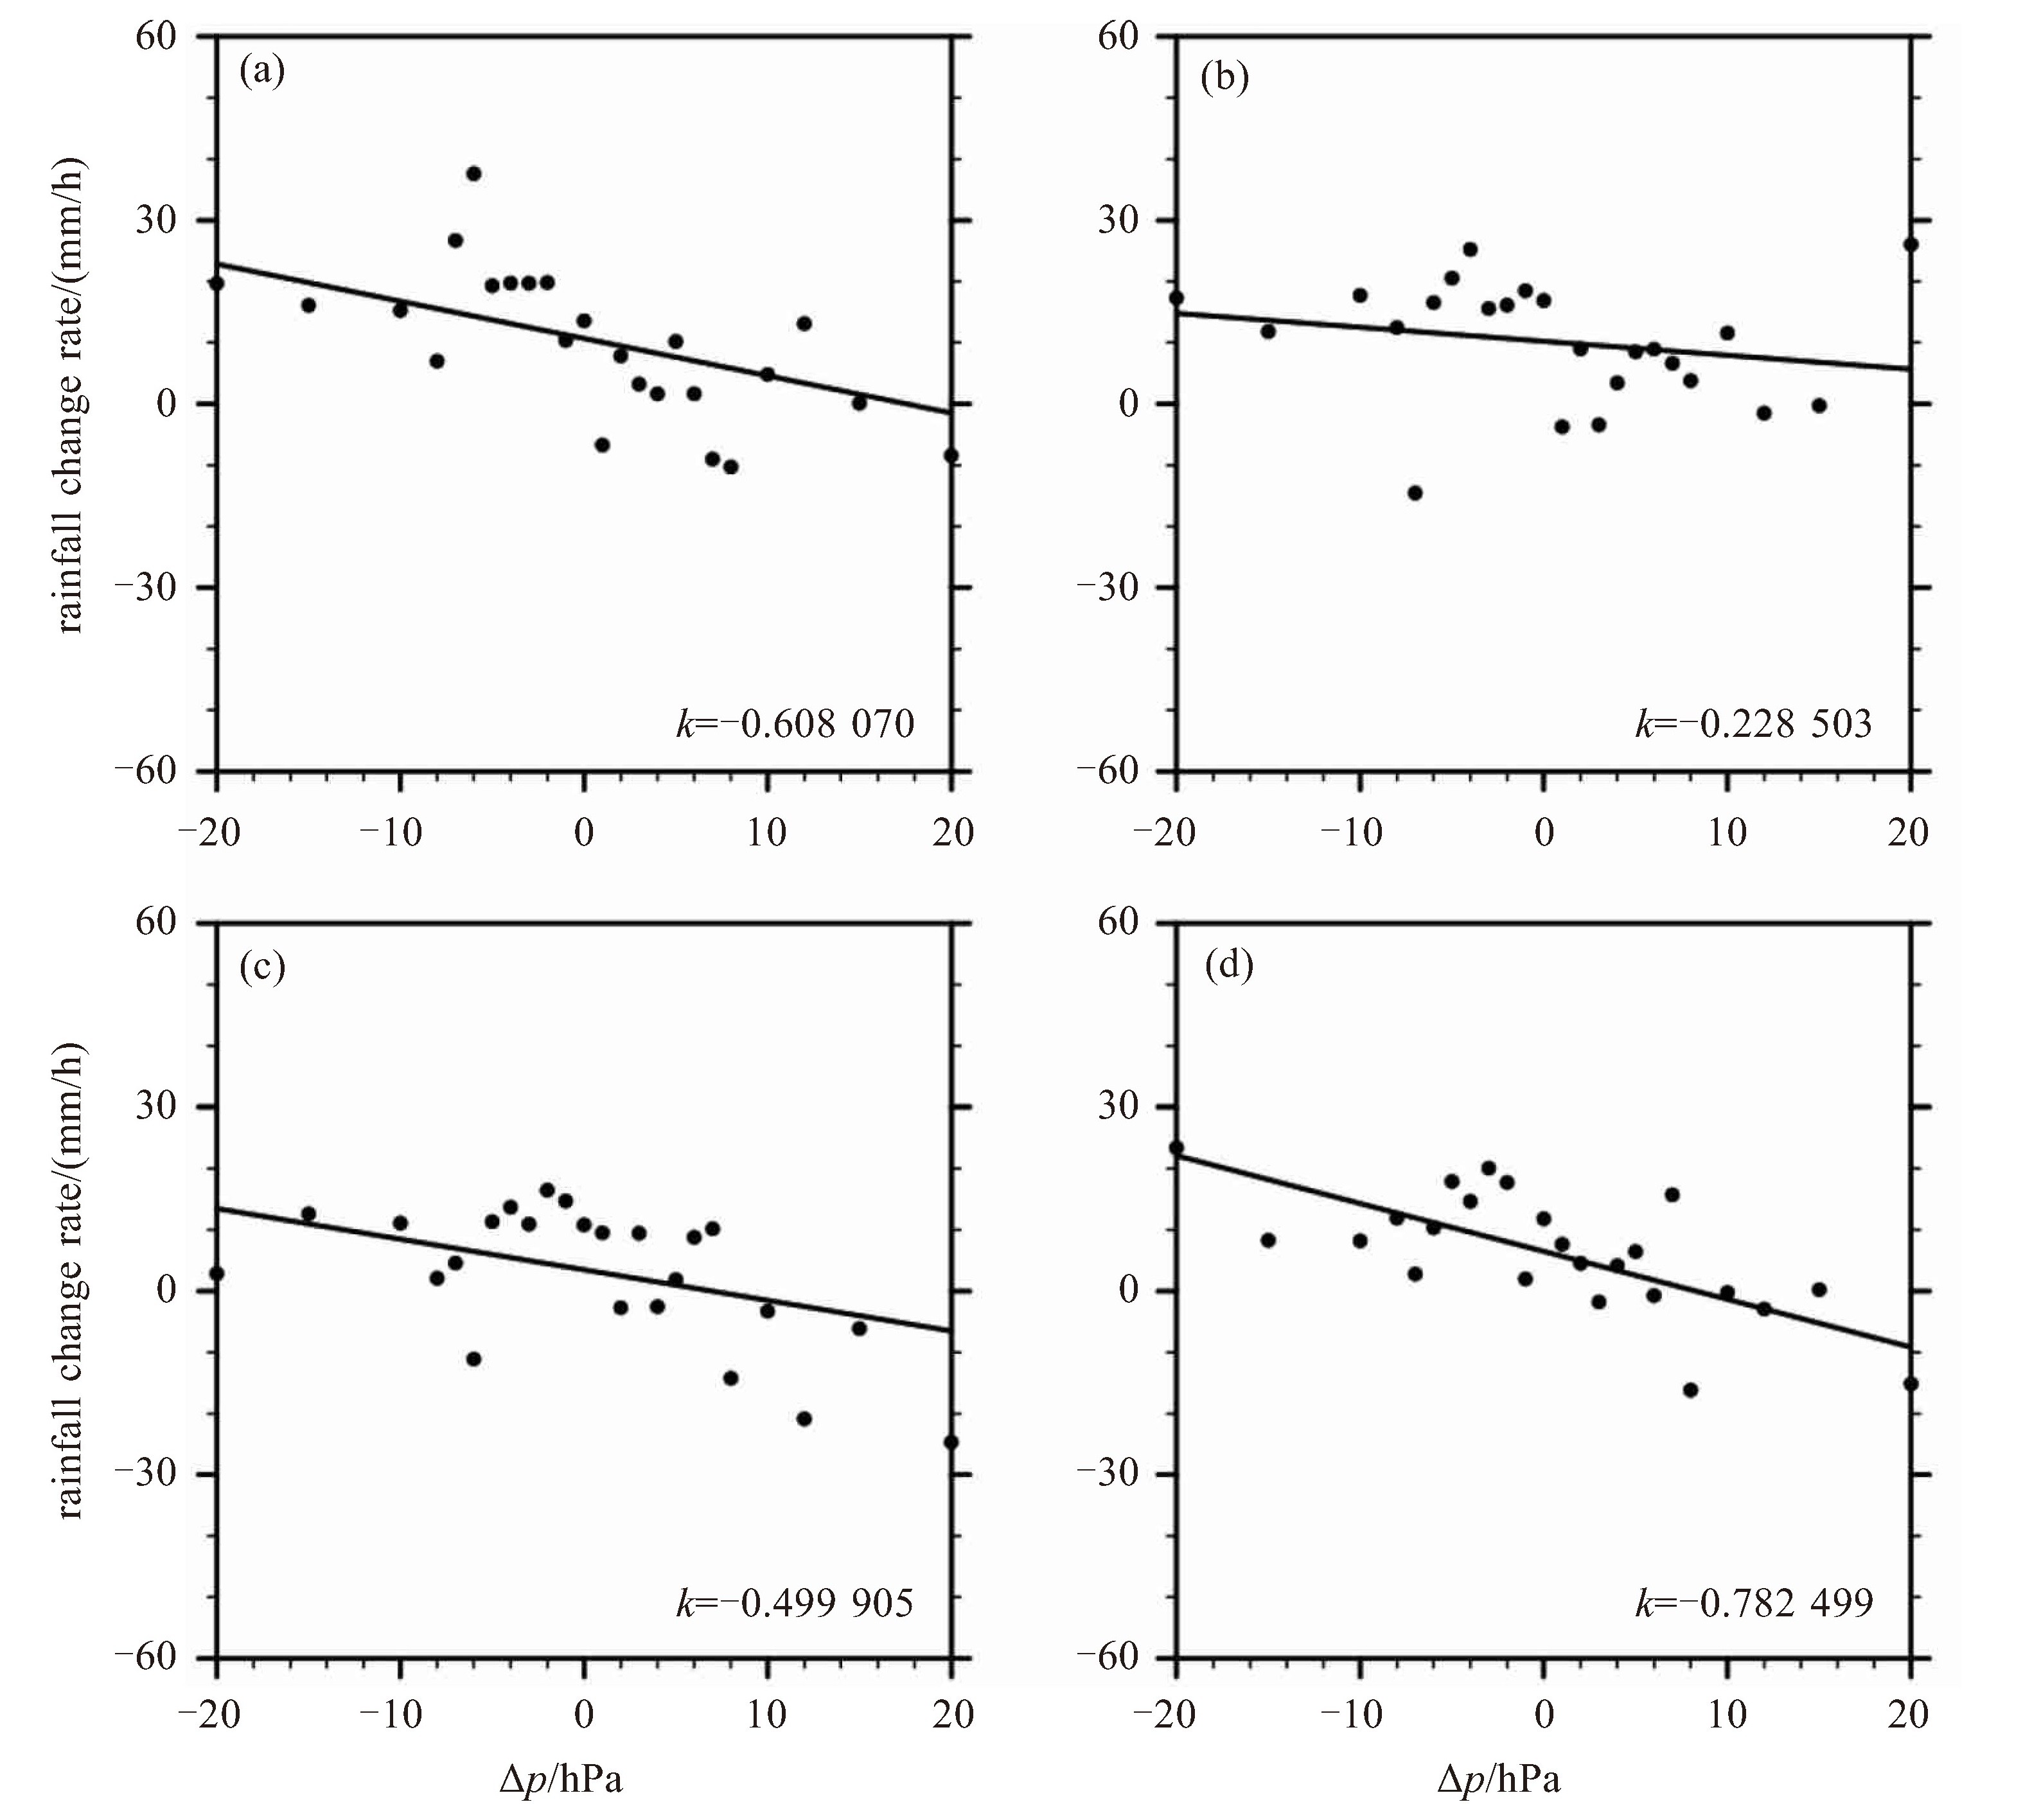
图 7 热带气旋径向距离100 km以内(a)、100~200 km(b)、200~300 km(c)、300~400 km(d)和400~500 km(e)降水变化率与气压变化(Δp)的散点分布
降水变化率指移动气旋坐标系下降水相对于上一个时次的变化,Δp指此时次中心气压与上一个时次之差。黑线代表拟合的直线,k为拟合直线的曲率。
-
[1] 吴立广. 台风一词的历史沿革[J]. 气象学报, 2020, 78(6): 1 065-1 075. [2] 吴国雄. 海温异常对台风形成的影响[J]. 大气科学, 1992, 16(3): 322-332. [3] MEI W, XIE S, PRIMEAU F, et al. Northwestern Pacific typhoon intensity controlled by changes in ocean temperatures[J]. Sci Adv, 2015, 1 (4): e1500014. [4] LUO S, FU Y, ZHOU S, et al. Analysis of the relationship between the cloud water path and precipitation intensity of mature typhoons in the Northwest Pacific Ocean[J]. Adv Atmos Sci, 2020, 37(4): 359-376. [5] 陈联寿, 孟智勇. 我国热带气旋研究十年进展[J]. 大气科学, 2001, 25(3): 420-432. [6] 王慧, 丁一汇, 何金海. 西北太平洋夏季风的变化对台风生成的影响[J]. 气象学报, 2006, 64(3): 345-356. [7] LONFAT M, ROGERS R, MARCHOK T, et al. A parametric model for predicting hurricane rainfall[J]. Mon Wea Rev, 2007, 135(9): 3 086-3 097. [8] HOUZE R. Clouds in tropical cyclones[J]. Mon Wea Rev, 2010, 138(2): 293-344. [9] HENCE D, HOUZE R. Vertical structure of tropical cyclones with concentric eyewalls as seen by the TRMM precipitation radar[J]. J Atmos Sci, 2012, 69(3): 1 021-1 036. [10] YANG Z, YUAN T, JIANG H, et al. Stratiform and convective precipitation properties of tropical cyclones in the Northwest Pacific[J]. J Geophys Res, 2018, 123(7): 3 513-3 529. [11] WANG Y, WANG Y, FUDEYASU H. The role of typhoon Songda (2004) in producing distantly located heavy rainfall in Japan[J]. Mon Weat Rev, 2009, 137(11): 3 699-3 716. [12] THAKUR M, LAKSHMI K, DWIVEDI S, et al. On the rainfall asymmetry and distribution in tropical cyclones over Bay of Bengal using TMPA and GPM rainfall products[J]. Nat Hazards, 2018, 94(2): 819-832. [13] WEN G, HUANG G, HUANG H, et al. Observed rainfall asymmetry of tropical cyclone in the process of making landfall in Guangdong, south China[J]. Int J Climatol, 2019, 39(7): 3 379-3 395. [14] BARNES C, BARNES G. Eye and eyewall traits as determined with the NOAA WP-3D lower-fuselage radar[J]. Mon Wea Rev, 2014, 142 (9): 3 393-3 417. [15] LI Q, DAI Y. Revisiting azimuthally asymmetric moist instability in the outer core of sheared tropical cyclones[J]. Mon Wea Rev, 2020, 148 (3): 1 297-1 319. [16] 周玲丽, 翟国庆, 王东海, 等. 0713号"韦帕"台风暴雨的中尺度数值研究和非对称性结构分析[J]. 大气科学, 2011, 35(6): 1 046-1 056. [17] KLOTZ B, NOLAN D. SFMR surface wind undersampling over the tropical cyclone life cycle[J]. Mon Weat Rev, 2019, 147(1): 247-268. [18] CHEN X, WANG Y, ZHAO K. Synoptic flow patterns and large-scale characteristics associated with rapidly intensifying tropical cyclones in the South China Sea[J]. Mon Weat Rev, 2015, 143(1): 64-87. [19] DEMARIA M, SAMPSON C, KNAFF J, et al. Is tropical cyclone intensity guidance improving?[J]. Bull Amer Meteor Soc, 2014, 95(3): 387-398. [20] WANG Y, WU C. Current understanding of tropical cyclone structure and intensity changes? a review[J]. Meteorol Atmos Phys, 2004, 87 (4): 257-278. [21] WU Y, CHEN S, LI W, et al. Relative vorticity is the major environmental factor controlling tropical cyclone intensification over the Western North Pacific[J]. Atmos Res, 2020, 237: 104874. [22] KELLEY O. Tall precipitation cells in tropical cyclone eyewalls are associated with tropical cyclone intensification[J]. Geophys Res Lett, 2004, 31(24): L24112. [23] TOUMA D, STEVENSON S, CAMARGO S, et al. Variations in the intensity and spatial extent of tropical cyclone precipitation[J]. Geophys Res Lett, 2019, 46(23): 13 992-14 002. [24] ZHOU X, WANG B, GE X, et al. Impact of secondary eyewall heating on tropical cyclone intensity change[J]. J Atmos Sci, 2011, 68(3): 450-456. [25] 沈新勇, 毕明玉, 张玲, 等. 中尺度对流系统对台风"风神"移动路径影响的研究[J]. 气象学报, 2012, 70(6): 1 173-1 187. [26] YING M, ZHANG W, YU H, et al. An overview of the China Meteorological Administration tropical cyclone database[J]. J Atmos Ocean Tech, 2014, 31(2): 287-301. [27] CHEN F, HUANG H. Comparisons of Gauge, TMPA and IMERG products for monsoon and tropical cyclone precipitation in southern China[J]. Pure Appl Geophys, 2019, 176(4): 1 767-1 784. [28] HUANG C, HU J, CHEN S, et al. How well can IMERG products capture typhoon extreme precipitation events over southern China?[J]. Remote Sens, 2019, 11(1): 70. [29] CORBOSIERO K, MOLINARI J. The relationship between storm motion, vertical wind shear, and convective asymmetries in tropical cyclones[J]. J Atmos Sci, 2003, 60(2): 366-376. [30] 许春林, 王文波, 杨森槐, 等. 台风"鹦鹉"登陆过程中肇庆降水显著偏弱的原因[J]. 广东气象, 2009, 31(6): 32-35. [31] 卜松, 李英. 华东登陆热带气旋降水不同分布的对比分析[J]. 大气科学, 2020, 44(1): 27-38. -

 下载:
下载:
 点击查看大图
图(8)
计量
- 文章访问数: 257
- HTML全文浏览量: 53
- PDF下载量: 43
- 被引次数: 0
 粤公网安备 4401069904700003号