


A COMPARATIVE ANALYSIS OF METEOROLOGICAL PARAMETERS AT OFFSHORE, NEARSHORE, AND INLAND STATIONS IN MAOMING
-
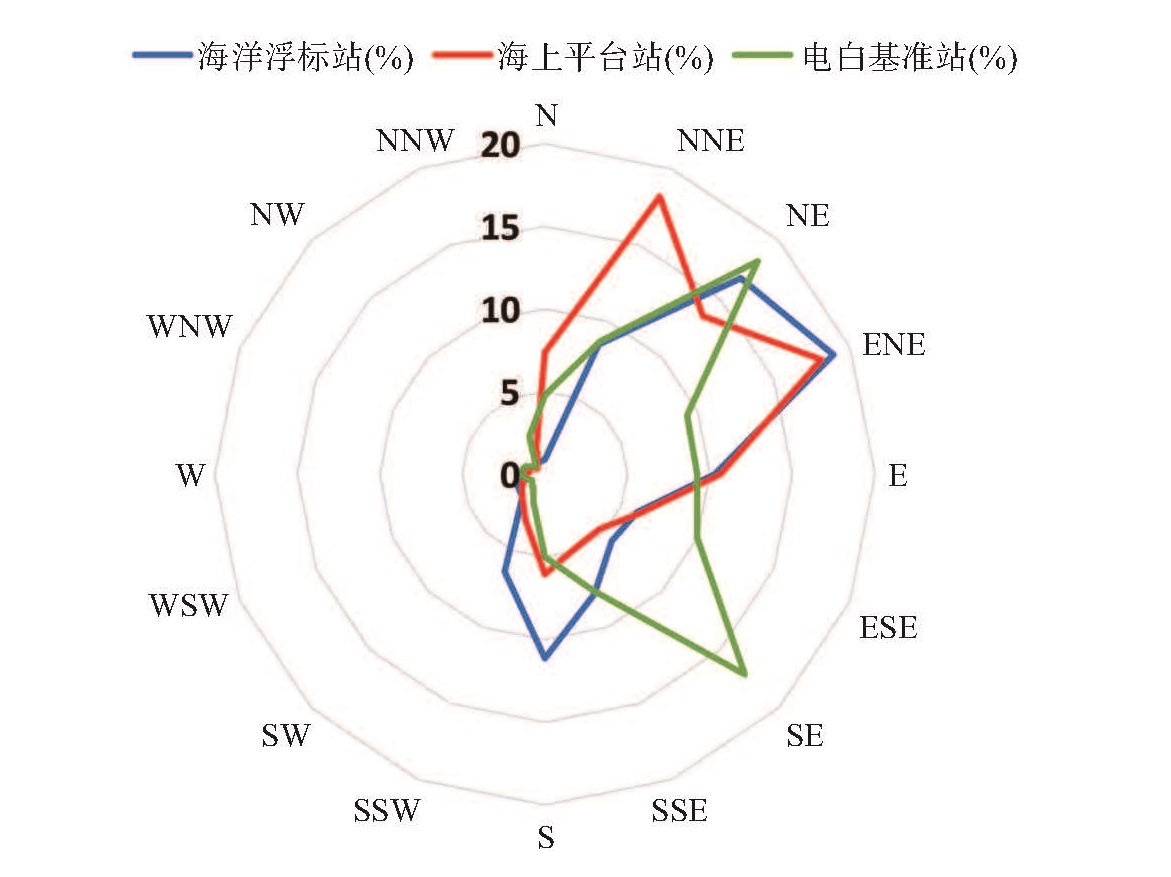
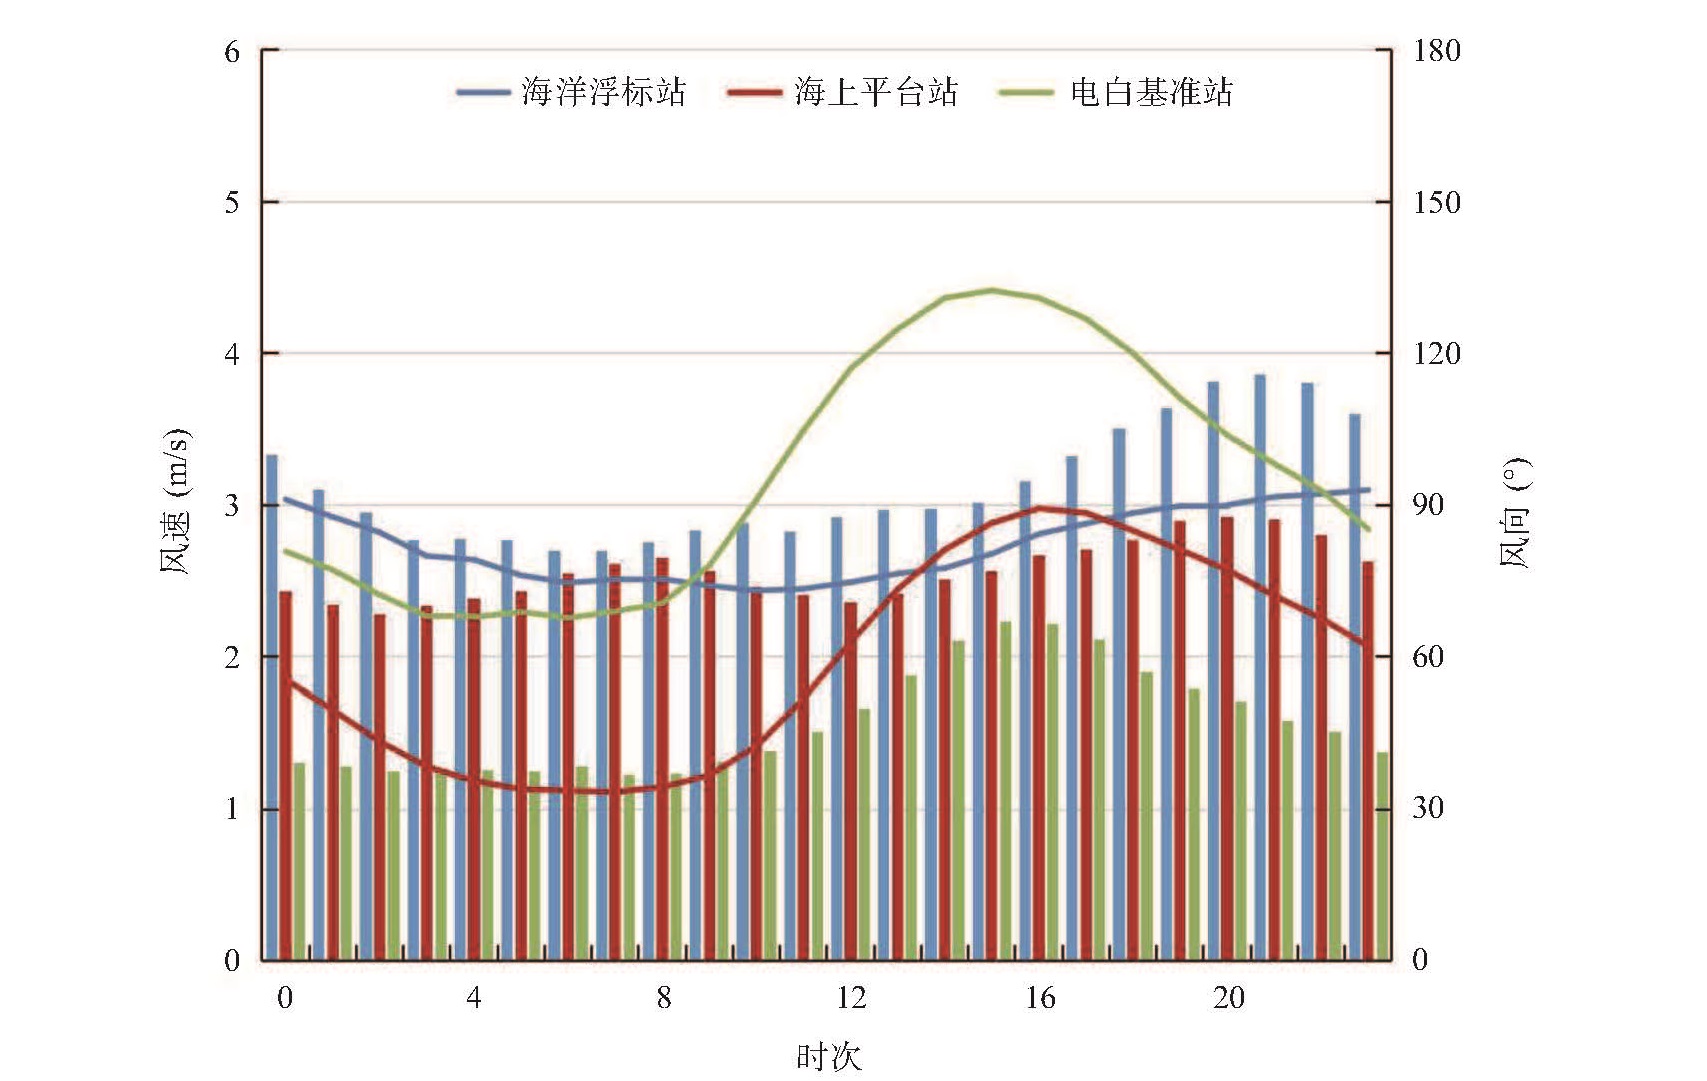
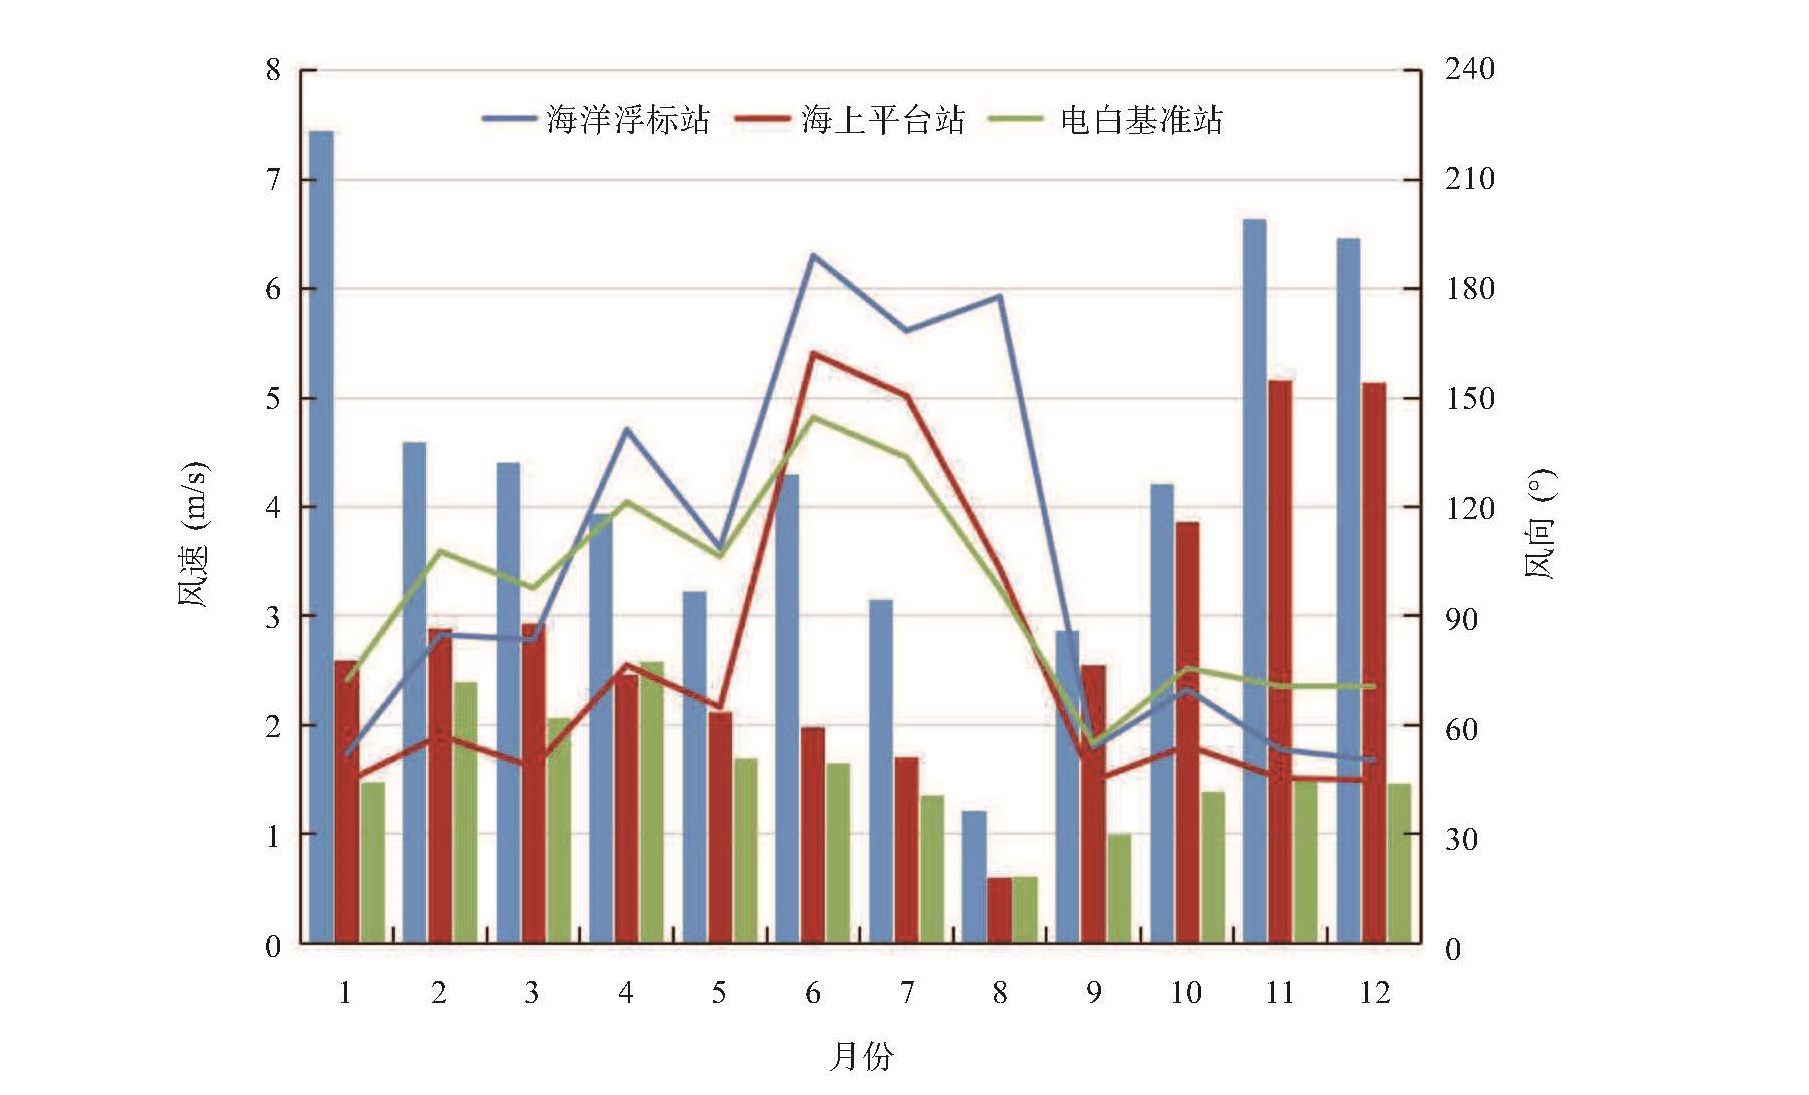
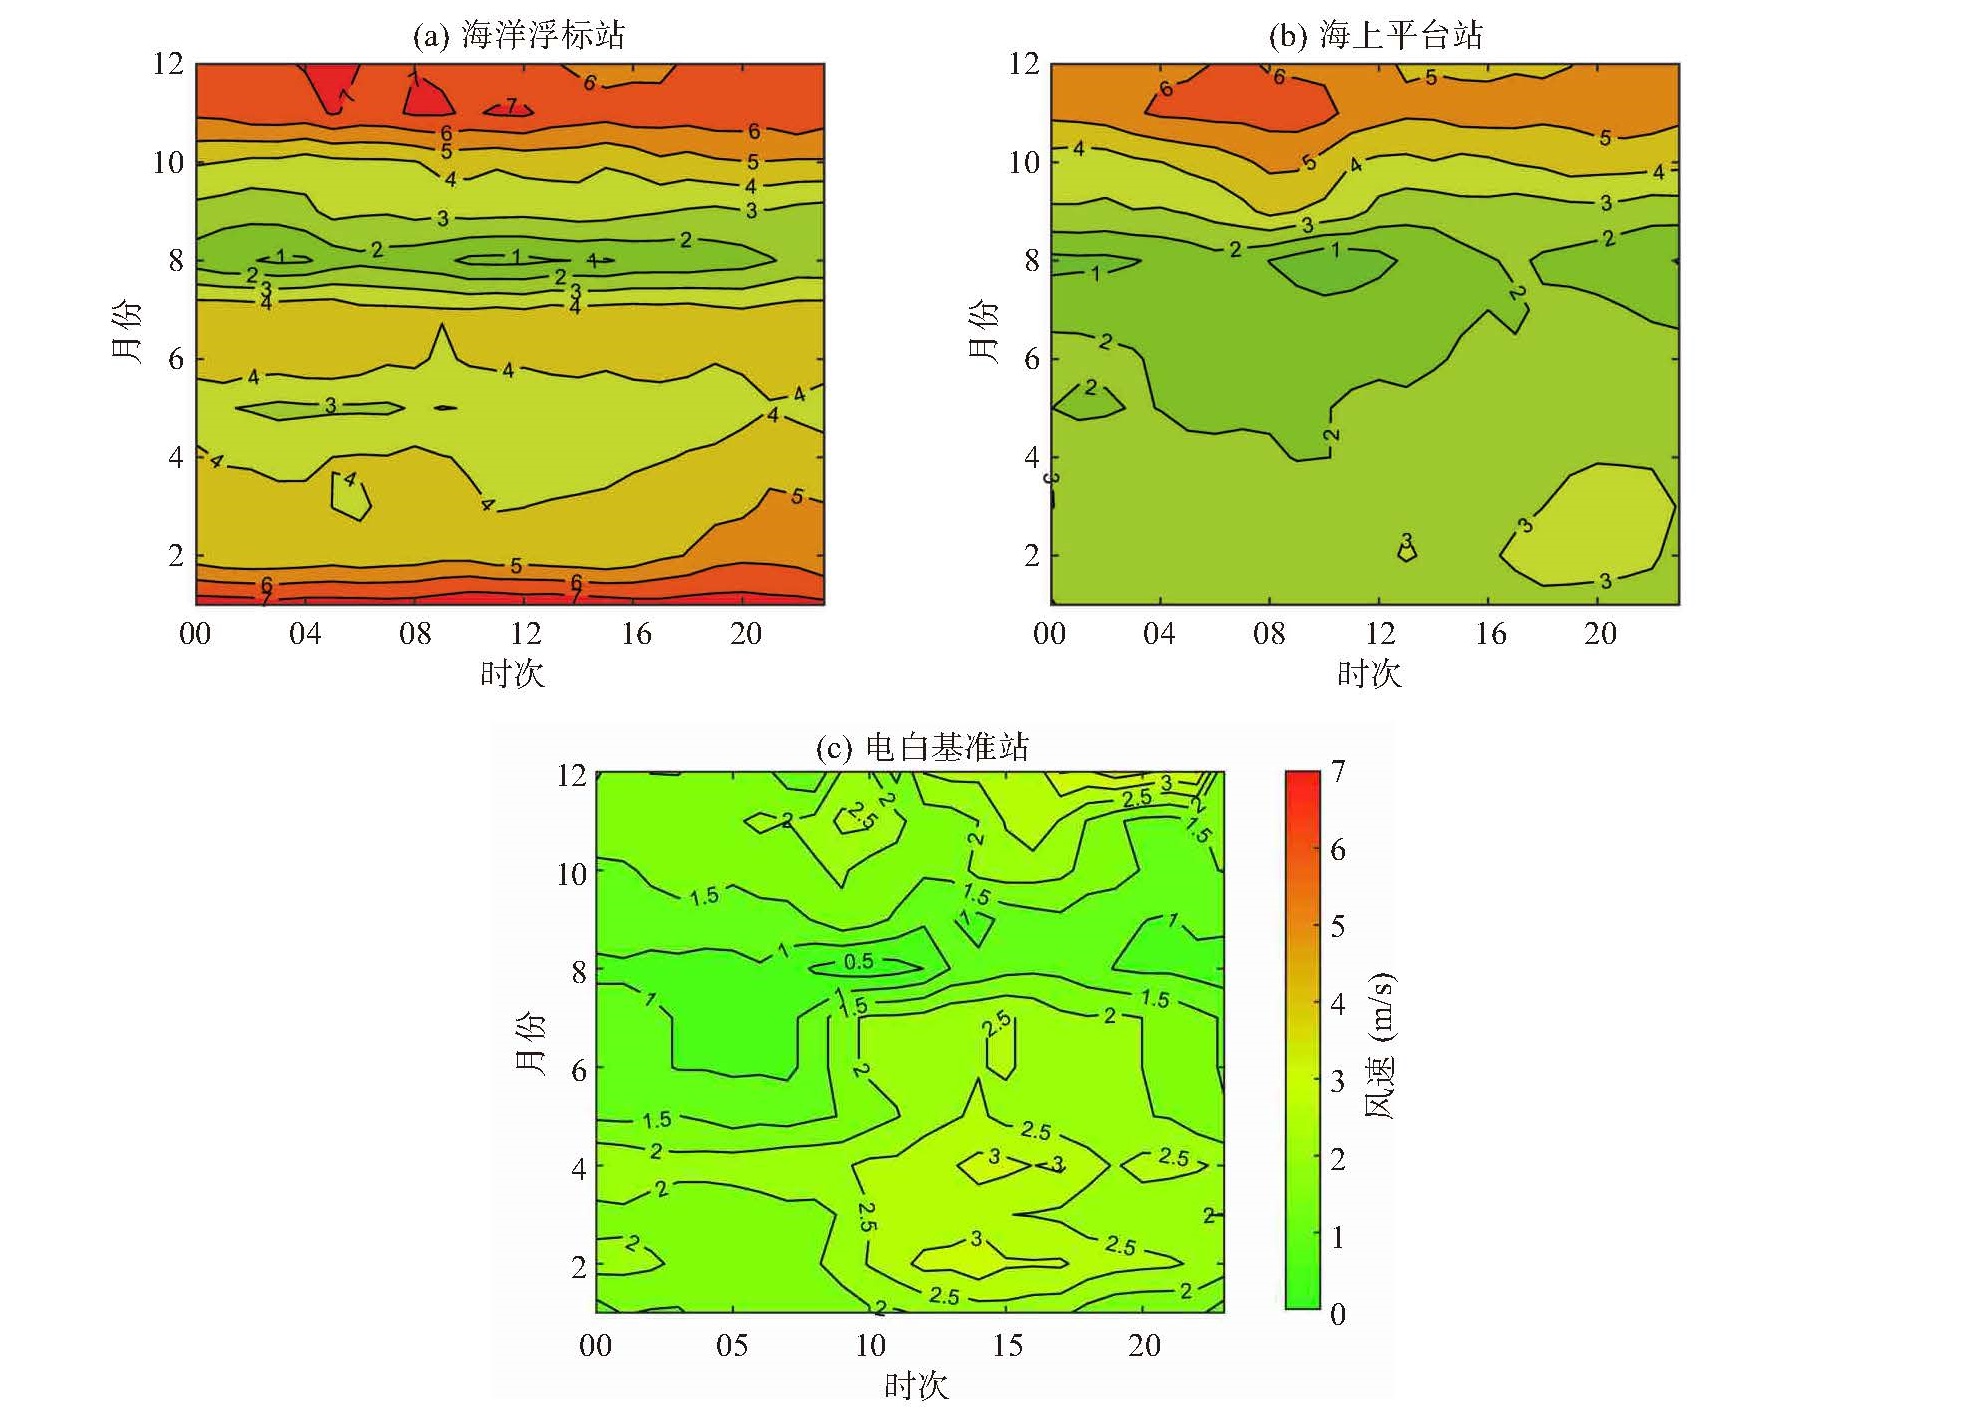
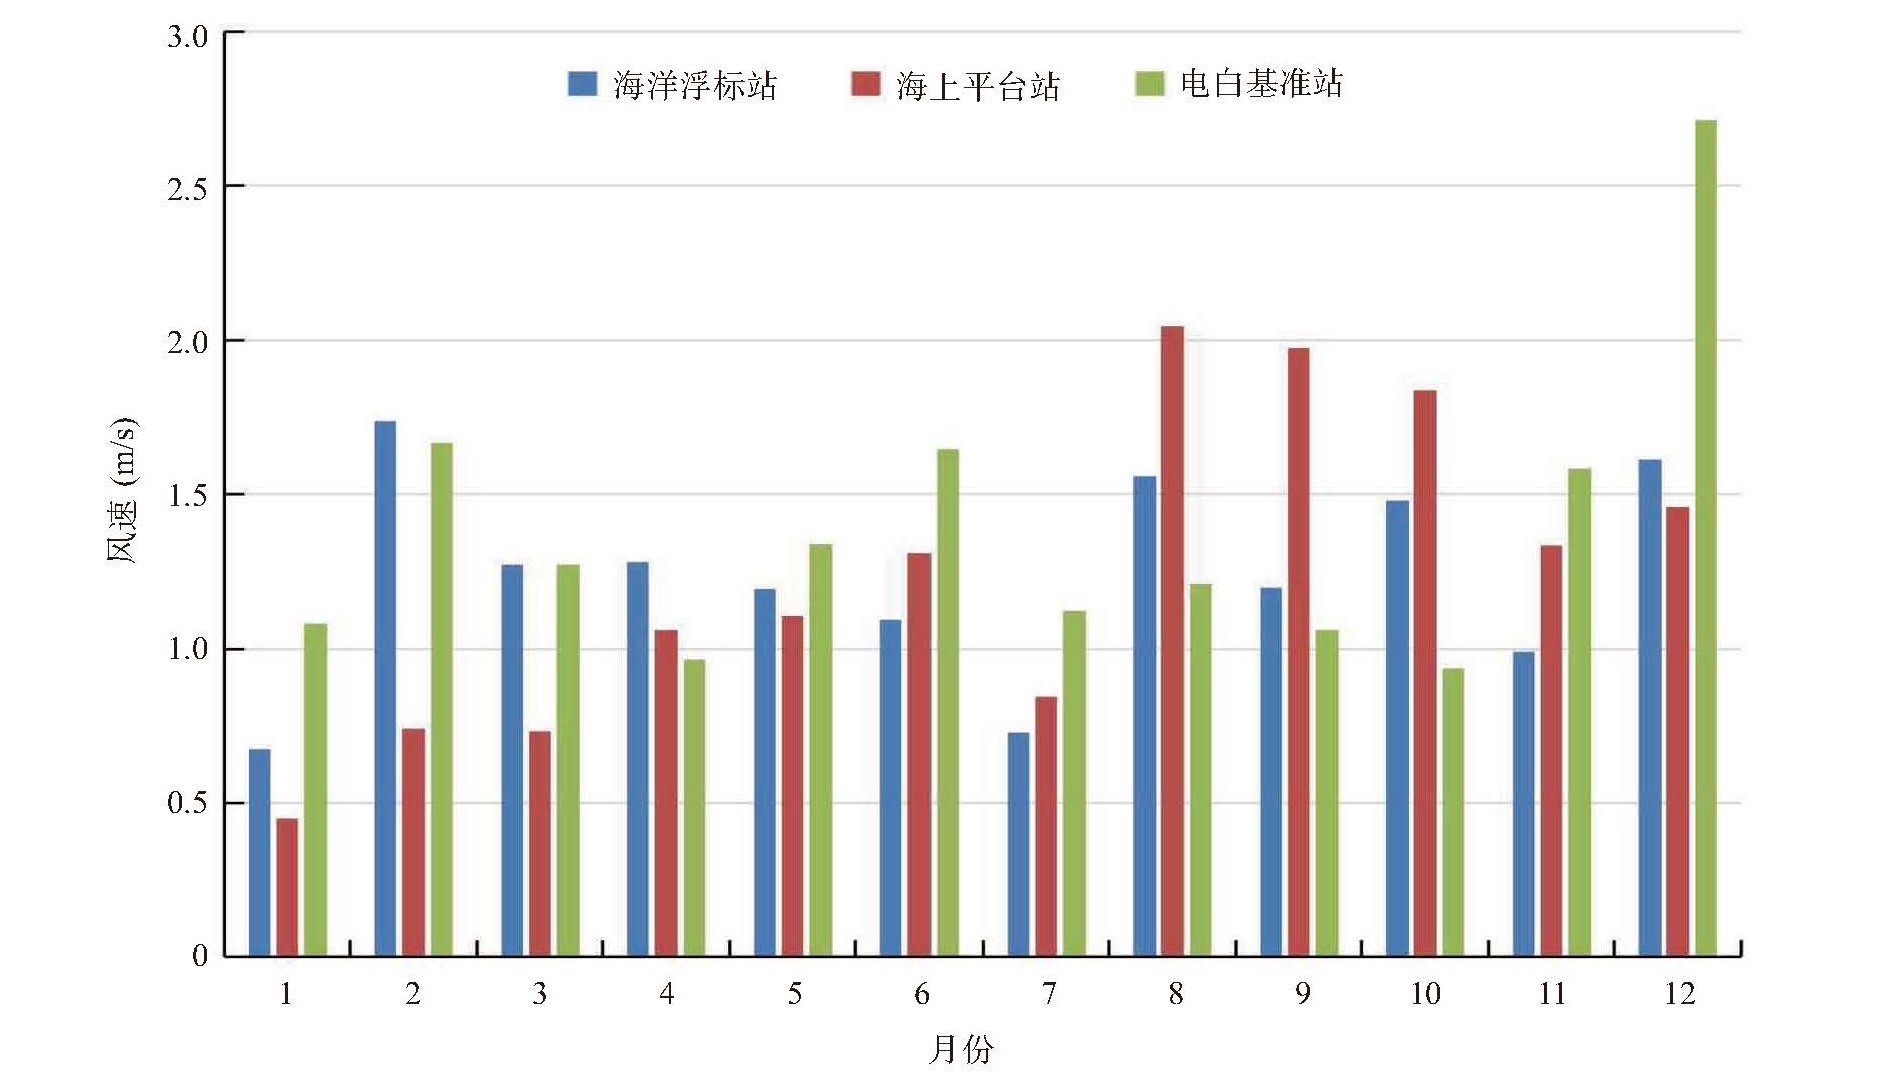
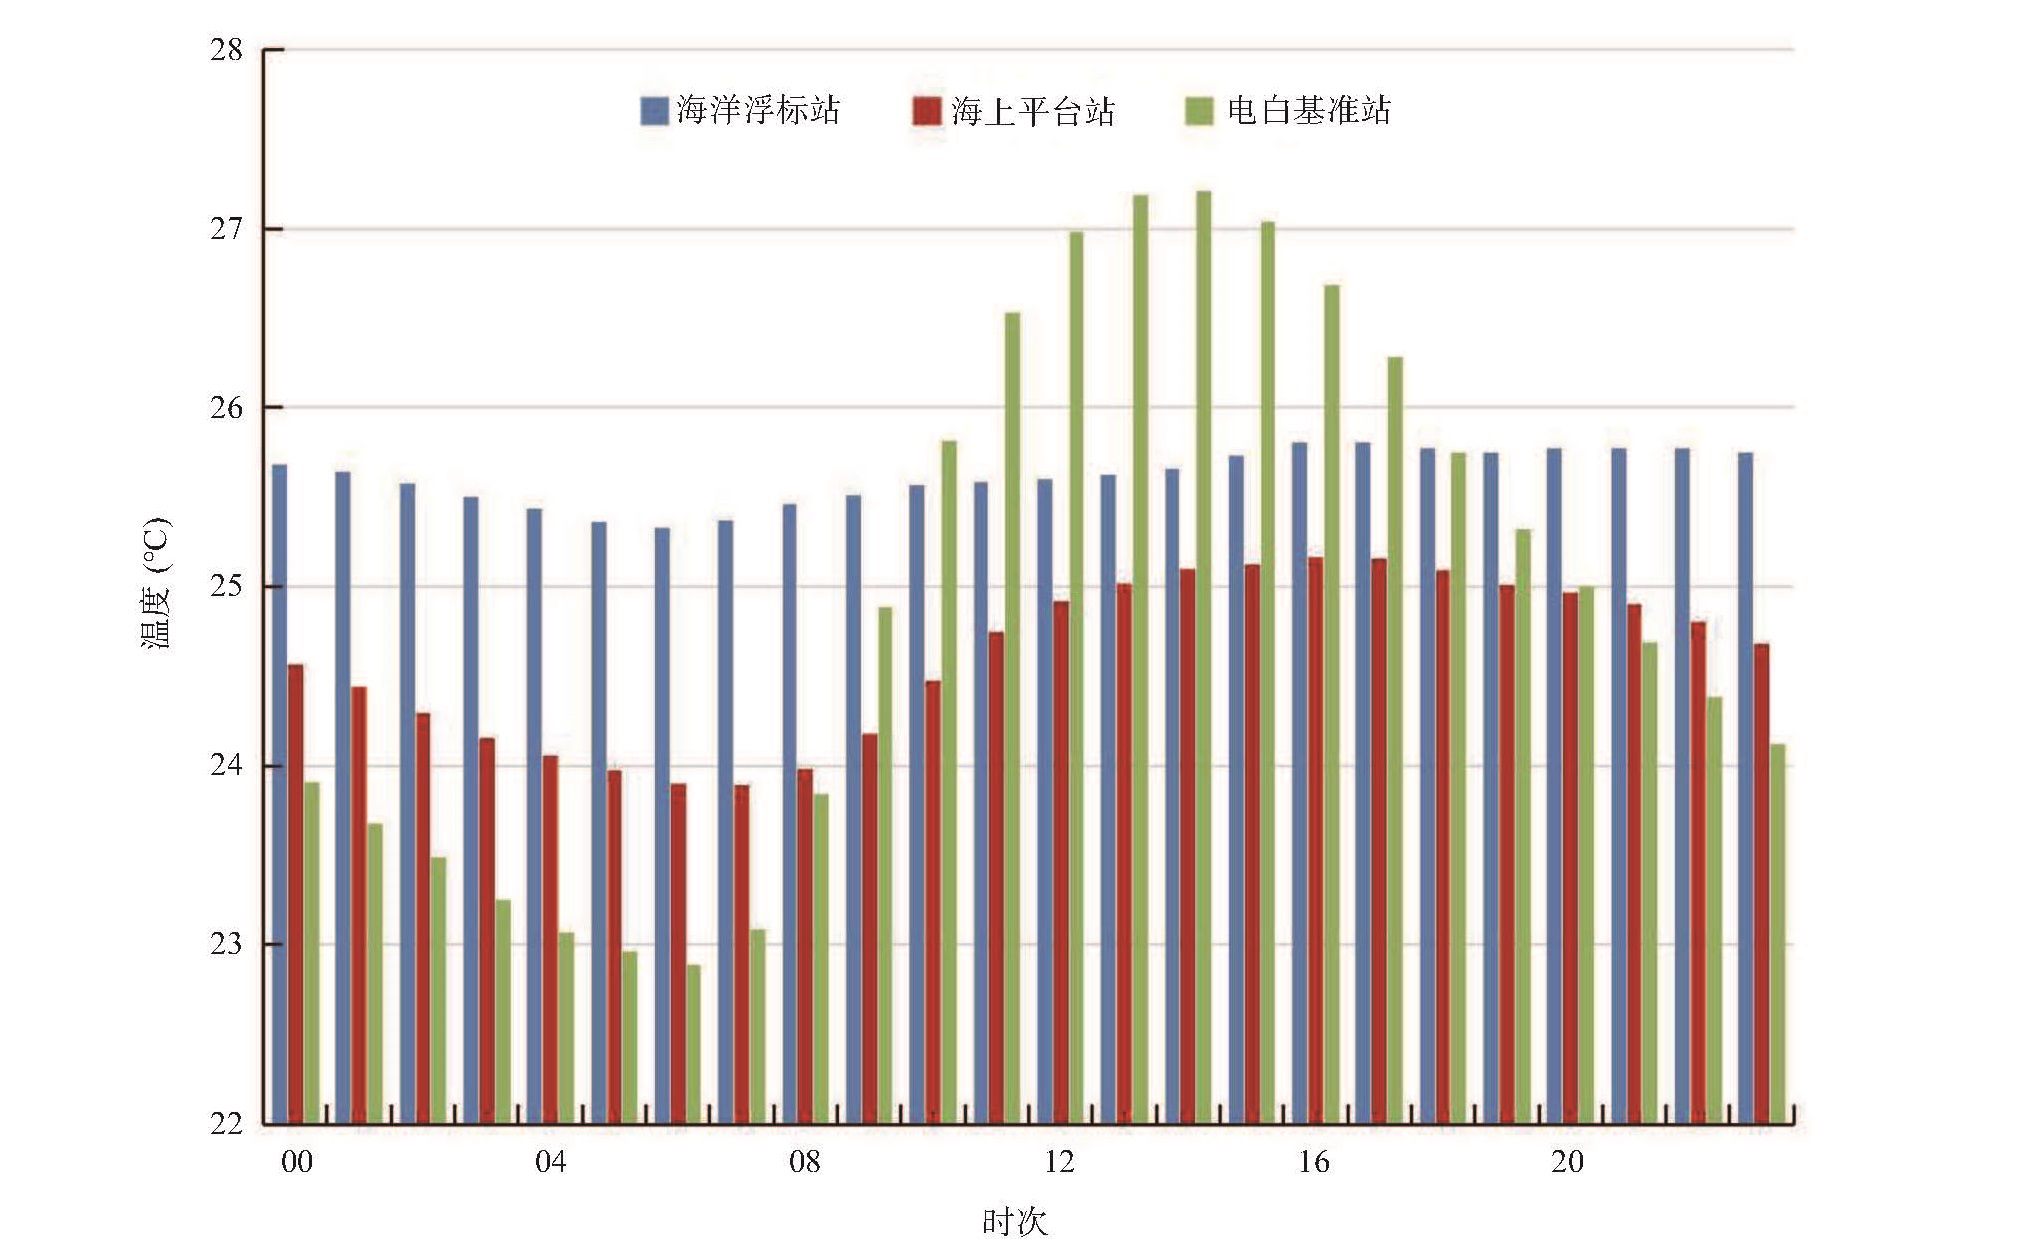
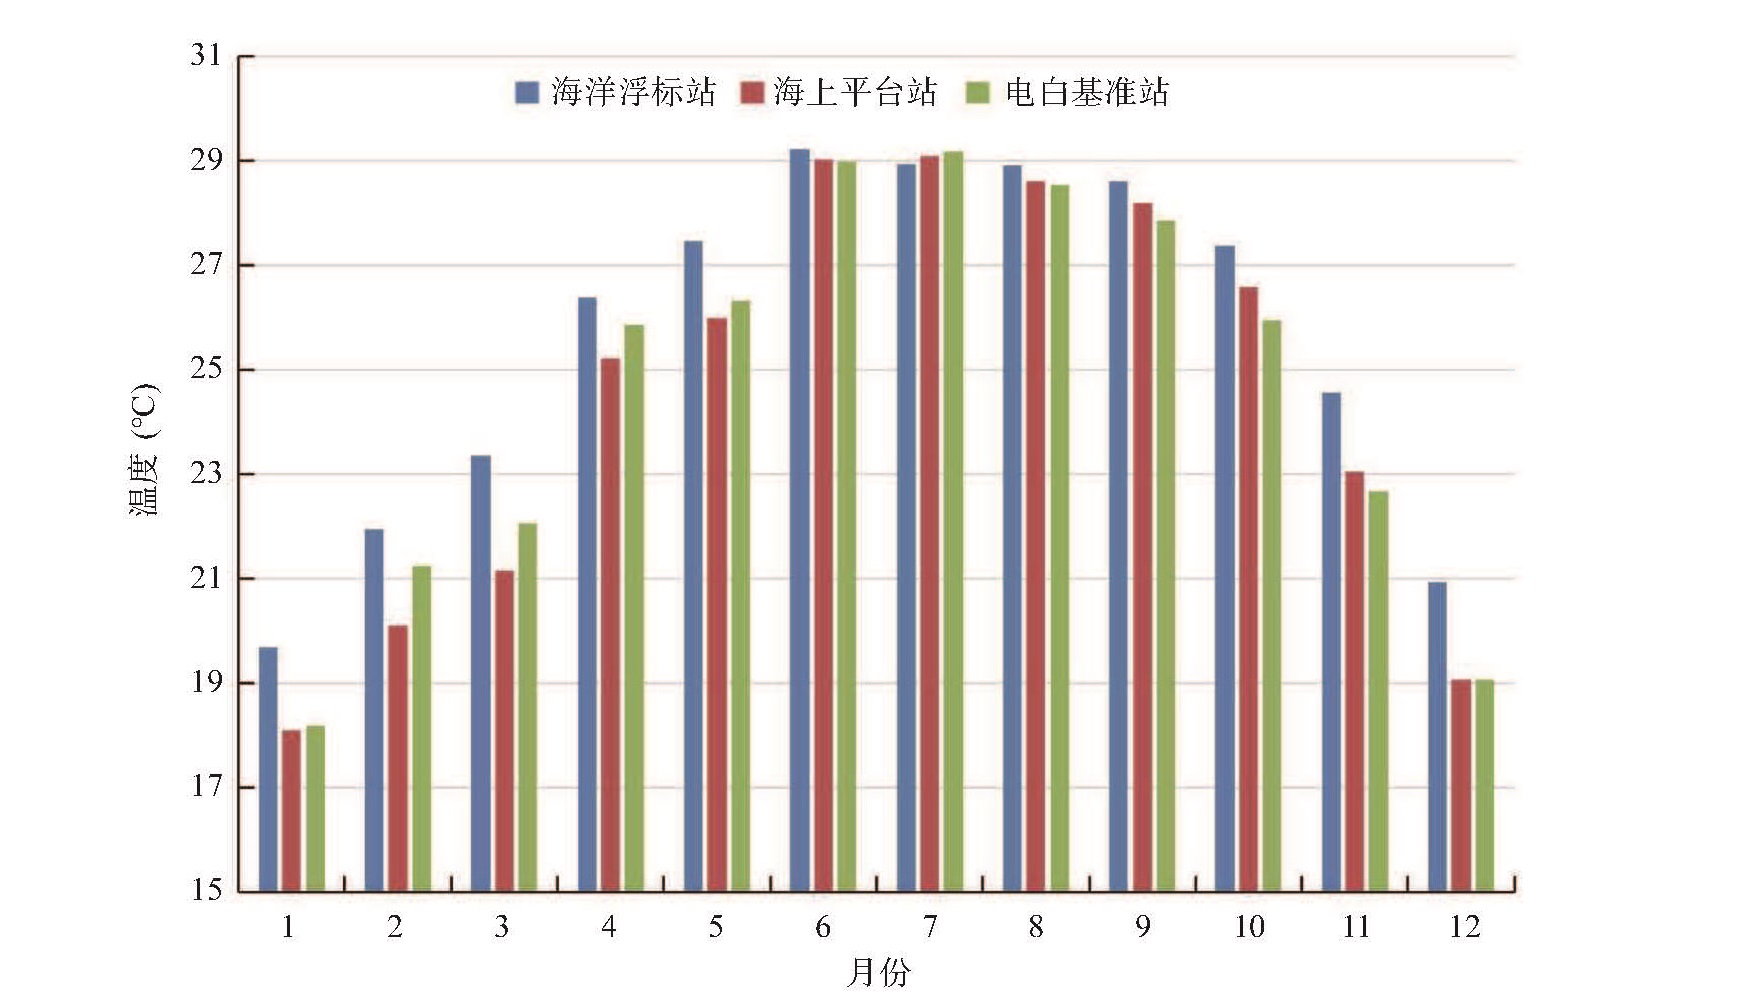
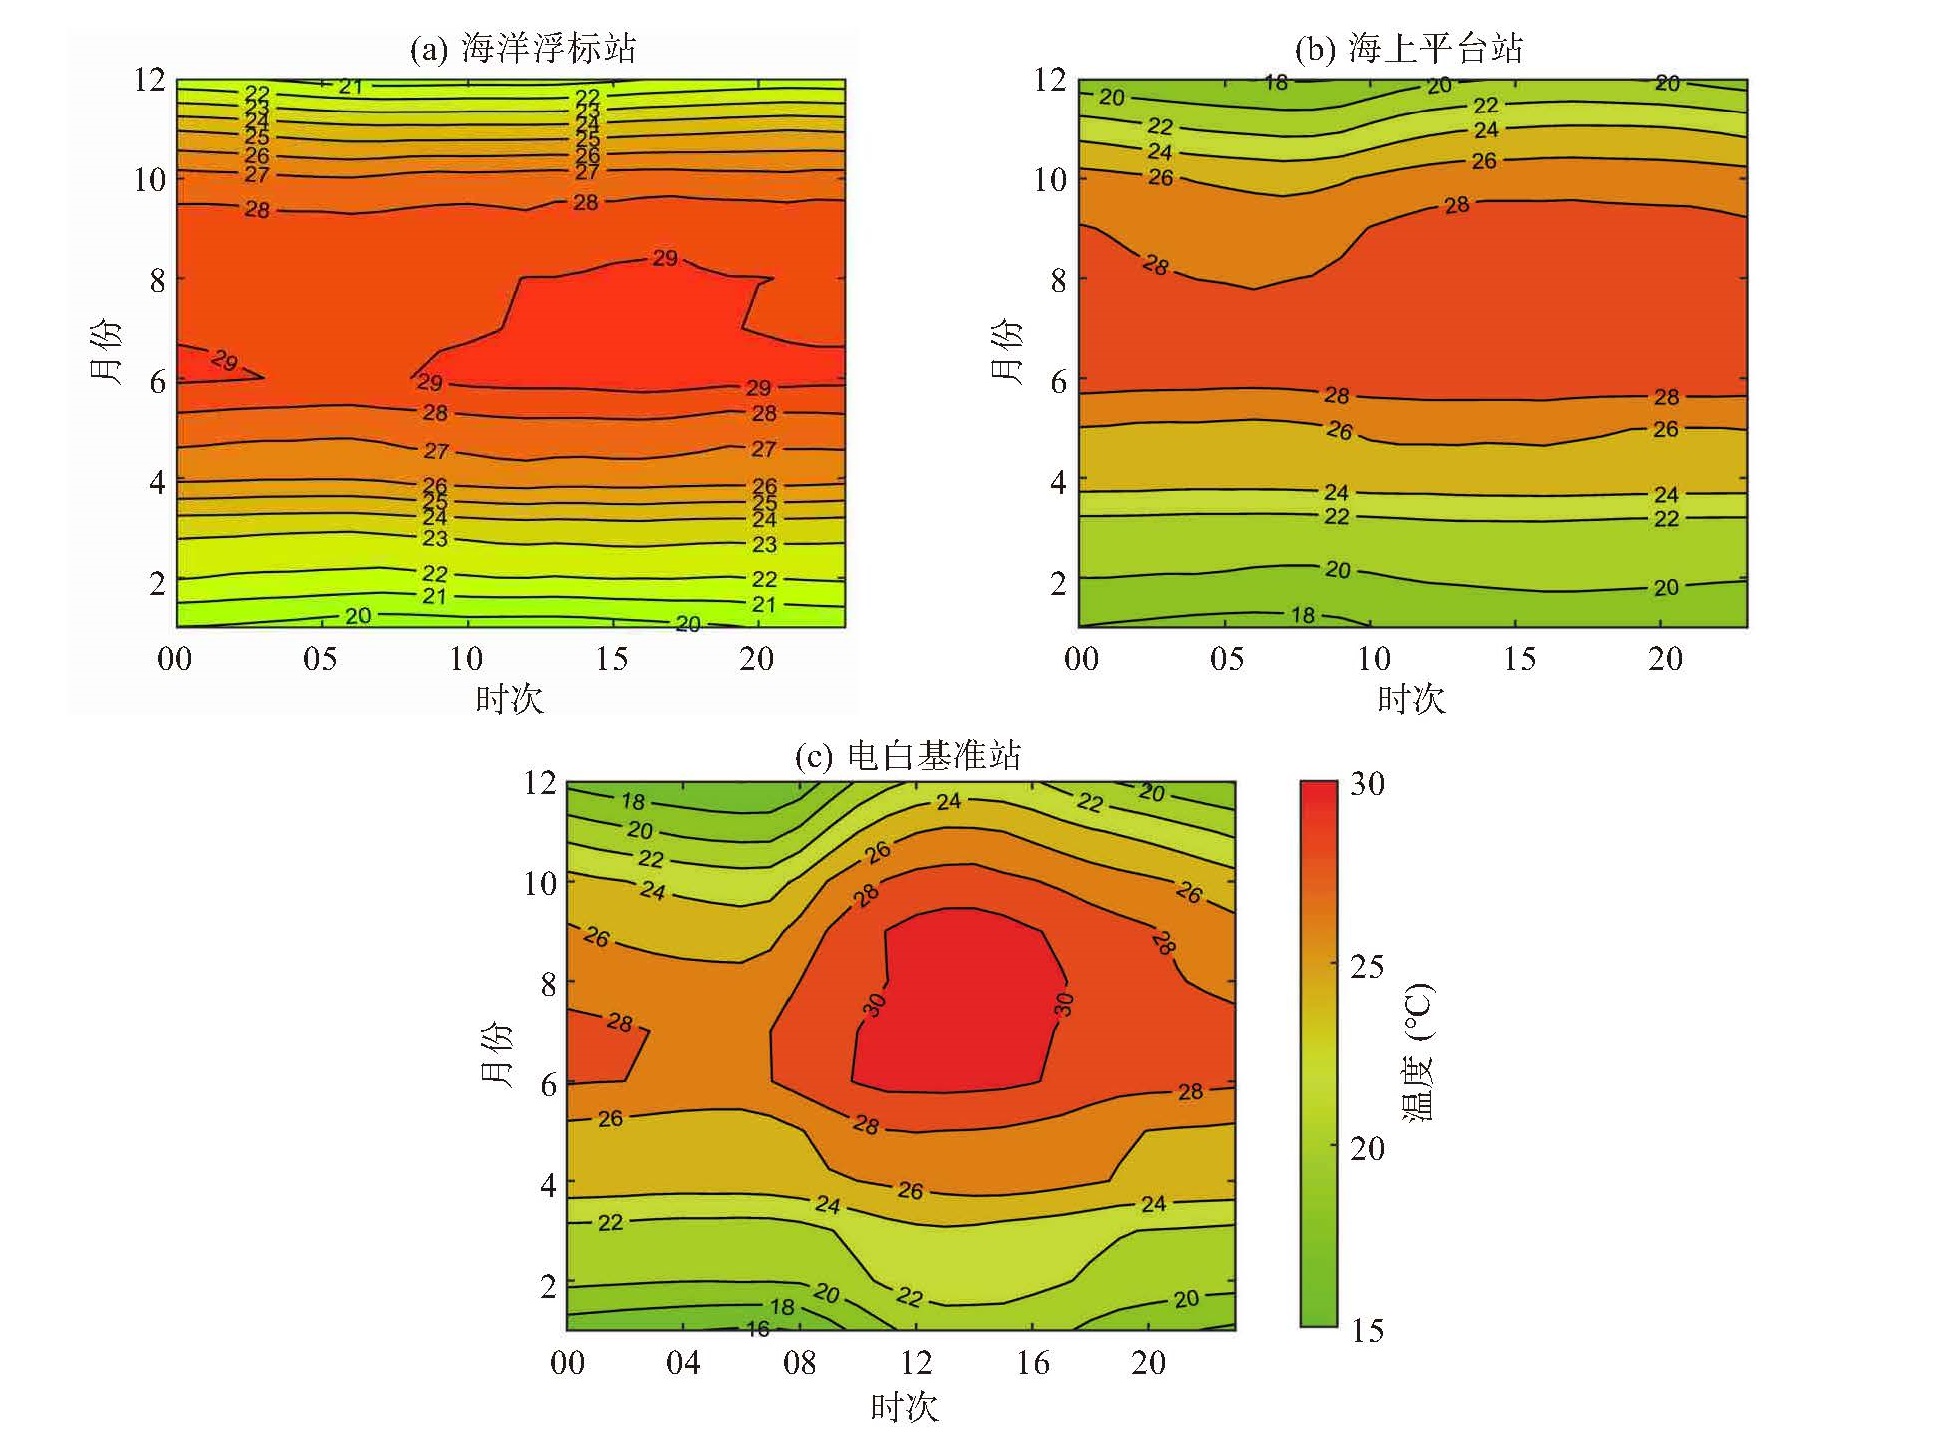
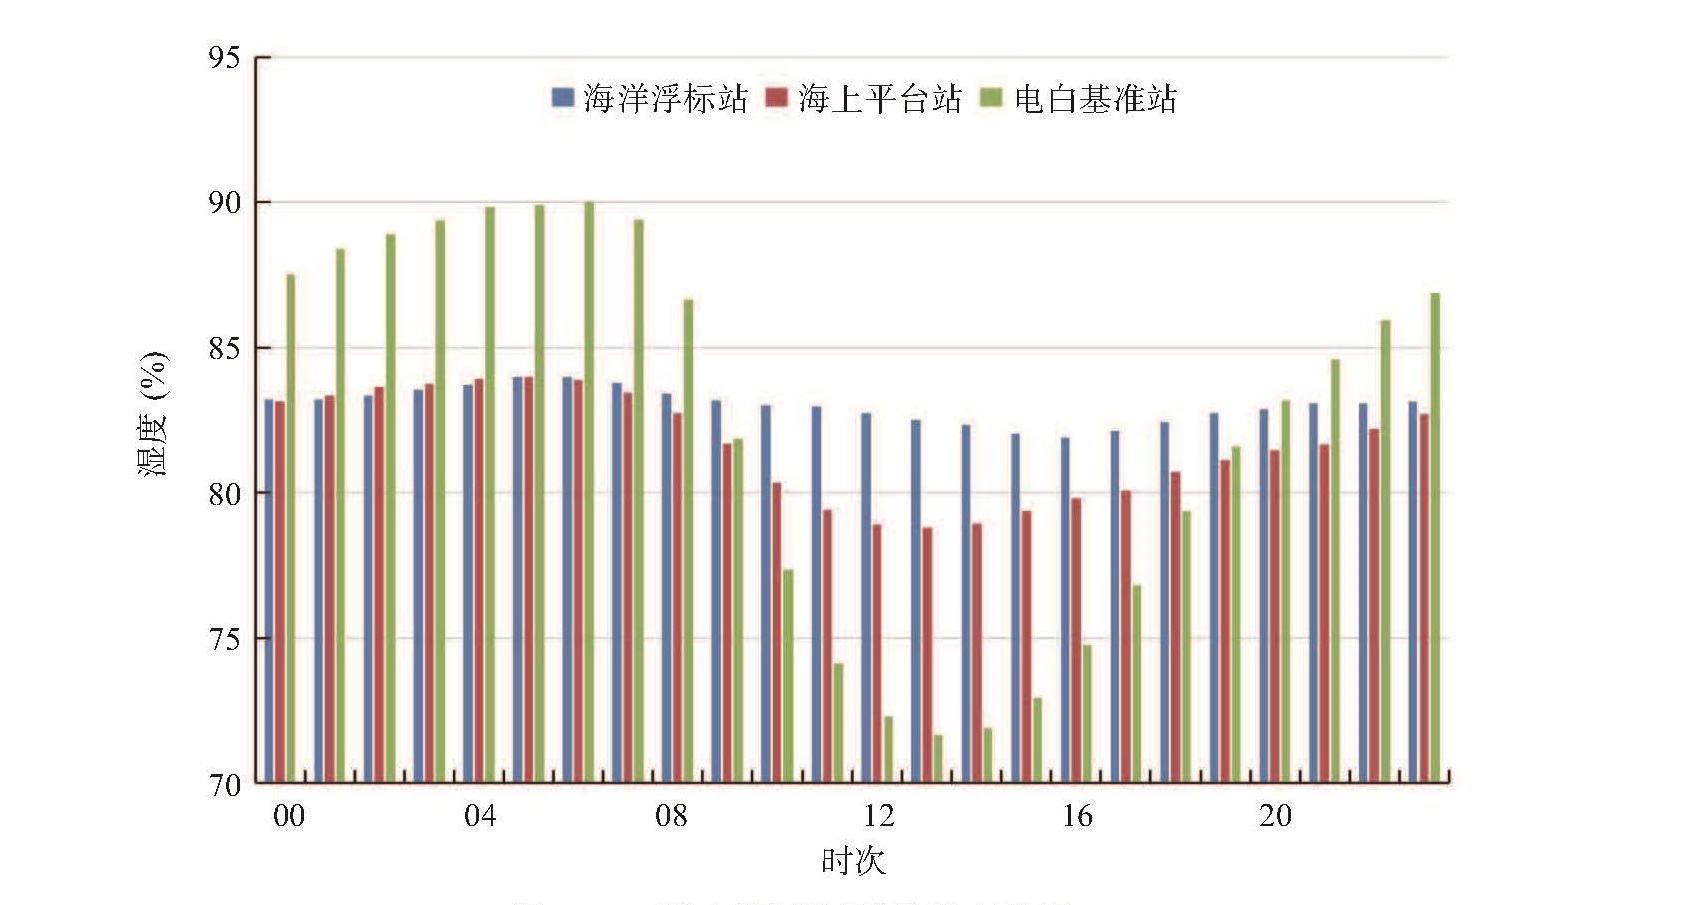
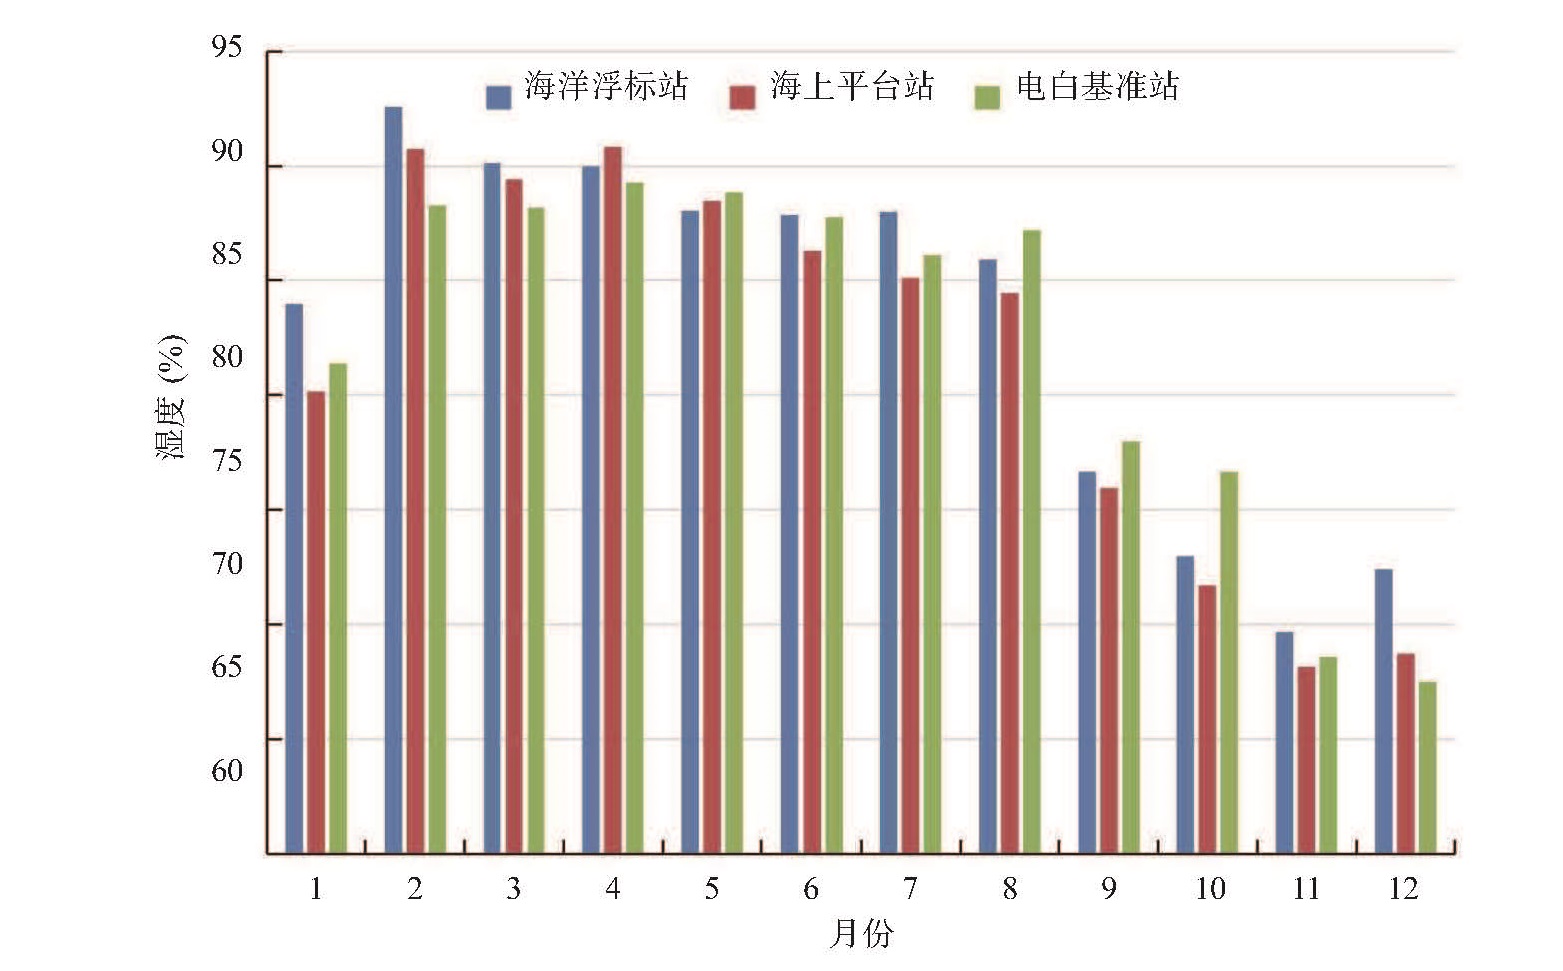
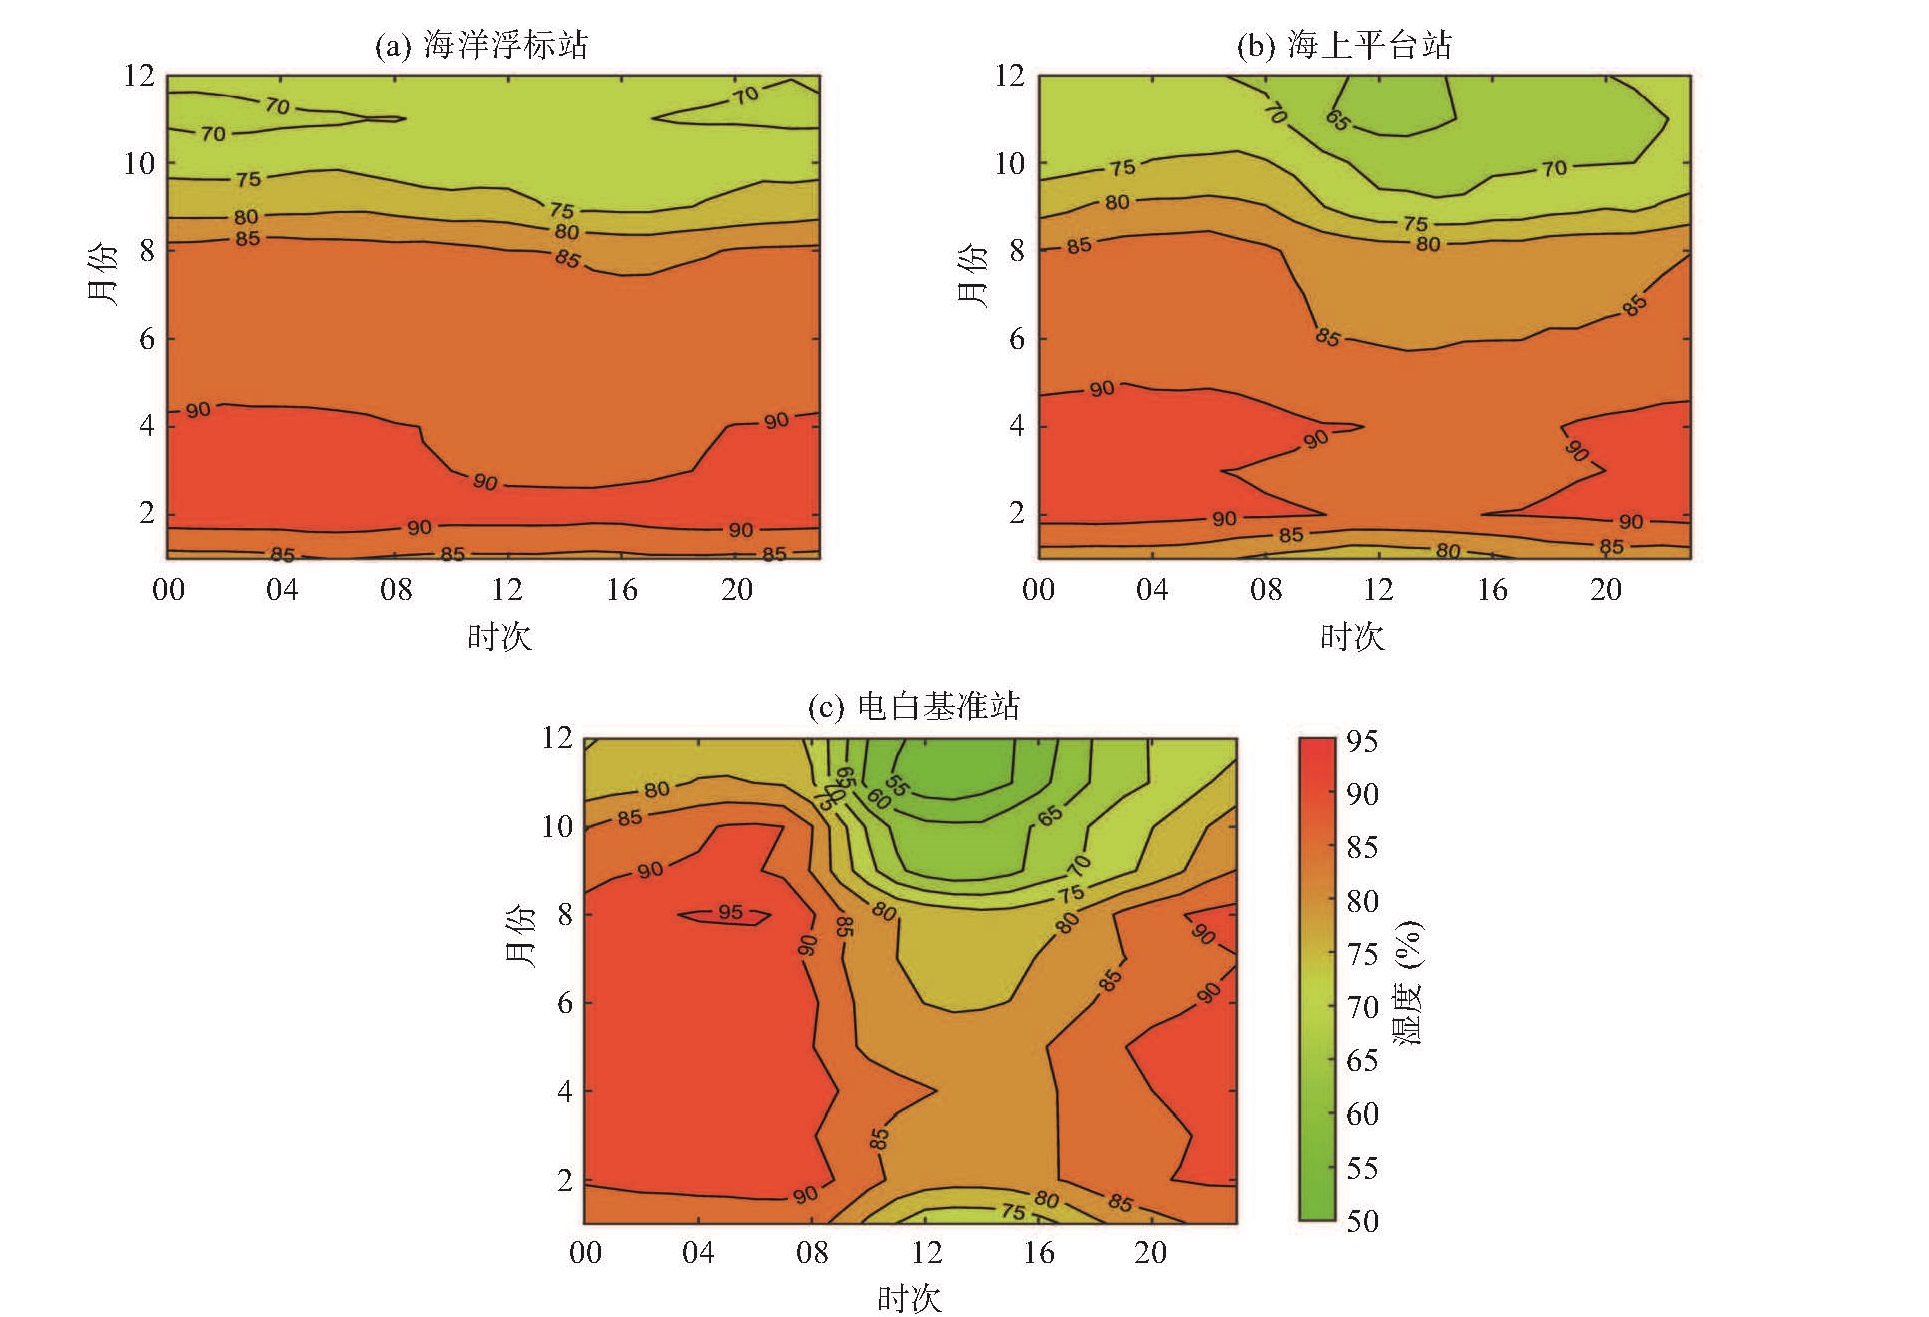
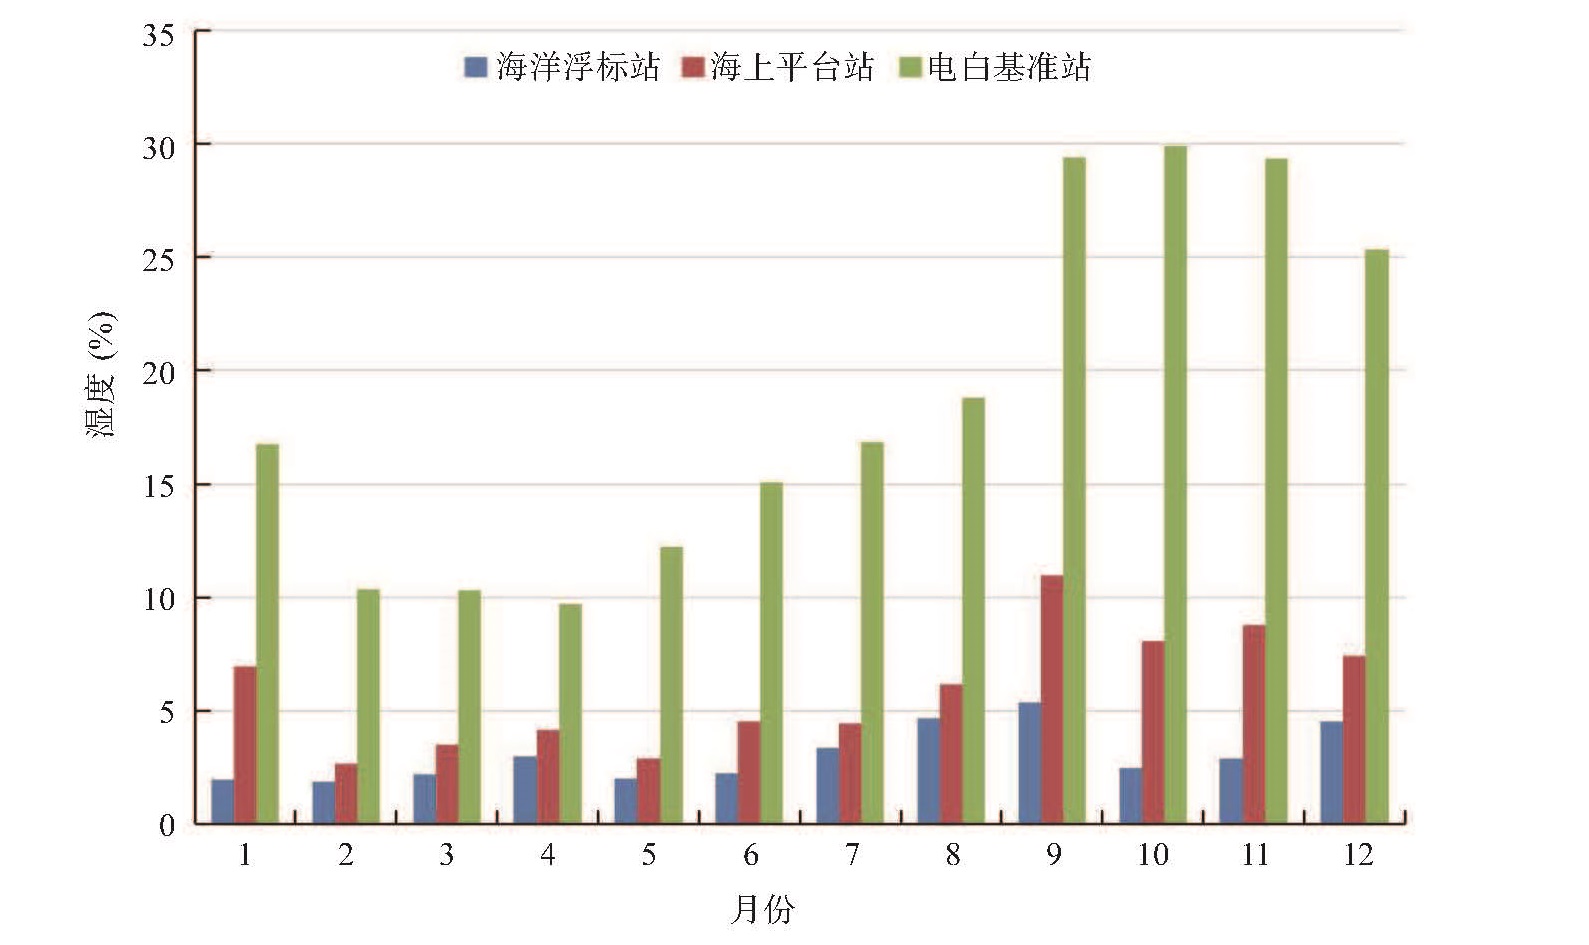
摘要: 基于广东省茂名近海海洋浮标站、近岸海上平台站以及陆地电白基准站1年的观测数据,对比分析了风速、风向、温度和湿度的变化特征。(1) 三个站点全年的主导风向均呈双峰状,只是主导风向有差异,海洋浮标站和海上平台站以东北风为主,偏南风为辅;而电白基准站主要是东北风和东南风。三个站点的月平均风速最小值都是在8月;最大值海洋浮标站出现在1月,海上平台站为11月,而电白基准站为4月。(2) 电白基准站和海上平台站温度年平均日变化呈现出“一谷一峰”型特征;海上浮标站早上有一个低谷,但是峰值不太明显。三个站点月平均温度都是上半年呈上升趋势,下半年呈下降趋势。海洋浮标站纬度更南,受到陆地影响最小,全年高温持续时间最长。(3) 三个站点的湿度年平均日变化都是呈“一峰一谷”型,即早晚湿度高,中午到下午低。从日变化振幅上看,电白基准站最大,海上平台站次之,海洋浮标站最小。三个站点湿度月平均都是2—8月湿度较大,最低月份出现在东北季风盛行的11—12月。海洋浮标站出现高湿度的月份最长;海上平台站因为受到陆地的影响,在中午和下午会出现较明显的低值区域。(4) 受下垫面的影响,三个站点的风速、温度和湿度的日较差全年平均值,最大值都是电白基准站,其次是海上平台站,最小是海洋浮标站。Abstract: In this study, we conducted a comparative analysis of meteorological parameters, including wind speed, wind direction, temperature, and humidity, at three stations in Maoming: the offshore marine buoy station, the nearshore marine platform station, and the inland Dianbai reference station. One year of observational data was collected for analysis. Our results indicate that: (1) The dominant wind direction of the three stations was bimodal throughout the year, but the dominant wind direction differed, with the marine buoy and platform stations experiencing mainly northeast winds and the Dianbai reference station experiencing mainly northeast and southeast winds. The minimum monthly mean wind speed of the three sites was in August. For the maximum value, the marine buoy station was in January, the marine platform station was in November, and the Dianbai reference station was in April. (2) The diurnal variation of the annual mean temperature at the Dianbai reference station and the marine platform station followed a"one valley and one peak"pattern. There was a low value at the marine buoy station in the morning, but the peak value was not obvious. The average monthly temperature of the three stations increased in the first half of the year and decreased in the second half. The marine buoy stations, which were further south in latitude and least affected by land, had the longest duration of high temperatures throughout the year. (3) The annual average diurnal variation of humidity followed a"one peak and one valley"pattern at all three sites, with high humidity in the morning and evening and lower levels from noon to afternoon. The Dianbai reference station had the largest diurnal variation amplitude, followed by the marine platform station, and the marine buoy station had the smallest. Monthly average humidity was relatively high from February to August, with the lowest levels occurring from November to December when the Northeast monsoon prevailed. The ocean buoy stations had the longest periods of high humidity, while the offshore platform showed a noticeable low-value area at noon and in the afternoon due to land influence. (4) Because of the underlying surface, the Dianbai reference station had the highest annual average diurnal range of wind speed, temperature, and humidity, followed by the marine platform station, and the marine buoy station had the lowest value.
-
Key words:
- Maoming area /
- offshore /
- nearshore /
- inland /
- meteorological elements /
- comparative analysis
-
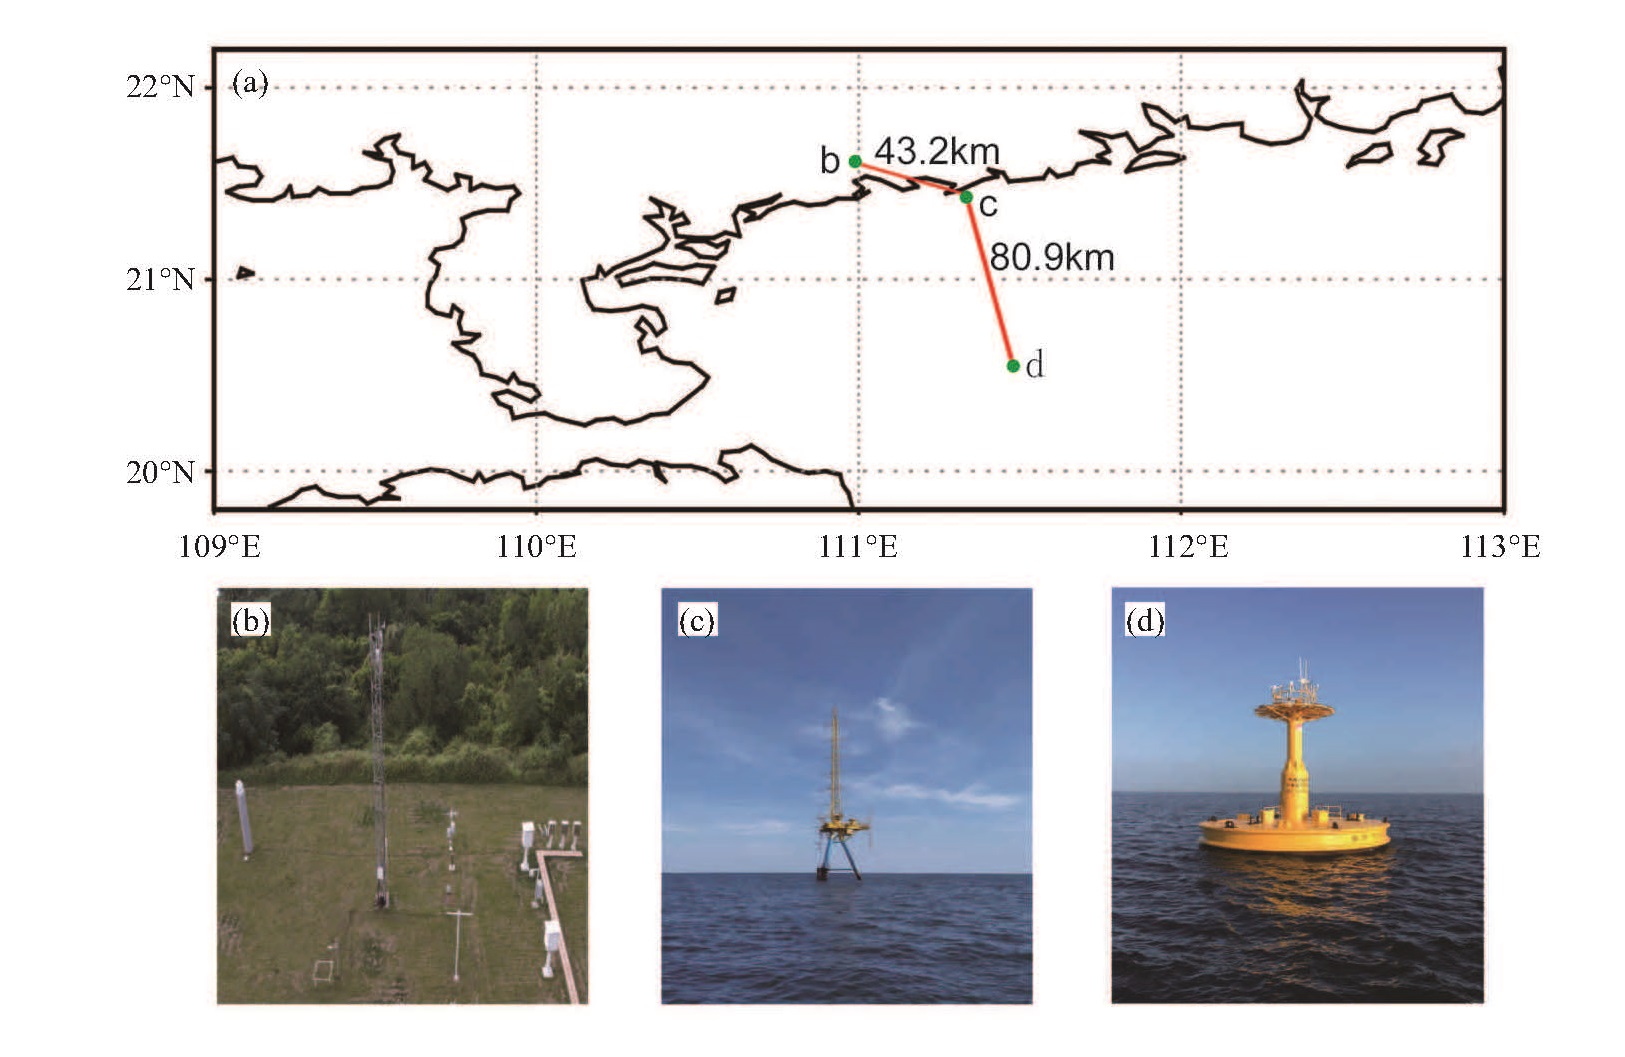
表 1 三个站点信息表
站点名称 海拔/m 水深/m 观测高度/m 离海岸线距离/km 海洋浮标站 10.0 60.0 10.0 92.9 海上平台站 13.4 15.0 13.4 6.5 电白基准站 31.6 -- 10.0 11.2  下载: 导出CSV
表 2 仪器设备信息表
设备名称 设备型号 产地厂家 测量范围 测量精度 风向风速传感器 Young-05106 美国 风向:0~100 m/s 风向:±0.3 m/s或1% 读数 RM Young 风速:0~360 ° 风速:±3 ° 温湿度传感器 HMP155 芬兰 温度:-80~60 ℃ 温度:±(0.226 0-0.002 8×温度读数)℃ (-80~20 ℃);
±(0.055 0+0.005 7×温度读数)℃ (20~60 ℃)Vaisala 相对湿度:0~100% 相对湿度:±(1.000+0.008×相对湿度读数)% (-20~40 ℃);
±(1.200+0.012×相对湿度读数)% (40~60 ℃)
下载: 导出CSV
表 3 三个站点全年风向频率表(%)
站点 N NNE NE ENE E EES ES SES S SSW SW WSW W WNW NW NNW 海洋浮标站 0.9 8.5 16.8 18.9 10.3 6.0 5.7 7.8 11.1 6.4 1.9 1.8 1.3 0.9 0.9 0.8 海上平台站 7.4 18.2 13.5 18.1 10.6 6.2 4.7 4.8 6.0 3.0 1.9 1.4 1.1 0.9 0.6 1.4 电白基准站 4.8 8.7 18.2 9.3 9.2 10.0 17.1 7.6 5.0 1.8 1.1 0.9 1.7 1.3 0.8 2.5 备注:大于3%的风向频率加粗显示。
下载: 导出CSV
表 4 三站点风向、风速、温度、湿度的月平均和年平均值
月份 风向 风速 温度 湿度 A B C A B C A B C A B C 1 52.10 44.39 72.26 7.45 2.59 1.47 19.69 18.11 18.19 83.98 80.17 81.40 2 84.84 57.09 107.69 4.59 2.89 2.39 21.95 20.10 21.24 92.56 90.73 88.27 3 83.38 48.34 97.64 4.40 2.92 2.07 23.35 21.15 22.06 90.12 89.42 88.18 4 141.14 76.38 121.29 3.93 2.46 2.58 26.37 25.21 25.85 89.96 90.81 89.28 5 108.71 64.87 106.34 3.22 2.12 1.69 27.47 25.99 26.31 88.02 88.48 88.83 6 189.06 162.10 144.57 4.30 1.98 1.65 29.22 29.03 28.98 87.84 86.29 87.74 7 168.41 150.48 133.63 3.14 1.70 1.36 28.93 29.07 29.18 88.00 85.10 86.10 8 177.80 103.08 97.48 1.21 0.60 0.61 28.90 28.59 28.53 85.90 84.45 87.20 9 53.83 44.70 54.93 2.86 2.54 0.99 28.59 28.18 27.85 76.68 75.96 77.98 10 69.75 54.30 75.62 4.21 3.85 1.38 27.37 26.58 25.93 72.99 71.71 76.68 11 53.20 45.30 70.63 6.63 5.16 1.50 24.56 23.05 22.67 69.66 68.17 68.58 12 50.32 44.88 70.71 6.46 5.14 1.46 20.94 19.07 19.06 72.41 68.73 67.51 年平均 102.71 74.66 96.07 4.37 2.83 1.60 25.61 24.51 24.65 83.18 81.67 82.31 注:A代表海洋浮标站,B代表海上平台站,C代表电白基准站。表中加粗数字代表最大值,加粗斜体数字代表最小值(表 5同)。
下载: 导出CSV
表 5 三站点风向、风速、温度、湿度的年小时平均值
时次 风向 风速 温度 湿度 A B C A B C A B C A B C 00 91.09 55.52 80.84 3.33 2.43 1.31 25.69 24.56 23.91 83.20 83.15 87.53 01 87.65 49.62 77.16 3.10 2.34 1.28 25.65 24.44 23.68 83.20 83.35 88.39 02 84.58 43.46 72.26 2.95 2.27 1.25 25.58 24.29 23.48 83.35 83.64 88.89 03 79.91 38.46 68.04 2.77 2.33 1.27 25.50 24.16 23.25 83.54 83.75 89.36 04 79.20 35.65 67.84 2.77 2.38 1.26 25.44 24.05 23.07 83.73 83.92 89.83 05 76.10 34.03 68.87 2.77 2.43 1.25 25.36 23.97 22.96 83.97 83.97 89.92 06 74.63 33.75 67.67 2.70 2.55 1.28 25.33 23.90 22.89 83.99 83.87 90.02 07 75.28 33.46 68.99 2.70 2.61 1.23 25.37 23.89 23.08 83.80 83.44 89.39 08 75.39 34.42 70.58 2.75 2.65 1.24 25.46 23.98 23.84 83.41 82.74 86.66 09 74.04 36.76 77.99 2.84 2.56 1.31 25.51 24.18 24.89 83.17 81.69 81.87 10 73.07 42.54 91.03 2.88 2.46 1.39 25.57 24.48 25.82 83.01 80.33 77.37 11 73.45 51.85 104.74 2.82 2.41 1.51 25.59 24.74 26.53 82.99 79.41 74.13 12 74.72 62.88 116.95 2.92 2.36 1.67 25.60 24.92 26.98 82.75 78.90 72.31 13 76.44 73.33 124.76 2.96 2.41 1.87 25.63 25.02 27.19 82.52 78.79 71.66 14 77.50 81.14 130.93 2.97 2.51 2.11 25.66 25.10 27.21 82.32 78.93 71.92 15 80.37 86.45 132.41 3.01 2.56 2.23 25.73 25.13 27.04 82.05 79.38 72.95 16 84.27 89.32 130.94 3.15 2.66 2.21 25.80 25.16 26.69 81.90 79.80 74.77 17 86.30 88.43 126.82 3.32 2.71 2.11 25.80 25.16 26.28 82.13 80.09 76.82 18 88.43 84.94 119.99 3.50 2.77 1.90 25.77 25.09 25.75 82.44 80.72 79.37 19 89.80 81.13 111.14 3.64 2.89 1.79 25.75 25.01 25.32 82.75 81.14 81.59 20 89.99 77.21 103.82 3.81 2.92 1.71 25.77 24.97 25.00 82.88 81.45 83.17 21 91.60 72.06 98.15 3.86 2.90 1.59 25.77 24.90 24.69 83.06 81.66 84.59 22 92.19 67.57 92.83 3.81 2.80 1.51 25.77 24.81 24.38 83.06 82.20 85.92 23 92.97 62.00 85.22 3.60 2.62 1.38 25.75 24.68 24.12 83.14 82.72 86.88
下载: 导出CSV
-
[1] TAO S Y, CHEN L X. A review of recent research on the East Asia summer monsoon in China, in Monsoon Meteorology[M]. New York: Oxford Univ Press, 1987: 60-92. [2] 李崇银, 张利平. 南海夏季风活动及其影响[J]. 大气科学, 1999, 23(3): 257-66. [3] 梁建茵, 吴尚森, 游积平. 南海夏季风的建立及强度变化[J]. 热带气象学报, 1999, 15(2): 97-105. [4] 廖捷, 周自江. 全球常规气象观测资料质量控制研究进展与展望[J]. 气象科技进展, 2018, 8(1): 56-63. [5] 孙莎莎, 吴炜, 郭俊建. 山东沿海测风高度对风速的影响和订正研究[J]. 海洋预报, 2015, 32(6): 34-39. [6] 姜瑜君, 杨程, 吴贤笃, 等. 近海岸风速衰减特征及形成机理分析[J]. 热带气象学报, 2020, 36(5): 603-615. [7] 陈洪滨, 李军, 马舒庆, 等. 海洋气象观测技术研发进展[J]. 科技导报, 2019, 37(6): 91-97. [8] 毕雪岩, 刘春霞, 黄健, 等. 台风登陆过程中南海近海阵风因子特征[J]. 热带气象学报, 2022, 38(4): 502-510. [9] EBUCHI N, GRABER H C, CARUSO M J. Evaluation of wind vectors observed by QuikSCAT/SeaWinds using ocean buoy data[J]. J Atmos Oceanic Technol, 2002, 19(12): 2 049-2 062. [10] PICKETT M H, TANG W Q, ROSENFELD L K, et al. QuikSCAT satellite comparisons with nearshore buoy wind data off the US West Coast[J]. J Atmos Oceanic Technol, 2003, 20(12): 1 869-1 879. [11] 刘志亮, 宋丽娜, 王凡, 等. 北黄海QuikSCAT卫星风速与浮标风速的对比分析[J]. 海洋科学, 2012, 36(3): 1-7. [12] 刘花, 王静, 齐义泉, 等. 南海北部近岸海域Jason-1卫星高度计与浮标观测结果的对比分析[J]. 热带海洋学报, 2013, 32(5): 15-22. [13] LI D W, SHEN H. Evaluation of wind vectors observed by HY-2A scatterometer using ocean buoy observations, ASCAT measurements, and numerical model data[J]. Chinese Journal of Oceanology and Limnology, 2015, 33(5): 1 191-1 200. [14] YANG J G, ZHANG J. Comparison of Oceansat-2 Scatterometer wind data with global moored buoys and ASCAT observation[J]. Adv Meteor, 2019: 1-9. https://doi.org/10.1155/2019/1651267. [15] CASTRO S L, WICK G A and EMERY W J. Evaluation of the relative performance of sea surface temperature measurements from different types of drifting and moored buoys using satellite-derived reference products[J]. J Geophys Res: Oceans, 2012, 117(C2): C02029. [16] 朱恩泽, 张雷, 石汉青, 等. 2004年—2013年WindSat海表面温度产品与浮标观测对比[J]. 遥感学报, 2016, 20(2): 315-327. [17] SONG L N, LIU Z L, WANG F. Comparison of wind data from ERA-Interim and buoys in the Yellow and East China Seas[J]. Chinese Journal of Oceanology and Limnology, 2015, 33(1): 282-288. [18] 王晨琦, 李响, 张蕴斐, 等. 3套不同的SST再分析数据与中国近海浮标观测的对比研究[J]. 海洋学报, 2020, 42(3): 118-128. [19] 中国气象局综合观测司. 海洋气象锚碇浮标功能规格需求书[Z]. 北京: 中国气象局, 2015. [20] HUANG H J, MAO W K. The South China Sea Monsoon Experiment-Boundary Layer Height(SCSMEX-BLH): Experimental design and preliminary results[J]. Mon Wea Rev, 2015, 143(12): 5 035-5 053. [21] CHEN G. Diurnal cycle of the Asian Summer Monsoon: Air Pump of the second kind[J]. J Climate, 2020, 33(3): 1 747-1 775. [22] 周武, 黄小丹, 黄忠, 等. 阳江地区海陆风特征及其影响[J]. 气象, 2008, 34(12): 44-53. [23] KRISHNAMURTI T N, STEFANOVA L, MISRA V. Tropical Meteorology: An Introduction[M]. New York: Springer, 2013: 423. [24] 林良勋, 冯业荣, 黄忠, 等. 广东省天气预报技术手册[M]. 北京: 气象出版社, 2006. [25] 范绍佳, 谭康初, 李智勤, 等. 广东沿海地区风场特征[J]. 中山大学学报(自然科学版), 1998, 37(4): 95-98. [26] 洪星园, 傅云飞, 冼桃, 等. 热带海表风速与海表温度日变化关系分析[J]. 气候与环境研究, 2014, 19(4): 437-451. [27] 王彬华. 海雾[M]. 北京: 海洋出版社, 1983. -


 点击查看大图
图(15) / 表(5)
计量
- 文章访问数: 1591
- HTML全文浏览量: 311
- PDF下载量: 746
- 被引次数: 0
 粤公网安备 4401069904700003号