


Anomalous Frequency of Tropical Cyclones Landing in South China and its Relationship with Atmospheric Circulation and SST from July to September
-
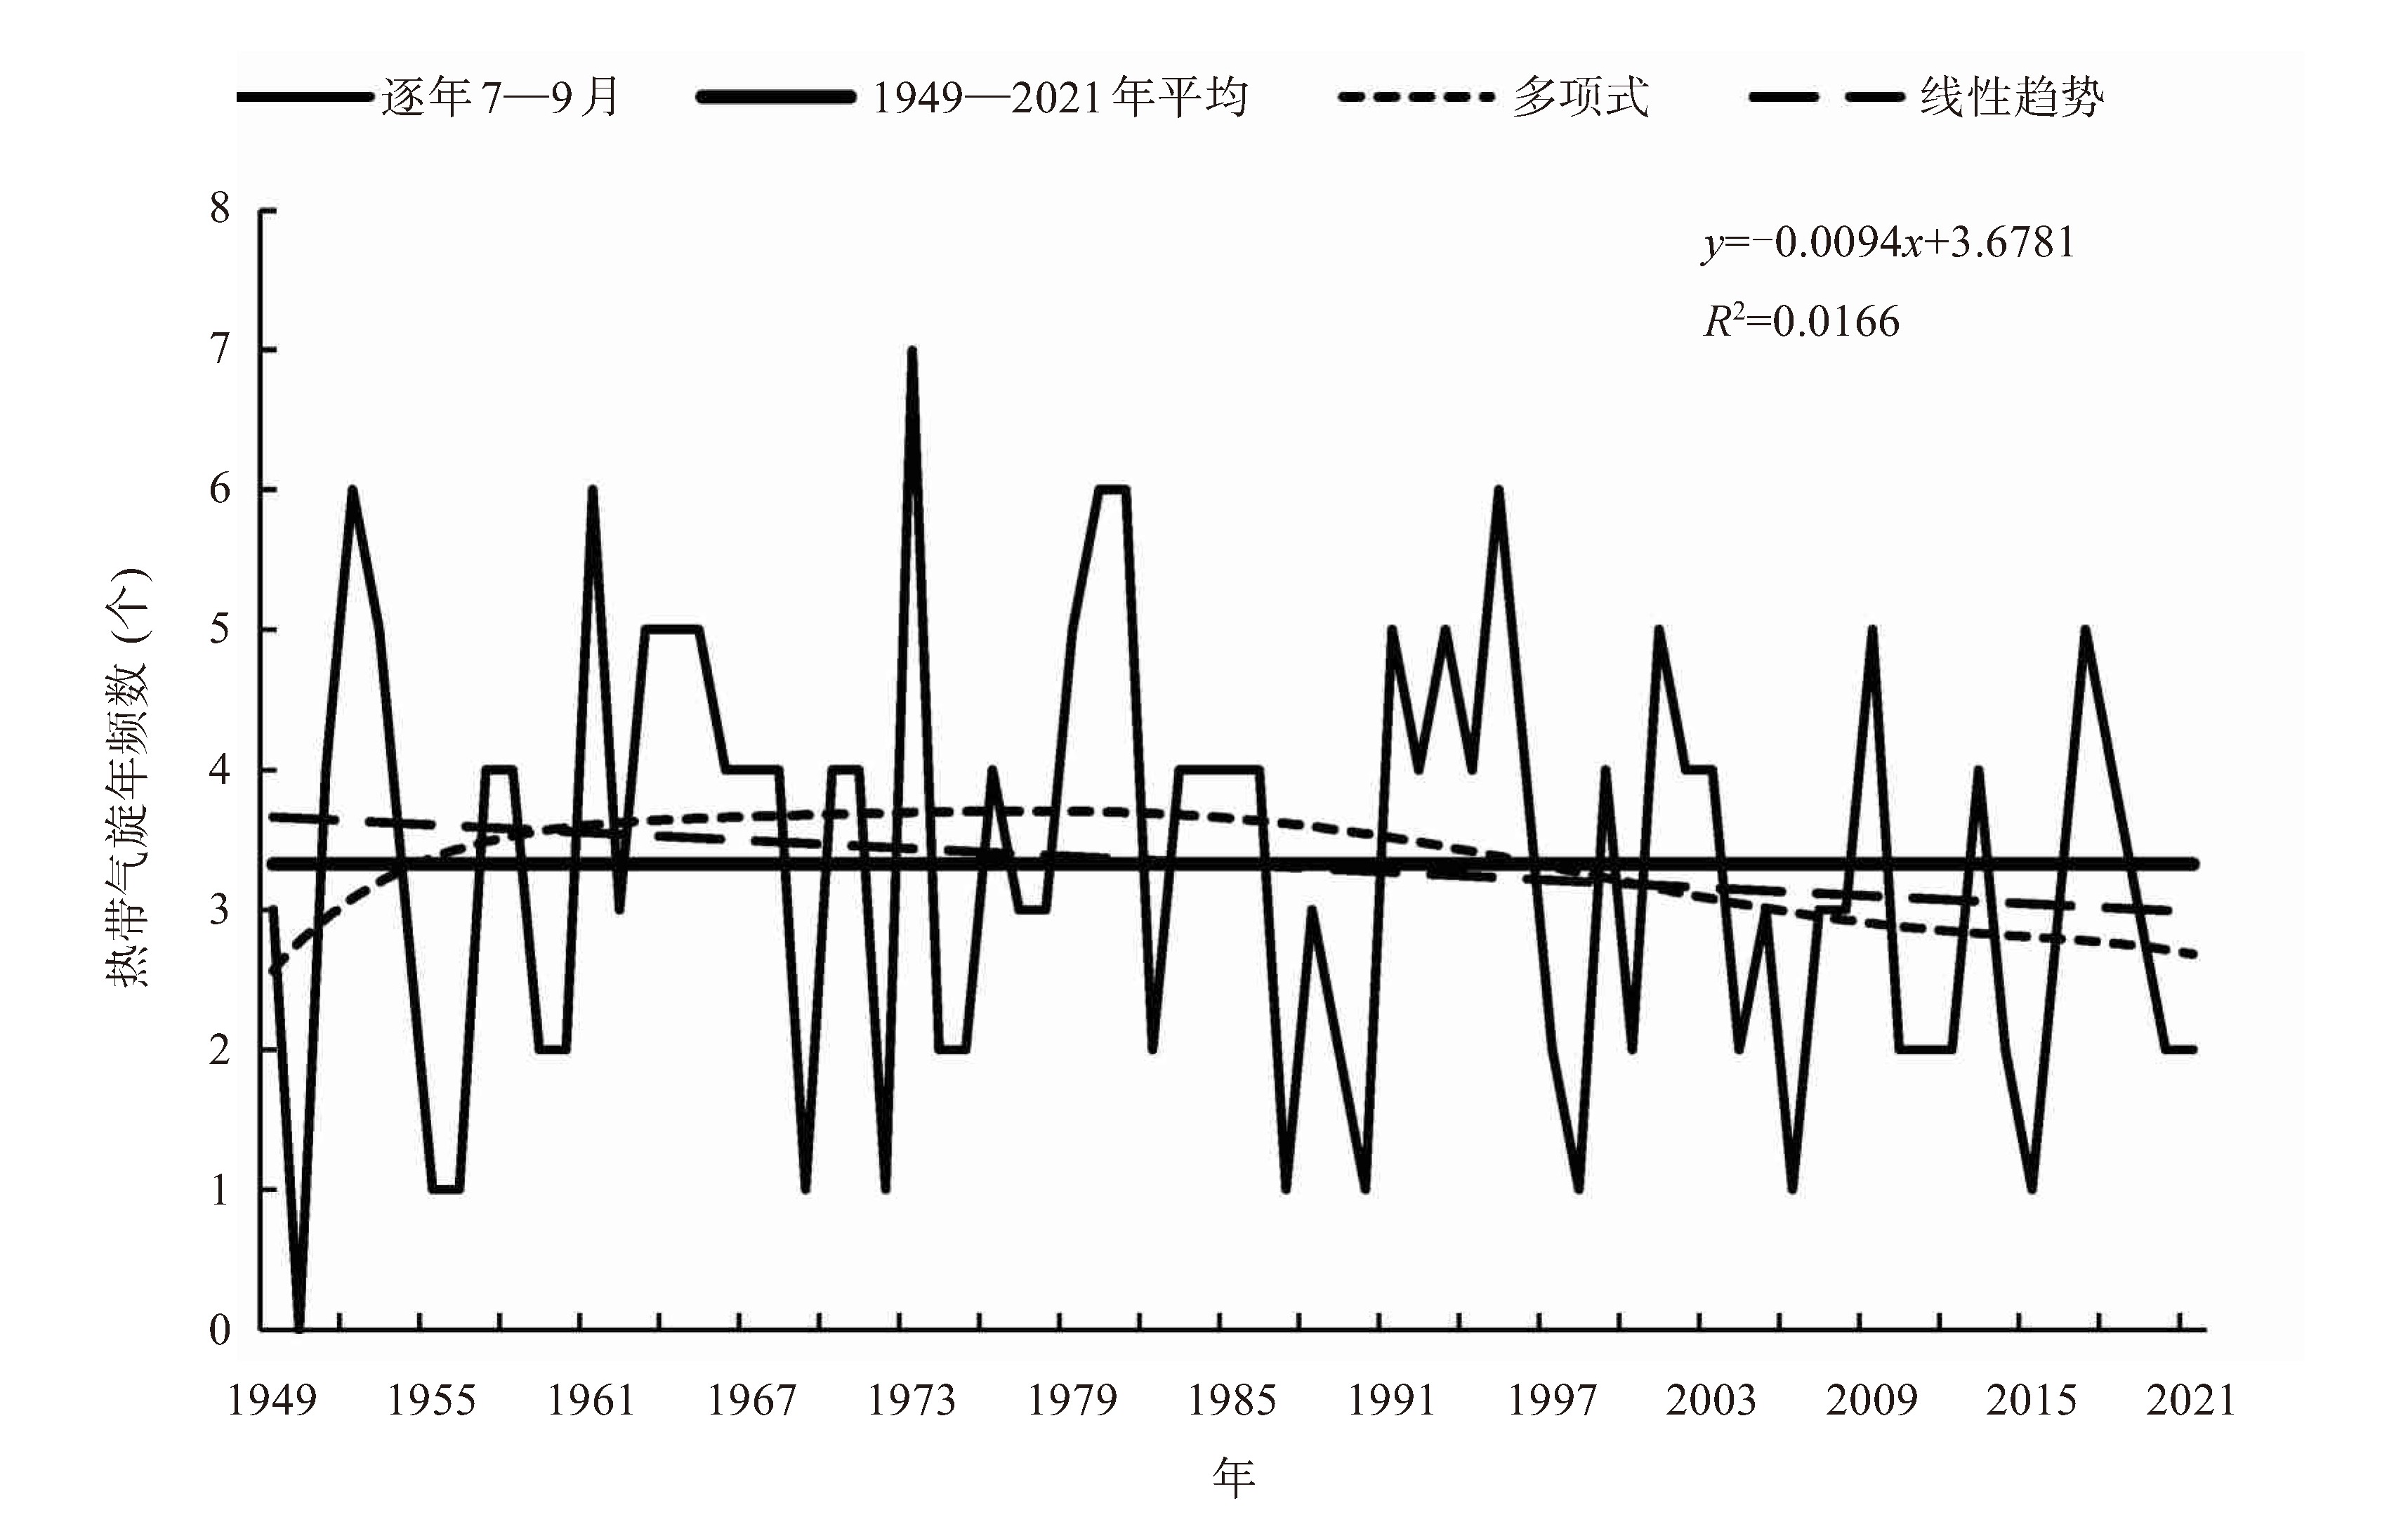
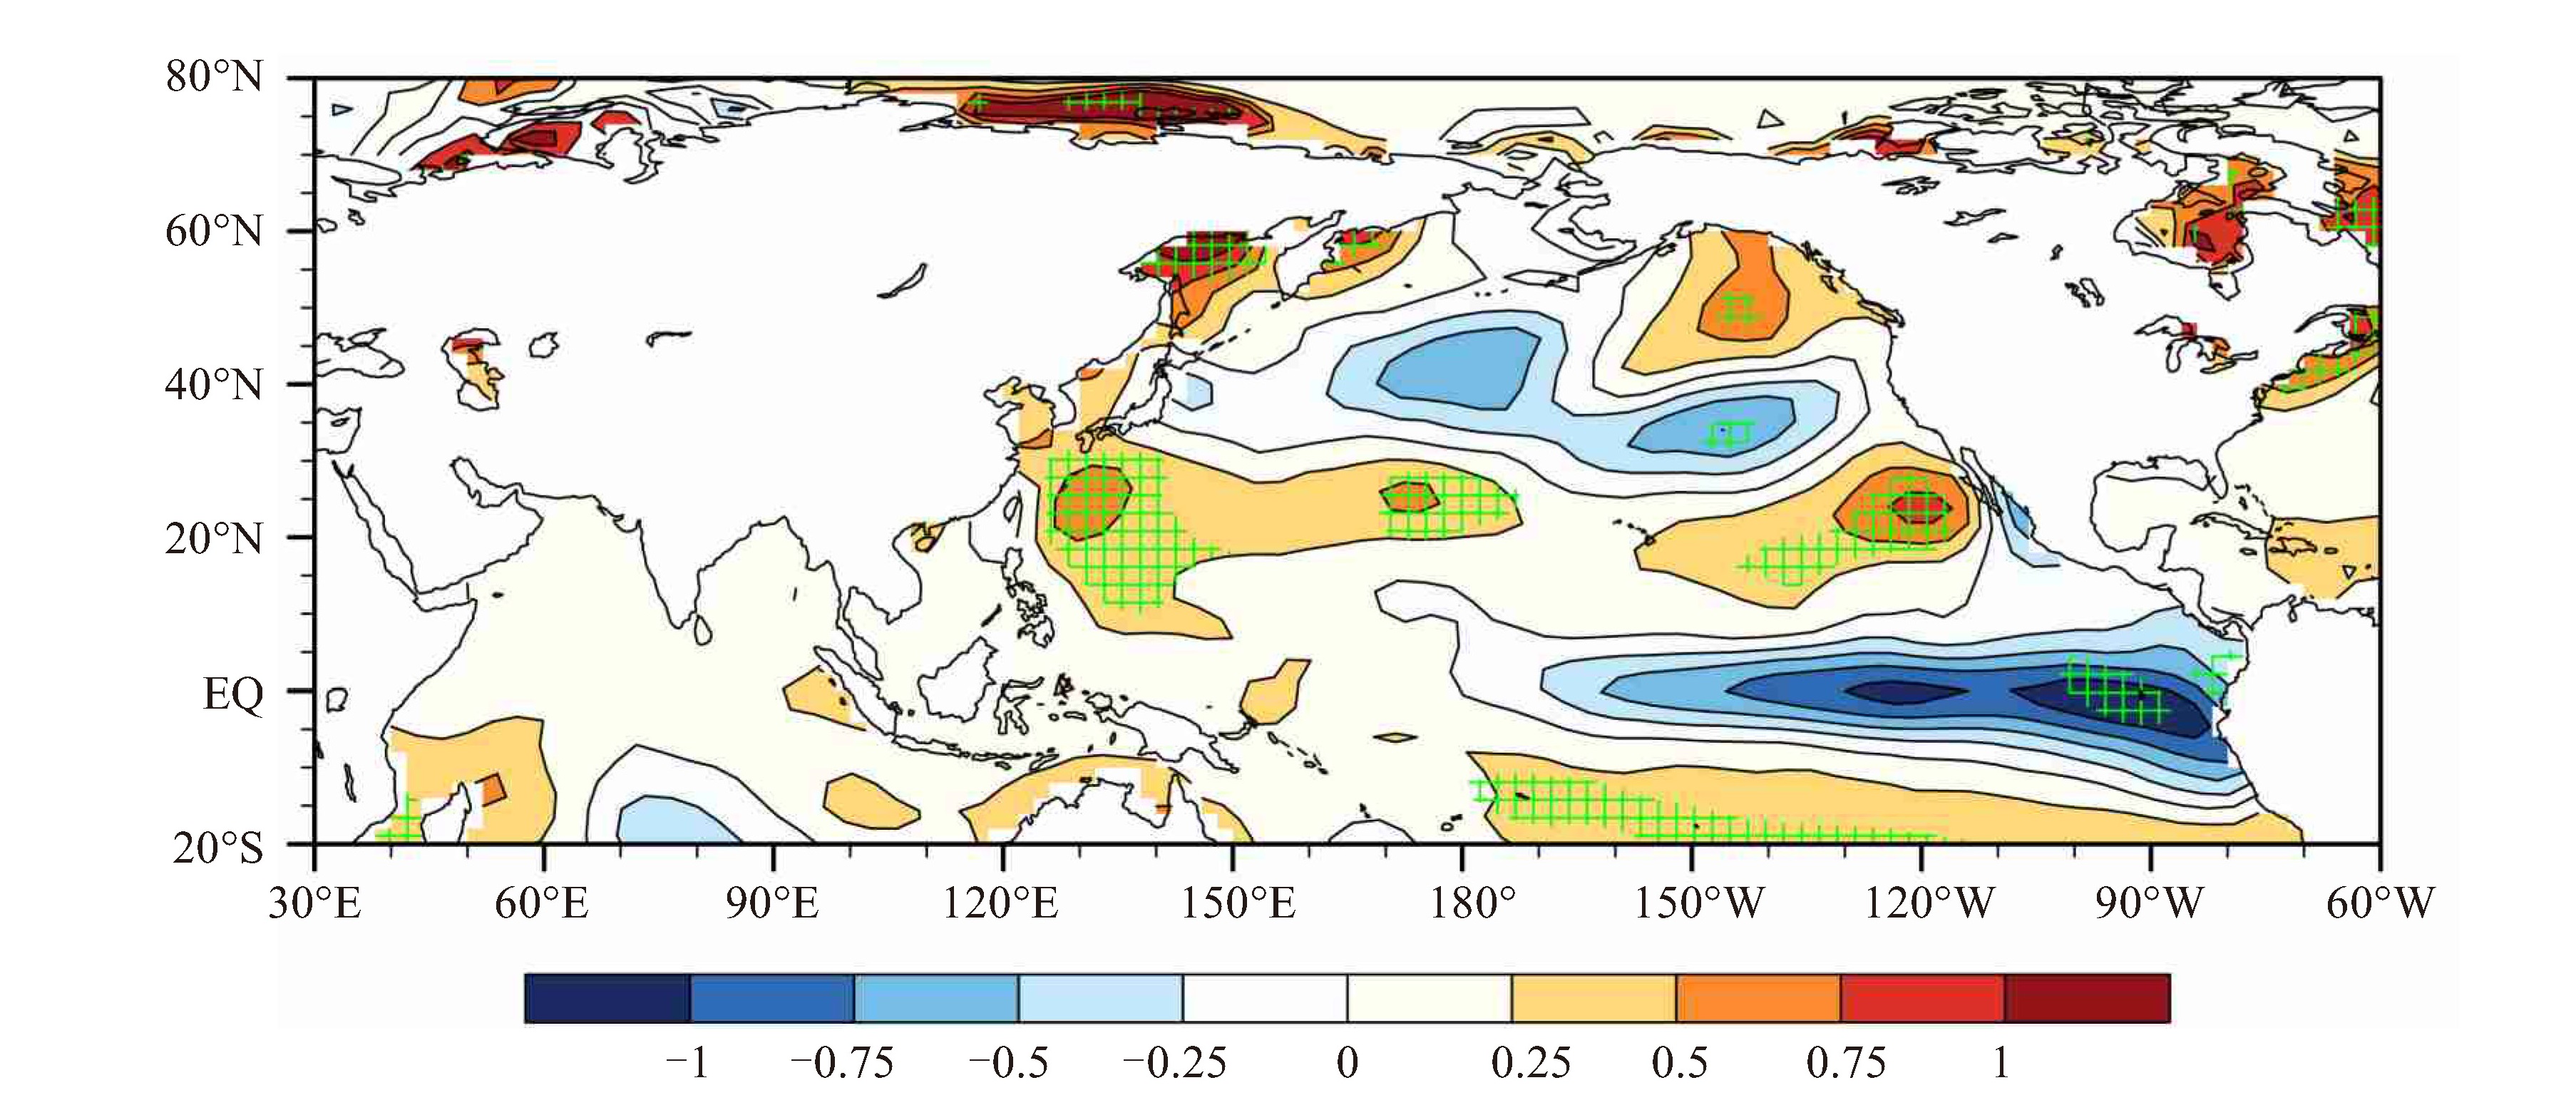
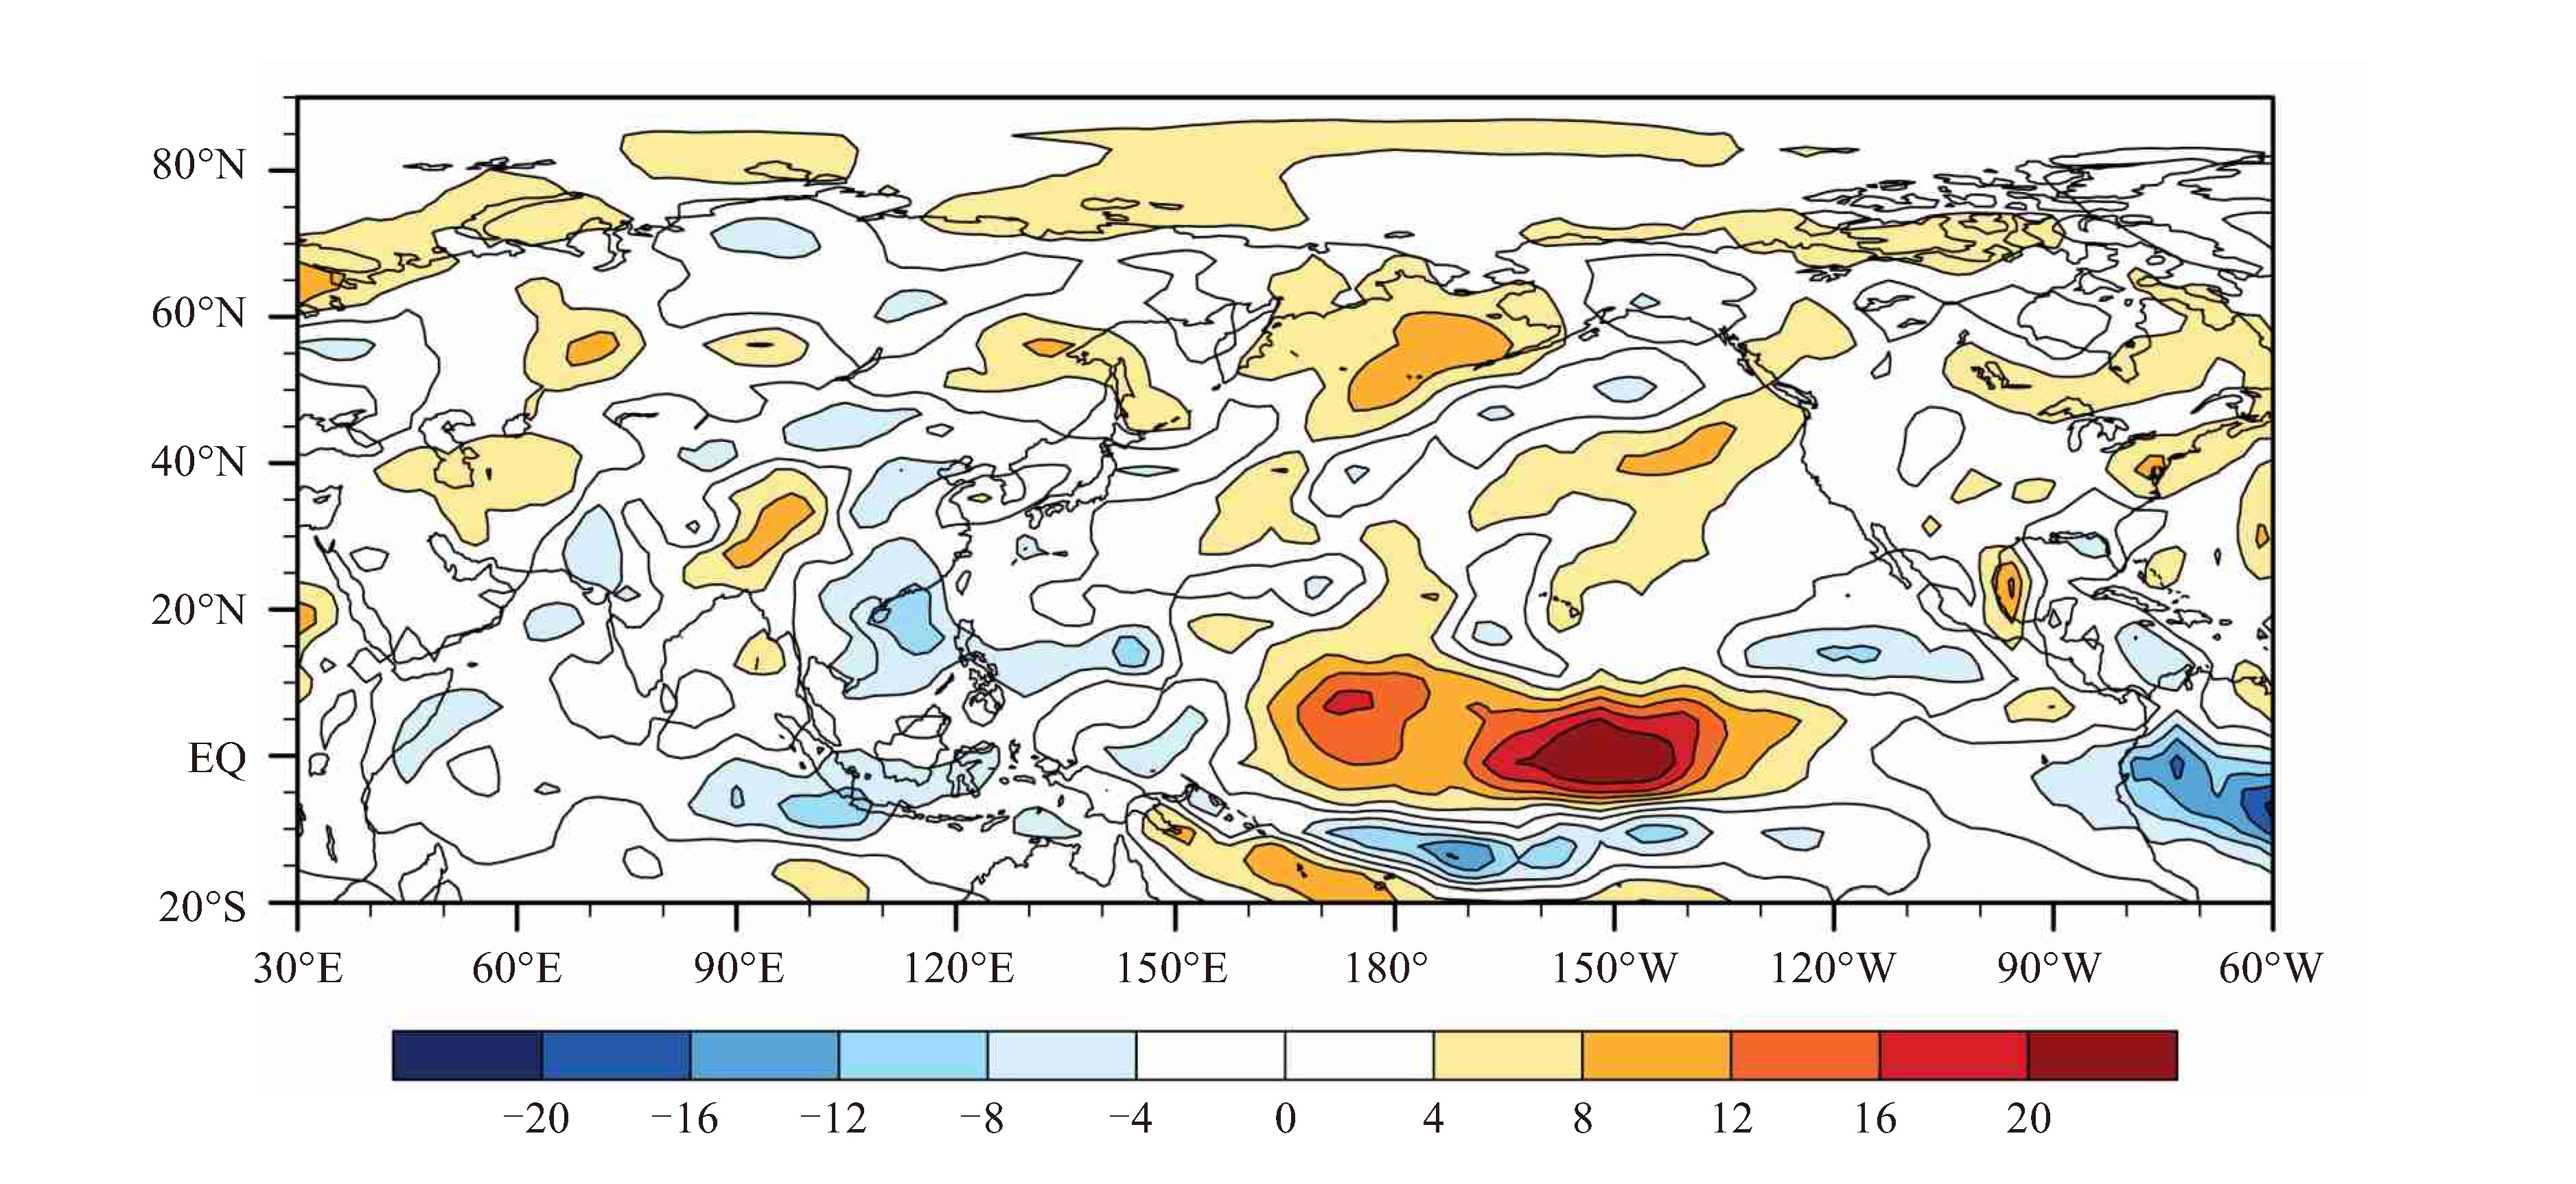
摘要: 利用1949—2021年中国气象局上海台风研究所热带气旋资料、NCEP/NCAR再分析资料、NOAA重构的海表温度资料(SST)和大气向外长波辐射(OLR)资料,采用线性趋势分析、Mann-Kendall检验等方法分析了近73年7—9月登陆华南热带气旋频数的变化特征。采用合成分析的方法研究7—9月登陆华南热带气旋频数异常与同期大气环流和海温的关系。结果表明,1949—2021年7—9月,登陆华南热带气旋有243个,年均3.3个,占全年登陆总数的70.2%。登陆华南热带气旋频数具有显著的年际和年代际变化特征。1973年最多(7个),1950年最少(0个);在1990年代中期由前期偏多转为后期偏少,但没有突变发生。近73年7—9月登陆华南热带气旋频数以0.1(10 a)-1的速率减少。7—9月登陆华南热带气旋频数异常与大气环流和海温异常密切相关,在异常多、少年同期:(1)大气环流差值场上,南亚高压偏强、偏东、偏北,副高偏西、偏北、偏强,110 °E以东的赤道东风引导气流偏强,季风槽加强,北半球中低纬海平面气压场东高西低,北高南低,同时南海、热带西太平洋对流活动加强。(2)海温差值场上,赤道中东太平洋偏冷,西太平洋暖池偏暖,沃克环流加强。高中低层大气环流和海温这种差异可能是导致登陆华南热带气旋频数异常的原因。Abstract: This study examined the variation characteristics of the frequency of tropical cyclones landing in South China from July to September over the 73 years from 1949 to 2021. Data employed included those from the Shanghai Typhoon Institute of the China Meteorological Administration, NCEP/NCAR reanalysis data, NOAA reconstructed sea surface temperature (SST) data, and atmospheric long-wave radiation (OLR) data. The variation characteristics of the frequency of tropical cyclones landing in South China from July to September in the past 73 years were analyzed by using methods such as linear trend analysis and Mann Kendall test. The relationship between the anomalous frequency of tropical cyclones landing in South China from July to September and the atmospheric circulation and early SST was analyzed by using synthesis and correlation methods. The results showed that a total of 243 tropical cyclones made landfall in South China between 1949 and 2021, with 70.2% occurring from July to September (averaging 3.3 cyclones per year). The frequency of tropical cyclones landing in South China exhibited significant interannual and interdecadal variations. The maximum frequency was found in 1973 (7 cyclones), while the minimum was observed in 1950 (0 cyclones). There was a shift from more in the early stages to less in the later stages in the mid-1990s, although no abrupt changes were observed. The frequency of tropical cyclones landing in South China has decreased at a rate of 0.1 cyclones per decade in these 73 years. The anomalous frequency of tropical cyclones landing in South China from July to September was closely related to atmospheric circulation and SST anomalies. During the same period in anomalous years, the following patterns were observed: (1) In the difference field of atmospheric circulation, the South Asia High was stronger and shifted eastward and northward, while the Subtropical High was stronger and shifted westward and northward. The easterly flow east of 110°E in the equatorial region intensified, along with a strengthened monsoon trough. The sea-level pressure field in the middle and low latitudes of the Northern Hemisphere showed an east-high, west-low pattern, with higher pressure in the north and lower pressure in the south. At the same time, convective activities in the South China Sea and the western Pacific in the thermal zone were strengthened. (2) In difference field the SST, the equatorial middle and eastern Pacific was cooler, the western Pacific warm pool was warmer, and the Walker circulation was strengthened. The difference in atmospheric circulation and SST in the upper, middle and lower levels may be the reason for the anomalous frequency of tropical cyclones landing in South China.
-
Key words:
- tropical cyclone frequency /
- atmospheric circulation /
- SST /
- South China
-

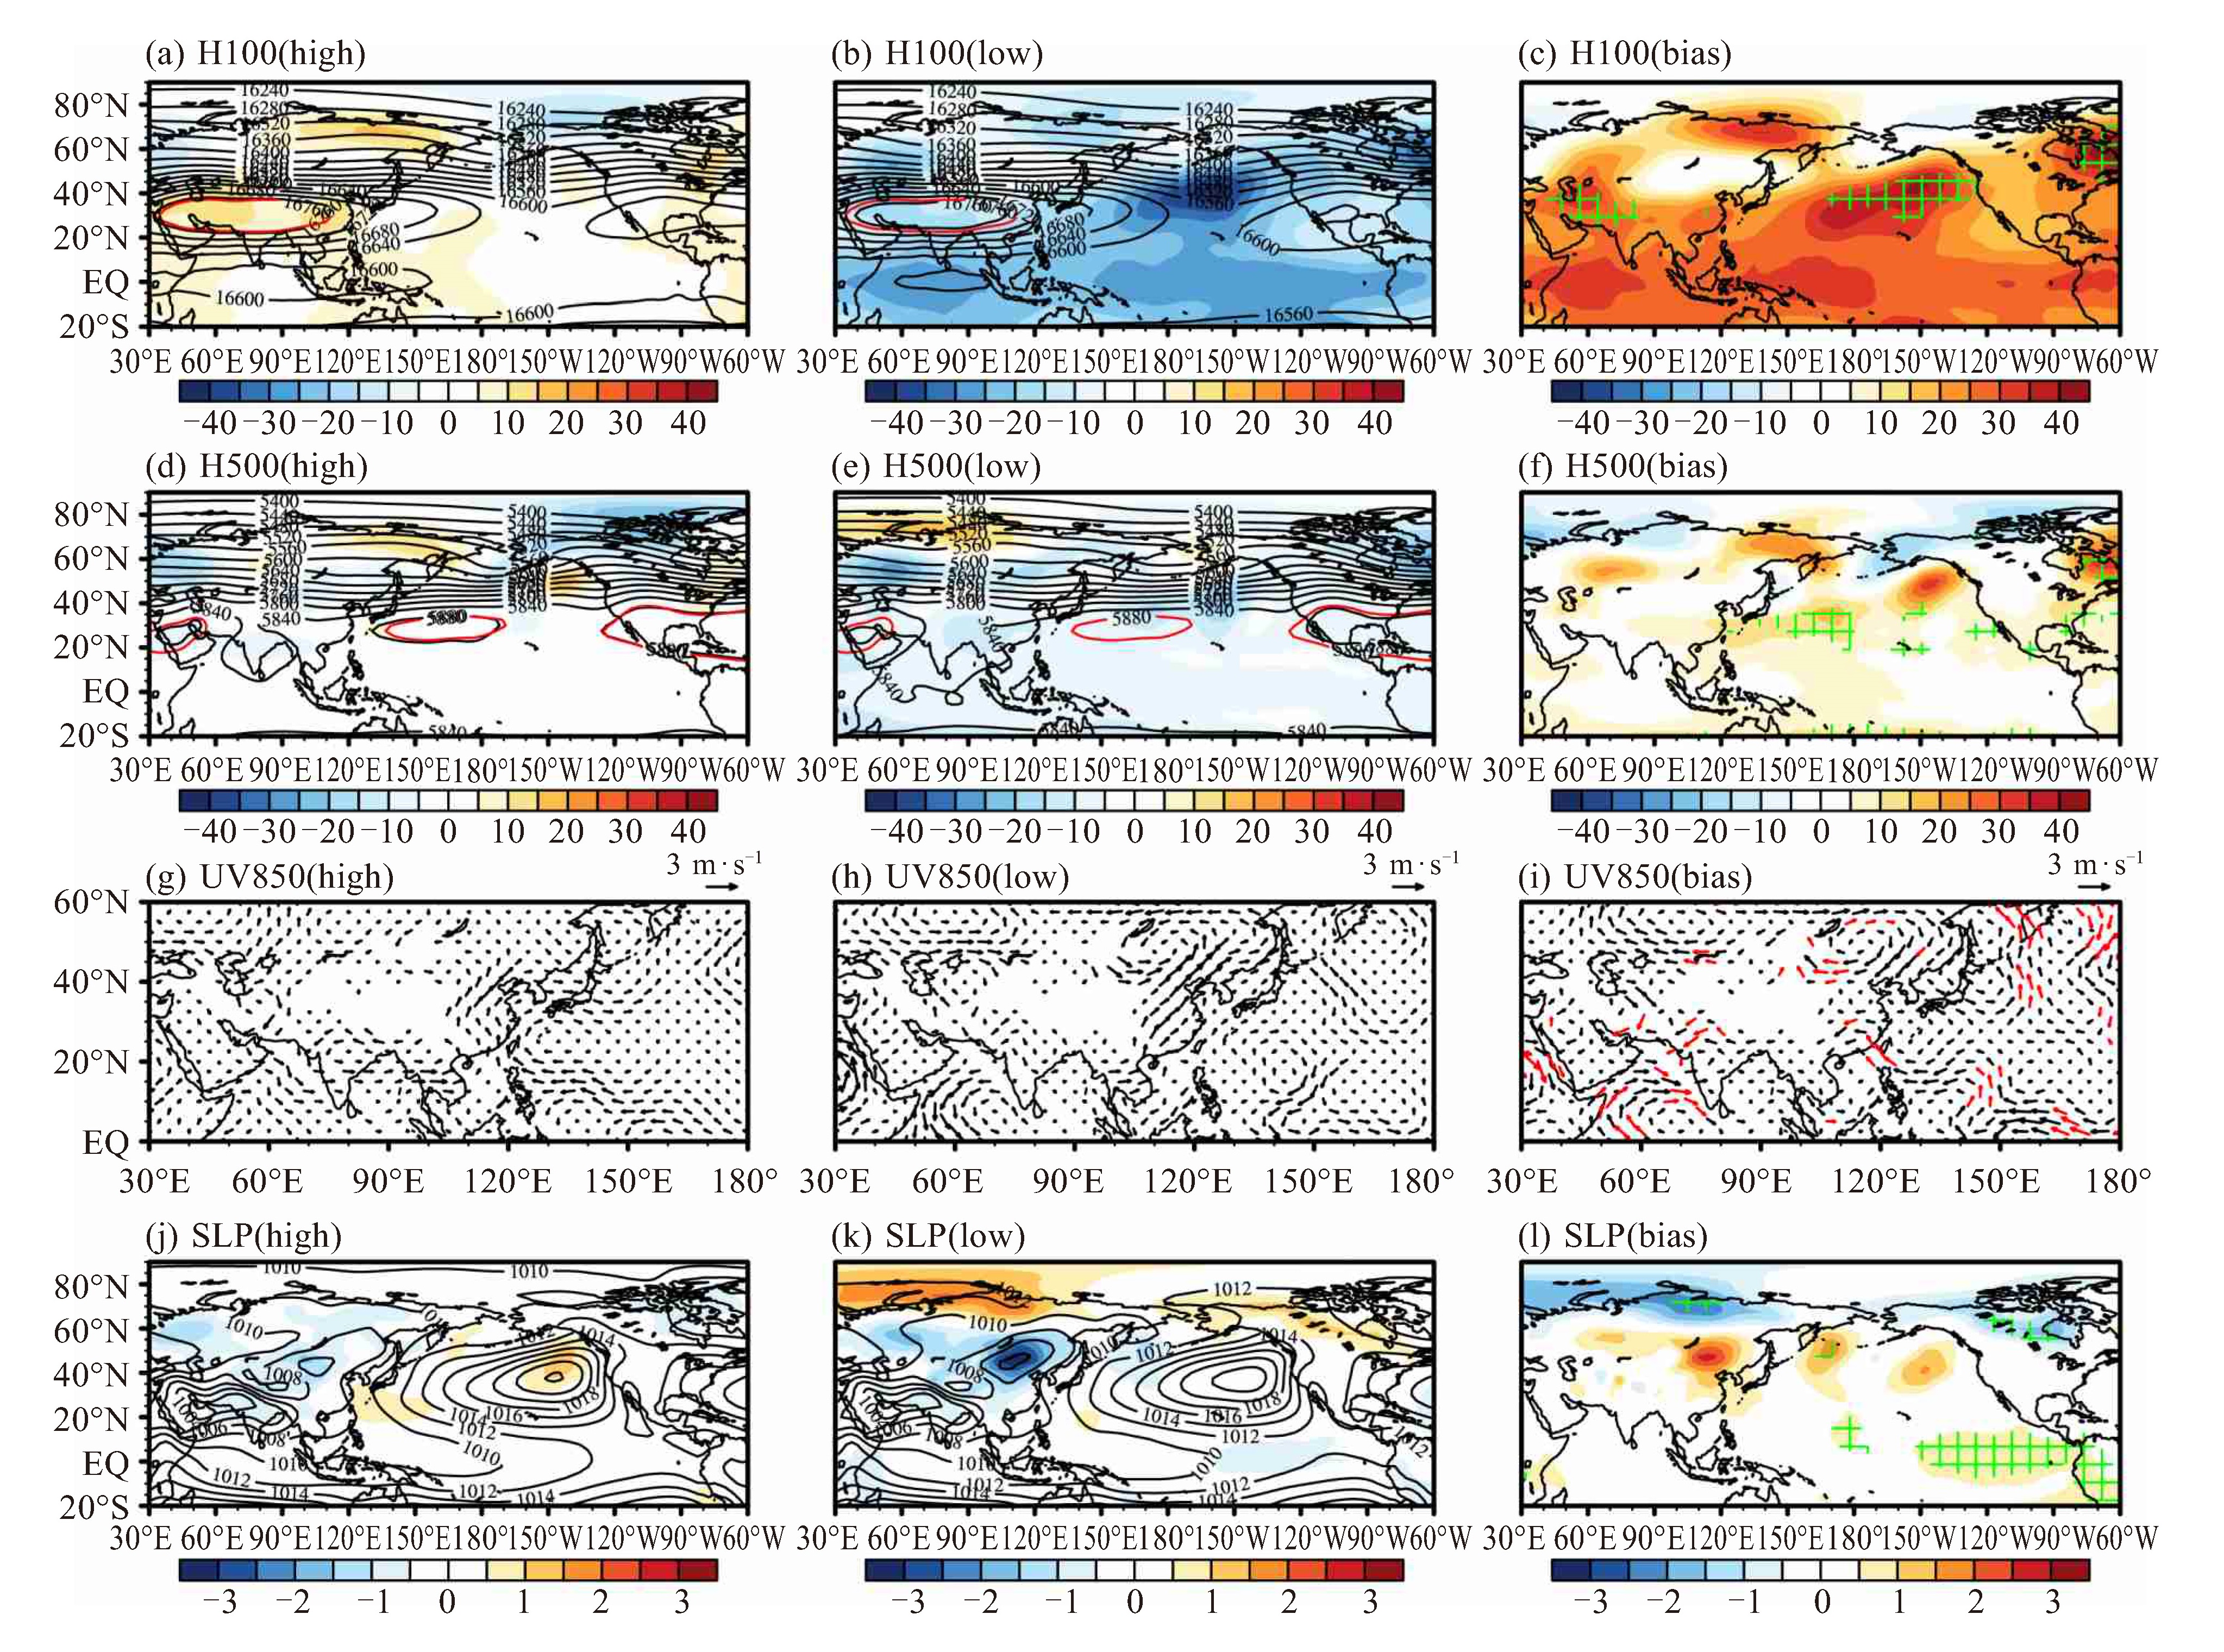
图 3 1949—2021年7—9月登陆华南热带气旋频数异常多年(左)、少年(中)同期大气环流场及距平场合成以及异常多、少年同期大气环流差值场合成(右)
(a)、(b)、(c) 为100 hPa位势高度场(单位:gpm),(d)、(e)、(f) 为500 hPa位势高度场(单位:gpm),(g)、(h)、(i) 为850 hPa距平风场(单位:m·s-1),(j)、(k)、(l)为海平面气压场(单位:hPa)。高度场上的阴影区代表高度距平,红线分别代表1949—2021年平均的100 hPa高度场上的1676等值线(代表南亚高压)和500 hPa高度场上的5880等值线(代表副高),850 hPa差值风场上的红色风向标、高度场和海平面气压差值场上的绿方格代表差值通过0.05显著性水平检验。
-
[1] 徐良炎, 高歌. 近50年台风变化特征及灾害年景评估[J]. 气象, 2005, 31(3): 41-45. [2] 杨瑞, 刘合香, 唐飞笼, 等. 1995—2016年登陆华南台风极端灾害特征的统计分析[J]. 广西师范学院学报(自然科学版), 2018, 35(2): 47-58. [3] 史丽, 张柳红, 伍红雨. 1994—2018年广东主要气象灾害特征分析[J]. 广东气象, 2021, 43(2): 54-57. [4] 李英, 陈联寿, 张胜军. 登陆我国热带气旋的统计特征[J]. 热带气象学报, 2004, 20(1): 14-23. [5] 黄荣辉, 皇甫静亮, 武亮, 等. 关于西北太平洋季风槽年际和年代际变异及其对热带气旋生成影响和机理的研究[J]. 热带气象学报, 2016, 32(6): 767-785. [6] 冯涛, 黄荣辉, 陈光华, 等. 近年来关于西北太平洋热带气旋和台风活动的气候学研究进展[J]. 大气科学, 2013, 37 (2): 364-382. [7] 王晓芳, 李红莉, 王金兰. 登陆我国热带气旋的气候特征[J]. 暴雨灾害, 2007, 26(3): 61-65. [8] 王小玲, 王咏梅, 任福民, 等. 影响中国的台风频数年代际变化趋势研究: 1951-2004年[J]. 气候变化研究进展, 2006, 2(3): 135-138. [9] 戴高菊, 文永仁, 李英. 西北太平洋热带气旋运动及其突变的若干统计特征[J]. 热带气象学报, 2014, 30(1): 23-33. [10] 吴泽铭, 张冬娜, 胡春迪, 等. 西北太平洋热带气旋频数及生成位置的气候变化研究进展[J]. 海洋气象学报, 2020, 40(4): 1-10. [11] 罗小莉, 姚才, 谭金凯. 登陆华南台风的频数及强度变化特征分析[J]. 海洋预报, 2018, 35(4): 58-67. [12] 赵秀兰. 近50年登陆我国热带气旋时空特征及对农业影响研究综述[J]. 海洋气象学报, 2019, 39(4): 1-11. [13] 张庆云, 彭京备. 夏季东亚环流年际和年代际变化对登陆中国台风的影响[J]. 大气科学, 2003, 27(1): 97-106. [14] 杨绮薇, 黄增明, 林爱兰. 华南登陆台风频数的变化及其与ENSO事件的关系[J]. 气象, 2007, 27(3): 11-16. [15] 刘舸, 张庆云, 孙淑清. 2005年夏季中国登陆台风的环流特征[J]. 大气科学, 2007, 31(5): 909-918. [16] 黄勇, 李崇银, 王颖. 西北太平洋热带气旋频数变化特征及其与海表温度关系的进一步研究[J]. 热带气象学报, 2009, 25(3): 273-285. [17] 申松林, 江静. 西北太平洋台风频数异常年的气候背景分析[J]. 气象, 2010, 36(5): 64-70. [18] 张春艳, 王力, 孙明明, 等. 2012年盛夏季我国多台风特征及环流背景初步分析[J]. 暴雨灾害, 2012, 31(4): 298-305. [19] 朱晶晶, 赵小平, 吴慧, 等. 2013年影响海南热带气旋异常偏多成因分析[J]. 气象科学, 2016, 36(2): 262-268. [20] 姚才, 罗小莉, 张成扬, 等. 7—9月登陆华南台风气候变化特征及大尺度环流系统分析[J]. 气象研究与应用, 2019, 40(1): 1-10. [21] 刘舸, 郑永光, 陶祖钰. 近50年(1949—1996)西北太平洋热带气旋气候特征的再分析[J]. 热带气象学报, 1999, 15(1): 10-16. [22] 周学鸣, 魏应植, 吴陈锋. 夏季西太平洋台风频数异常与ENSO事件的关系及大气环流异常特征[J]. 热带气象学报, 2006, 22 (1): 34-40. [23] 池艳珍, 何芬, 唐振飞. 2016年登陆和影响福建台风成因分析及预测[J]. 气象, 2017, 43(10): 1 287-1 295. [24] 中华人民共和国国家质量监督检验检疫总局, 中国标准化管理委员会. 热带气旋等级(GB/T 19201—2006)[S]. 北京: 中国标准出版社, 2006: 1-3. [25] LUX Q, YU H, YING M, et al. Western North Pacific tropical cyclone database created by the China Meteorological Administration[J]. Adv Atmos Sci, 2021, 38(4): 690-699. [26] KALNAY E, KANAMITSU M, KISTLER R, et al. The NCEP/NCAR 40 year reanalysis project[J]. Bull Amer Meteor Soc, 1996, 77(3): 437-471. [27] 魏凤英. 现代气候统计诊断预测技术[M]. 北京: 气象出版社(第二版), 2007: 23-71. [28] 李德琳, 肖子牛, 周秀华, 等. 西北太平洋热带气旋生成数在1990年代中期发生突变的气候环境特征分析[J]. 热带气象学报, 2015, 31 (3): 323-332. [29] XIE S P, HU K M, HAFNER J, et al. Indian Ocean capacitor effect on Indo-Western Pacific climate during the summer following El Niño [J]. J Climate, 2009, 22: 730-747. [30] WANG L, HUANG R H. WU R G. Interdecadal variability in tropical cyclones over the South China Sea and its association with the Indian Ocean sea surface temperature[J]. Geophys Res Lett, 2013, 40(4): 768-771. [31] 陈联寿, 徐祥德, 罗哲贤, 等. 热带气旋动力学引论[M]. 北京: 气象出版社, 2002. [32] FENG T, CHEN G H, HUANG R H, et al. Large-scale circulation patterns favorable to tropical cyclogenesis over the western North Pacific and associated barotropic energy conversion[J]. Int J Climatol, 2014. 34(1): 216-227. [33] 廖玉芳, 张剑明, 郭凌曜. 1951—2017年热带气旋对湖南降水的影响及环流异常特征分析[J]. 气象与环境学报, 2020, 36(2): 41-48. [34] WU L G, WANG B, BRAUN S A. Impacts of air-sea interaction on tropical cyclone track and intensity[J]. Mon Wea Rev, 2005, 133: 3 299-3 314. [35] 黄荣辉, 陈光华. 西北太平洋热带气旋移动路径的年际变化及其机理研究[J]. 气象学报, 2007, 65(5): 683-694. [36] HUANG G. An index measuring the interannual variation of the East Asian summer monsoon-The EAP index[J]. Adv Atmos Sci, 2004, 21 (1): 41-52. [37] 陆晓婕, 董昌明, 李刚. 1951—2015年进入东海的台风频数及登陆点的变化[J]. 大气科学学报, 2018, 41(4): 433-440. [38] 高晓梅, 江静, 刘畅, 等. 近67 a影响山东台风频数的变化特征及其与若干气候因子的关系[J]. 气象科学, 2018, 38(6) : 749-758. [39] 罗小莉, 姚才, 肖志祥, 等. 近60年来登陆华南热带气旋降水的气候变化特征及其成因[J]. 海洋预报, 2020, 37(4): 58-67. -

 下载:
下载:
 点击查看大图
图(5)
计量
- 文章访问数: 411
- HTML全文浏览量: 114
- PDF下载量: 66
- 被引次数: 0
 粤公网安备 4401069904700003号