


Anomaly-based Weather Map Post-processing System Based on Numerical Weather Precliction Model Products in Guangdong
-
摘要: 数值预报模式产品已成为当前各地气象台短期天气预报中的重要参考信息。我国各级气象台站都建立了多模式产品的一体化显示平台。但是,业务化平台上绘制的仍然是传统天气图。近十年来,为了更方便预报员客观地从中识别各种类极端天气,北京大学发展的基于欧洲中心全球模式产品的扰动天气图制作方法已经应用于对国内外多种类极端天气的大量个例分析,得到了国内外同行的认可。在前期工作的基础上,新近发展了基于广东区域模式(CMA-GD)产品的扰动天气图绘制系统。但是,与欧洲全球模式相比广东区域模式具有完全独立的非静力平衡状态偏差特征,并且不同模式系统之间的系统偏差也不一致,因此提出了一套生成区域模式自有扰动天气分析数据的基本方案,以减小模式系统性误差和气候漂移造成的虚假天气扰动信息,更有效地展现模式中的扰动天气系统特征细节。针对该系统网页端输出结果,实际应用台风个例介绍区域模式扰动天气图分析、使用方法。结果表明:相比于欧洲中心全球模式产品生成的扰动天气图,基于本地化模式数据生成的扰动天气图能够展示更多区域模式独有的物理量非静力特征时空特征。希望能帮助读者认识扰动法并熟悉扰动天气图在日常天气预报业务和天气过程复盘总结中的应用。Abstract: Multi-model numerical products have become the primary information source in short-term weather forecasting. To extract information on different types of weather systems, the anomaly-based weather map post-processing system based on the European Center global model product has been developed by Peking University. In this study, the anomaly-based weather map post-processing system was implemented in the Guangdong Regional Model (CMA-GD) product. Given that the CMA-GD model is non-hydrostatic and may have certain systematic biases, we proposed a basic scheme that better estimates the weather anomaly signals from the regional model forecast data. This paper details the localized anomaly-based weather map post-processing system, and demonstrates an example of tropical cyclone forecast based on the system outputs. The results show that the anomalous weather map generated based on the localized system can show finer spatio-temporal characteristics, especially the non-hydrostatic features. The presented system can help forecasters understand the anomaly-based weather analysis approach and be familiar with its application in daily weather forecast operations and weather process review summaries.
-
Key words:
- Guangdong model products /
- anomaly weather map /
- post-processing system /
- CMA-GD /
- CMA-TRAMS
-

图 1 2022年10月31日20:00瞬变气候场总位势高度场对比(等值线,单位:10 gpm)和总温度(阴影,单位:℃) 的垂直剖面
a. ERA5资料集生成;b. 本地CMA-TRAMS资料生成。

图 2 各等压面瞬时气候态场
a、c、e为ERA5资料集生成,b、d、f为本地CMA-TRAMS资料生成。a、b为850 hPa高度瞬时气候态场(等值线,单位:10 gpm)和温度瞬时气候态场(阴影,单位:℃)的平面分布;c、d为300 hP高度,温度瞬时气候态场平面分布;e、f为850 hPa层的风瞬时气候态场(m·s-1)和比湿场(阴影,单位:g·kg-1)的平面分布。

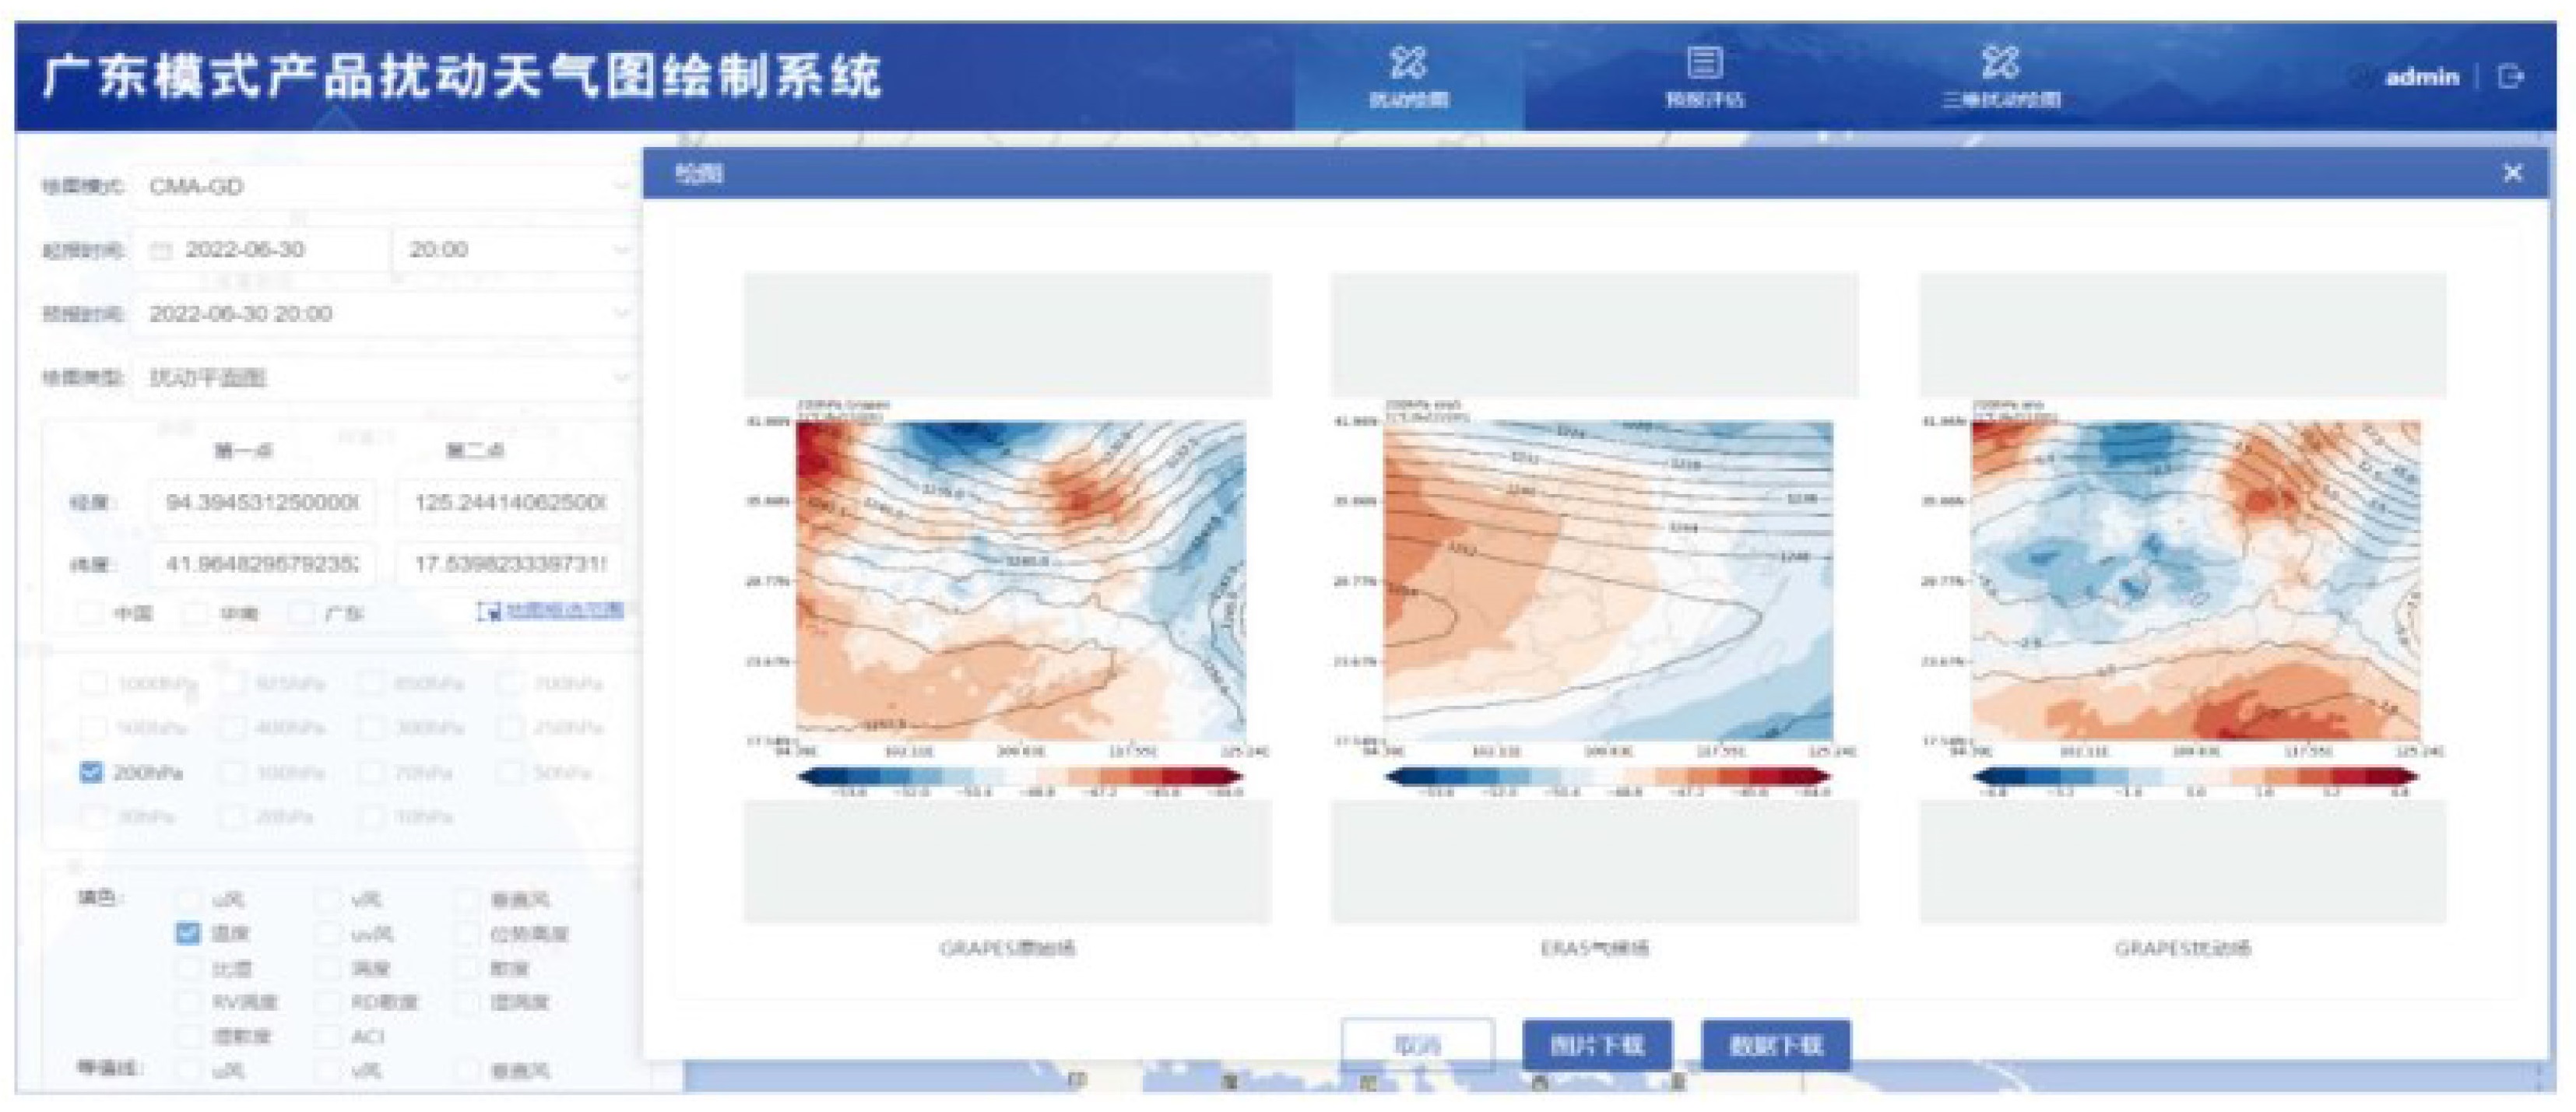
图 4 2022年6月30日20:00时200 hPa层平面图的总位势高度(等值线,单位:10 gpm)和总温度(阴影,单位:℃)(左),瞬变气候位势高度(等值线,单位:10 gpm)和气候温度(阴影,单位:℃)(中),扰动位势高度(等值线,单位:10 gpm)和扰动温度(阴影,单位:℃)(右)

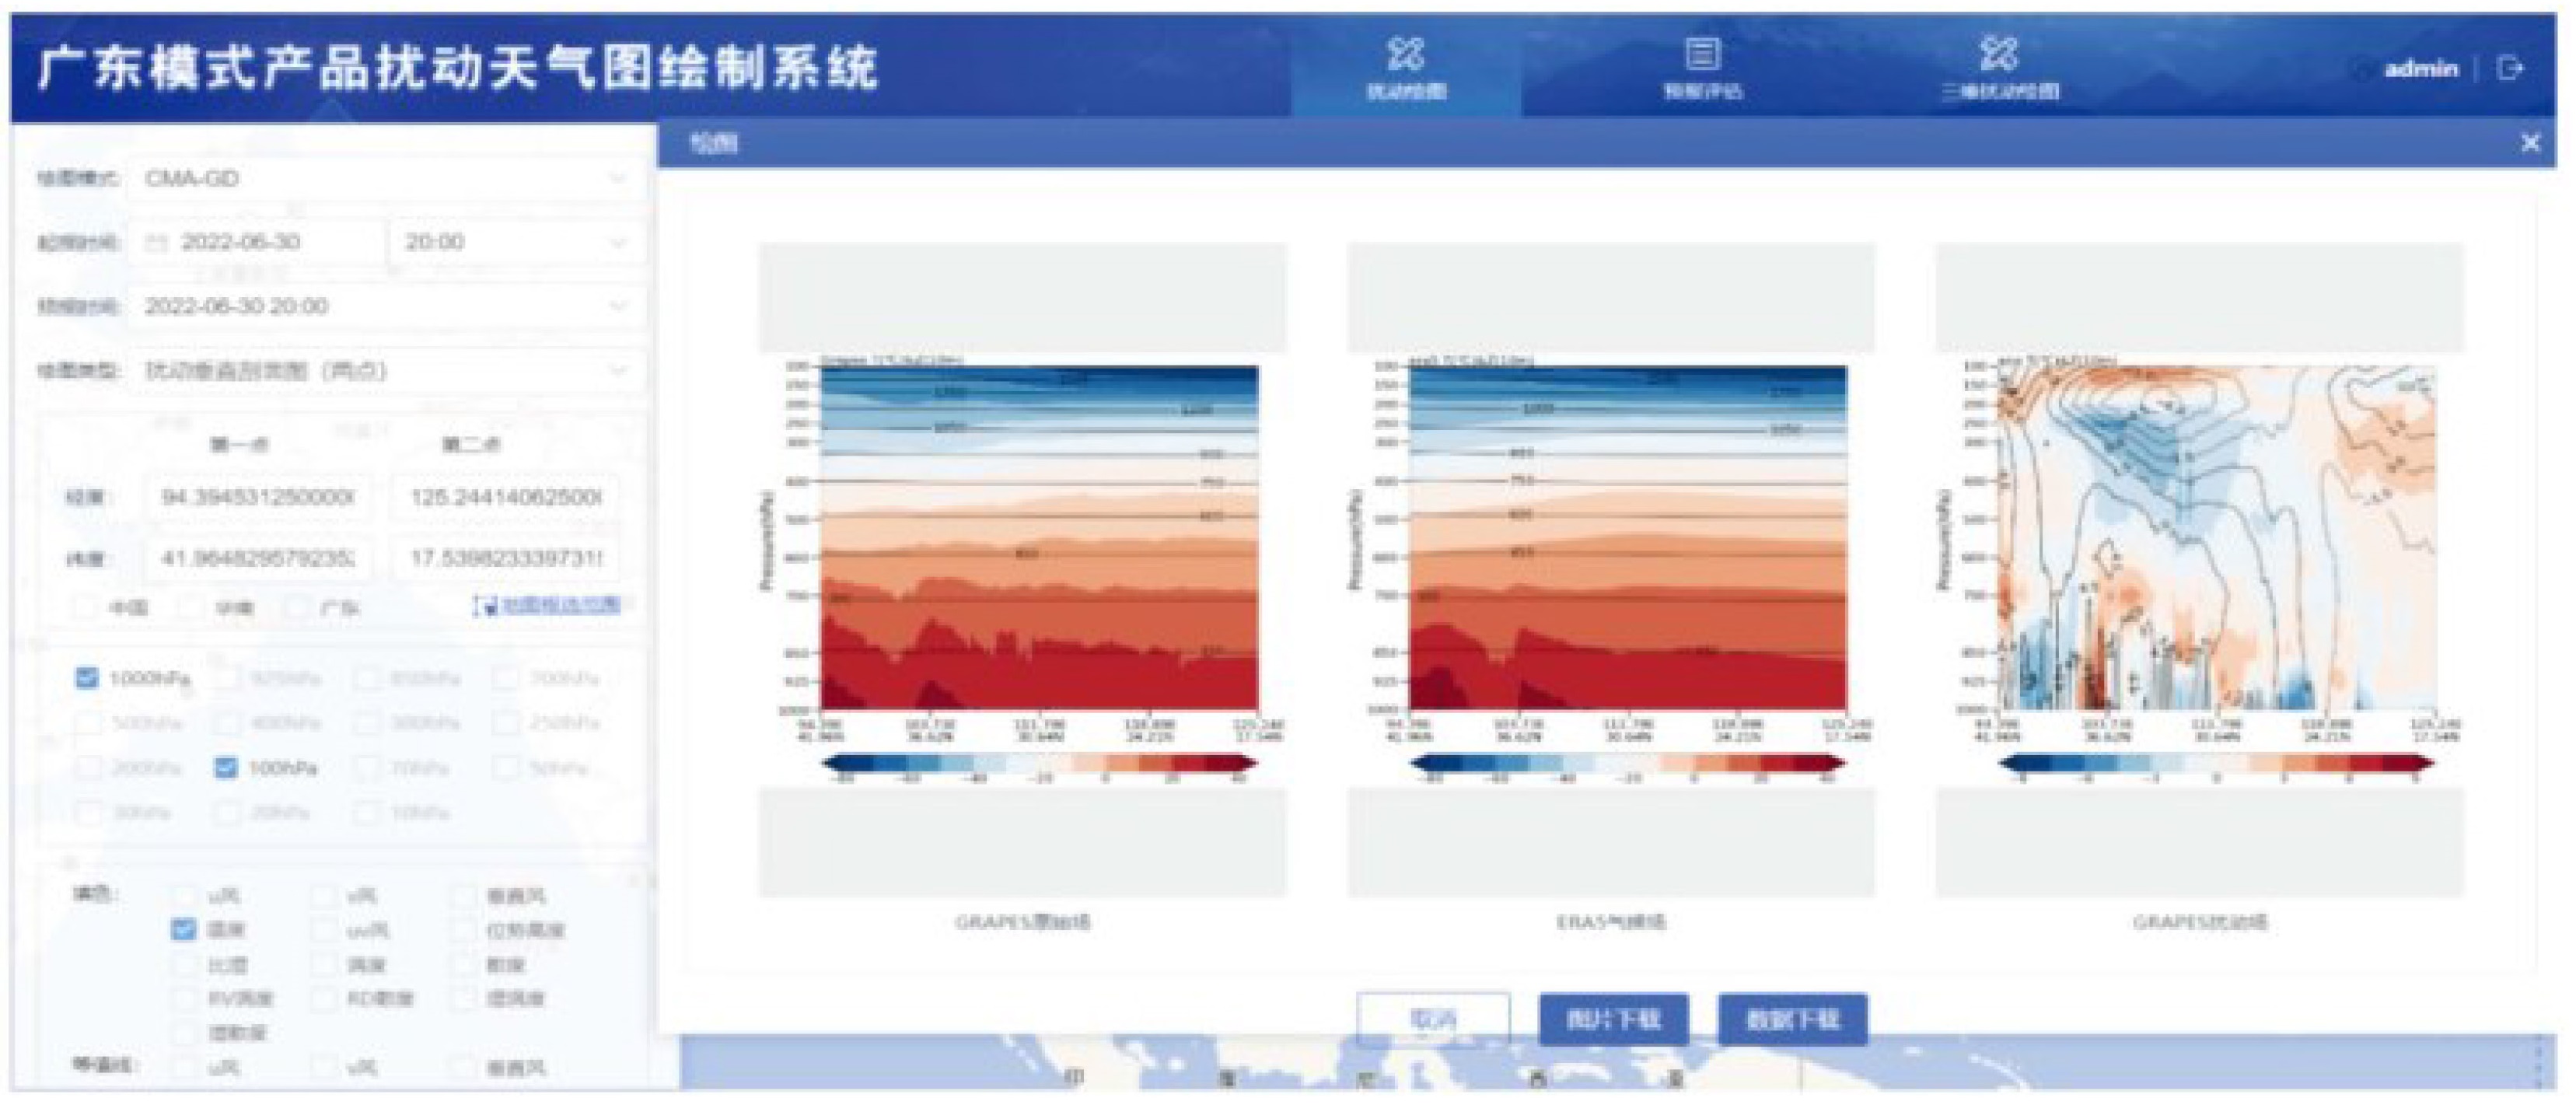
图 5 2022年6月30日20:00时经过两个经纬度点的垂直剖面图的总位势高度(等值线,单位:10 gpm) 和总温度(阴影,单位:℃)(左),瞬变气候位势高度(等值线,单位:10 gpm)和气候温度(阴影,单位:℃)(中),扰动位势高度(等值线,单位:10 gpm)和扰动温度(阴影,单位:℃)(右)

图 6 2022年6月30日20:00时经过两个经纬度点的垂直剖面图的总温度(阴影,单位:℃)和总风(m·s-1)(左),瞬变气候温度(阴影,单位:℃)和气候风(m·s-1)(中),扰动温度(阴影,单位:℃)和扰动风(m·s-1)(右)

图 7 2022年10月30日20时起报24小时得到31日20时的预报场
a. TRAMS模式预报实际总位势高度(等值线,单位:10 gpm)和总温度(阴影,单位:℃)的垂直剖面;b. 由ERA5数据分析的高度扰动(等值线,单位:10 gpm)和温度扰动(阴影,单位:℃)的垂直剖面;c. 由TRAMS数据分析的高度扰动(等值线,单位:10 gpm)和温度扰动。

图 8 2022年10月30日20时起报24小时得到31日20时的预报场
850 hPa由ERA5气候场数据分析(a) 和由TRAMS气候场数据分析(b)的扰动位势高度(等值线,单位:10 gpm)和扰动温度(阴影,单位:℃)的平面分布;c、d同a、b但为300 hPa分布;850 hPa层由ERA5气候场数据分析(e)和由TRAMS气候场数据分析(f)的风扰动(m·s-1)和比湿扰动(阴影,单位:g·kg-1)的平面分布;由ERA5气候场数据分析(g)和由TRAMS气候场数据分析(h)的u风扰动(m·s-1)和湿涡度异常(阴影,单位:10-7 kg·kg-1·s-1)的垂直分布

图 9 同图 8,但为48小时预报得到11月1日20时扰动形势
a、b为高度扰动(等值线,单位:10 gpm)和温度扰动(阴影,单位:℃)的垂直剖面;c、d为南北风扰动分量(等值线,m·s-1)和比湿扰动(阴影,单位:g·kg-1)的垂直剖面;e、f为300 hPa扰动位势高度(等值线,单位:10 gpm)和扰动温度(阴影,单位:℃)的平面分布;g、h为850 hPa扰动风(m·s-1)和湿涡度扰动(阴影,单位:10-7 kg·kg-1·s-1)的平面分布。

图 10 同图 8,但为72小时预报得到11月2日20时扰动形势
a、b为高度扰动(等值线,单位:10 gpm)和温度扰动(阴影,单位:℃)的垂直剖面;c、d为南北风扰动分量(等值线,m·s-1)和比湿扰动(阴影,单位:g·kg-1)的垂直剖面;e、f为850 hPa和g、h为300 hPa的扰动位势高度(等值线,单位:10 gpm)和扰动温度(阴影,单位:℃)的平面分布。
-
[1] QIAN W. Temporal climatology and anomalous weather analysis[M]. Singapore: Springer, 2017: 40-82. [2] QIAN W, DU J. Anomaly format of atmospheric governing equations with climate as a reference atmosphere[J]. Meteorology, 2022, 1(2): 127-141. [3] 钱维宏. 真实世界: 宇宙和地球大气中的结构与扰动[M]. 南京: 江苏凤凰科学技术出版社, 2020: 63-70. [4] QIAN W, DU J, AI Y. A review: Anomaly-based versus full-field-based weather analysis and forecasting[J]. Bull Amer Meteor Soc, 2021, 102(4): E849-E870. [5] 杜钧, 钱维宏. 天气预报的三次跃进[J]. 气象科技进展, 2014, 4(6): 13-26. [6] CHEN Y, HU Q, QIAN W, et al. Anomaly based analysis of extreme heat waves in eastern China during 1981—2013[J]. Int J Climatol, 2017, 37(1): 509-523. [7] 钱维宏, 张宗婕. 南方持续低温冻雨事件预测的前期信号[J]. 地球物理学报, 2012(5): 1 501-1 512. [8] QIAN W, YU T, DU J. A unified approach to trace surface heat and cold events by using height anomaly[J]. Climate Dyn, 2015(46): 1 647- 1 664. [9] QIAN W, JIANG N, DU J. Anomaly-based weather analysis versus traditional total-field-based weather analysis for depicting regional heavy rain events[J]. Wea Forecasting, 2016, 31(1): 71-93. [10] 钱维宏, 张宗捷. 西南区域持续性干旱事件的行星尺度和天气尺度扰动信号[J]. 地球物理学报, 2012, 55(5): 1 462-1 471. [11] QIAN W, LEUNG, DU J, et al. An index of anomalous convective instability to detect tornadic and hail storms[J]. Meteo Atmos Phys, 2019, 131(1): 351-373. [12] 钱维宏, 艾阳, 陈笑晨. 辽宁开原龙卷强对流过程的扰动天气环境[J]. 地球物理学报, 2021, 64(5): 1 531-1 541. [13] QIAN W, LEUNG JCH, CHEN Y L, et al. Applying anomaly-based weather analysis to the prediction of low visibility associated with the coastal fog at Ningbo-Zhoushan Port in East China[J]. Adv Atmos Sci, 2019, 36(10): 1 060-1 077. [14] QIAN W, HUANG J. Applying the anomaly-based weather analysis on Beijing severe haze episodes[J]. Science of the Total Environment, 2019, 647(1): 878-887. [15] QIAN W, XU M, AI Y. Anomaly-based synoptic analysis to identify and predict meteorological conditions of strong ozone events in North China[J]. Air Qual Atmos Health, 2022, 15(1): 1 699-1 711. [16] QIAN W, AI Y, YU J, et al. Opposite anomalous synoptic patterns for potential California large wildfire spread and extinguishing in 2018 cases[J]. Atmos Res, 2021, 262(11): 105804. [17] 徐道生, 陈子通, 张艳霞, 等. 南海台风模式TRAMS 3.0的技术更新和评估结果[J]. 气象, 2020, 46(11): 1 474-1 484. [18] LI H, XU D, ZHANG B. Implementation of the Incremental Analysis Update Initialization Scheme in the Tropical Regional Atmospheric Modeling System under the Replay Configuration[J]. J Meteor Res, 2021, 35(1): 198-208. [19] 符睿, 张诚忠, 张万诚, 等. C波段雷达反射率因子在CMA-GD模式中的应用[J]. 热带气象学报, 2022, 38(5): 631-640. [20] 尹金方, 黄洁, 史永强, 等. Nudging地面加密观测改进数值模式对城市效应及其触发对流的模拟: 一次夜间个例试验[J]. 热带气象学报, 2022, 38(3): 331-342. [21] 李婷苑, 吴乃庚, 邓雪娇, 等. 华南区域大气成分数值模式GRACEs预报性能评估[J]. 热带气象学报, 2021, 37(2): 207-217. [22] QIAN, W, SHAN X, LIANG H, et al. A generalized beta advection model to improve unusual typhoon track prediction by decomposing total flow into climatic and anomalous flows[J]. Geophys Res Atmos, 2014, 119(3): 1 097-1 117. [23] QIAN W, HUANG J, DU J. Examination of Hurricane Sandy's (2012) structure and intensity evolution from full-field and anomaly-field analyses[J]. Tellus A: Dynamic Meteorology and Oceanography, 2016, 68(1): 29029. [24] QIAN W, DU J, SHAN X, et al. Incorporating the effects of moisture into a dynamical parameter: Moist vorticity and moist divergence[J]. Wea Forecasting, 2015, 30(6): 1 411-1 428. -

 下载:
下载:


 点击查看大图

计量
- 文章访问数: 430
- HTML全文浏览量: 52
- PDF下载量: 30
- 被引次数: 0
 粤公网安备 4401069904700003号