


Characteristics of Cluster High-Temperature Processes in the Beijing-Tianjin-Hebei Region Since 1980
-
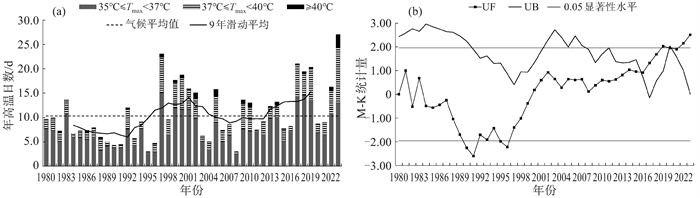
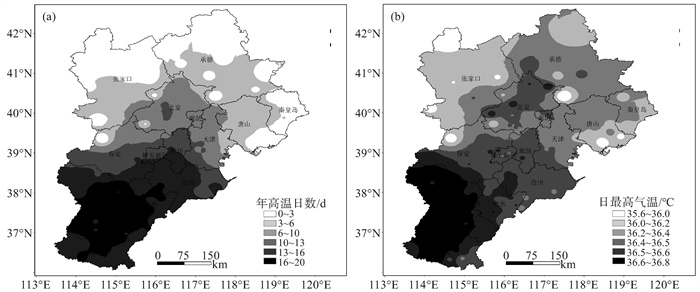
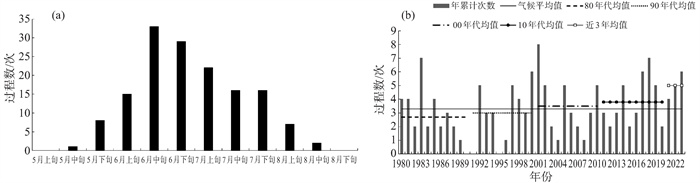
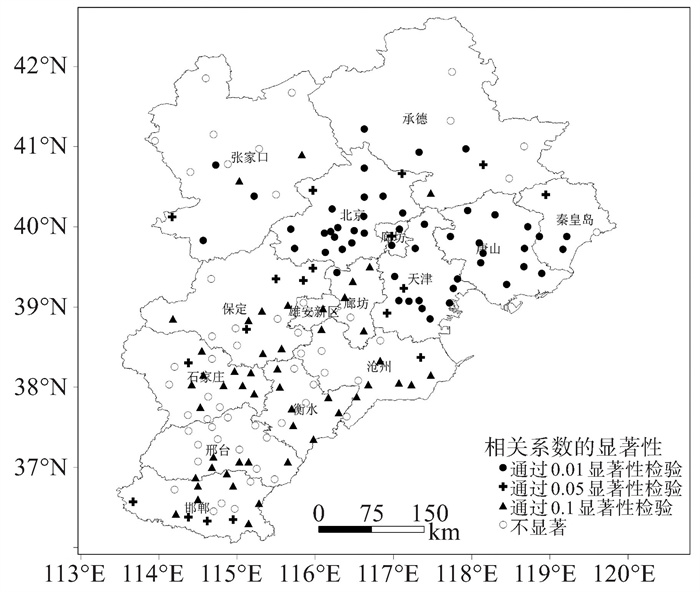
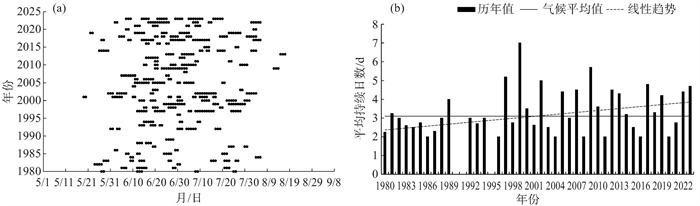
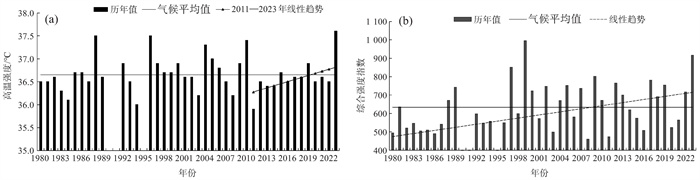
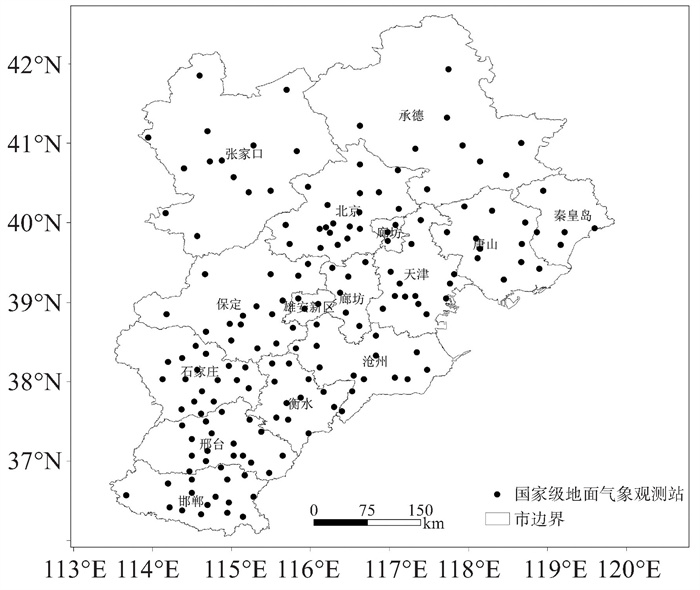
摘要: 利用1980—2023年京津冀地区174个气象站的逐日最高气温资料,分析高温天气的时空变化特征,确定出群发性高温过程的判识标准并进行分析,结果得到京津冀地区多年平均年高温日数为10.8 d,整体呈显著增多趋势,气候倾向率为1.9 d ·(10 a)-1,时间上表现出“减-增-减-增”的年代际变化,空间上呈南多(强)北少(弱)的分布特征。1980年以来,京津冀地区共出现149次群发性高温过程,主要分布在5—8月,各旬出现次数呈单峰式分布,其中6月中旬最多;群发性高温过程的平均持续日数、最大影响范围和综合强度在44年间均呈显著增加趋势,而发生频次和平均温度强度则在21世纪10年代之后表现出显著增多(强)趋势。44年来京津冀地区综合强度最强的10次群发性高温过程有7次出现在21世纪,其中4次出现在2009年之后,日最高气温的最大值大都出现在河北石家庄地区。空间上,无论在任何年代群发性高温过程所覆盖的范围都主要位于河北中南部地区,其中石家庄东南部和邢台北部是过程高发区的中心地带;20世纪80年代—21世纪10年代,群发性高温过程的高发区不断向北、向东扩展,其中北京中南部、承德南部、天津、唐山大部和秦皇岛西部受群发性高温过程的影响频次存在成倍增加现象,相较其他区域,上述地区高温过程的出现频次表现出更显著的增加趋势。Abstract: Based on the daily maximum temperature data from 174 meteorological stations in the BeijingTianjin-Hebei region from 1980 to 2023, the present study analyzed the spatial and temporal variations of high-temperature processes. The term cluster high-temperature process (CHTP) was also introduced to further understand these extreme weather events. The results revealed that the average number of hightemperature days per year in the region stood at 10.8, exhibiting a notable upward trend with a climate tendency rate of 1.9 days per decade. Temporally, the pattern of high-temperature days followed a decadelong cycle of"decrease-increase-decrease-increase", while spatially, the southern regions experienced more frequent and intense heatwaves compared to the northern ones. During the period from 1980 to 2023, a total of 149 CHTPs were recorded in the Beijing-Tianjin-Hebei region, predominantly occurring between May and August. The frequency of these events peaked in mid-June, exhibiting a unimodal distribution. Notably, the average duration, maximum extent of impact, and overall intensity of CHTPs have shown a significant increase over the years, with a particularly sharp rise in frequency and average intensity since 2010. In the past 44 years, seven of the ten strongest CHTPs appeared in the 21st century, and four occurred after 2009; the extreme daily maximum temperature mostly appeared in Shijiazhuang. Spatially, the majority of CHTP occurrences were centered in the central and southern parts of Hebei Province, with Shijiazhuang's southeastern region and Xingtai's northern area identified as high-incidence centers. Over the decades, these high-incidence areas have gradually expanded northward and eastward. Central and southern Beijing, southern Chengde, Tianjin, most of Tangshan, and western Qinhuangdao have witnessed an exponential rise in CHTP frequency, exhibiting a more pronounced increase compared to other regions.
-

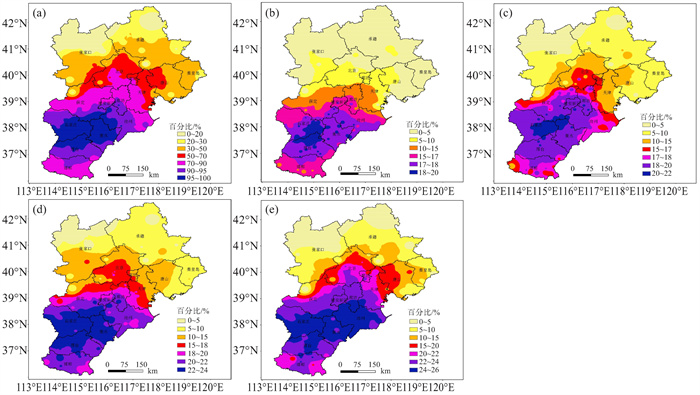
图 7 1980—2023年(a)、20世纪80年代(b)、20世纪90年代(c)、21世纪00年代(d)、21世纪10年代(e) 各站出现群发性高温过程的次数占总过程数的百分比分布
表 1 不同年代年高温日数的气候倾向率及相关系数
年代 20世纪80年代 20世纪90年代 21世纪00年代 21世纪10年代 21世纪10年代之后(2011—2023年) 气候倾向率/(d·(10 a)-1) -6.1 14.0 -3.0 9.0 8.9 线性相关系数 -0.698** 0.614** -0.190 0.495* 0.545* 注:**表示通过0.05显著性水平检验;*表示通过0.1显著性水平检验。  下载: 导出CSV
表 2 1980—2023年京津冀地区综合强度最强的10次群发性高温过程特征
综合强度排位 起止日期 持续天数 平均影响范围 平均最高气温/℃ 35≤Tmax < 37站次比/ % 35≤Tmax < 37平均日数/d 37≤Tmax < 40站次比/ % 37≤Tmax < 40平均日数/d Tmax≥40站次比/ % Tmax≥40平均日数/d 最大日最高气温/℃(地点、时间) 1 2009年6月23日—7月4日 12 105.7 37.6 94.8 3.2 84.5 4.1 43.1 1.8 44.4(沙河、2009年6月25日) 2 1997年7月8—16日 9 131.0 37.2 95.5 3.3 87.9 4.1 8.0 1.1 40.7(献县、1997年7月12日) 3 1999年6月24日—7月3日 10 111.2 36.9 94.3 4.0 84.5 2.7 25.3 1.2 41.1(献县、1999年7月2日) 4 2002年7月8—17日 10 107.0 37.5 93.7 3.5 86.2 2.0 70.7 1.6 43.4(赞皇、2002年7月15日) 5 2022年6月17—26日 10 99.4 38.0 83.3 2.1 79.3 4.0 57.5 1.3 44.2(灵寿、2022年6月25日) 6 1999年7月23—30日 8 129.9 37.0 95.6 3.2 87.4 3.0 19.5 1.0 42.2(丰台、1999年7月24日) 7 2023年7月5—11日 7 134.7 38.5 71.8 1.5 86.8 3.6 52.3 2.2 43.7(平山、2023年7月6日) 8 2017年7月7—14日 8 119.6 37.3 76.4 3.2 67.2 4.3 11.5 1.7 41.6(藁城、2017年7月11日) 9 2010年7月2—8日 7 116.0 37.8 86.2 2.0 90.8 2.7 45.4 1.2 42.3(任泽、2010年7月6日) 10 2005年6月19—24日 6 122.3 38.4 75.3 1.7 79.3 2.1 51.5 2.4 42.8(永年、2005年6月22日)
下载: 导出CSV
-
[1] 梁雅楠. 京津冀极端高温和降水事件的变化特征及未来气候情景预估[D]. 北京: 北京建筑大学, 2023. [2] 司丽丽, 邵琪, 赵亮, 等. 基于高密度气象站的订正与日极端降水量精细化研究[J]. 自然灾害学报, 2023, 32(3): 145-158. [3] CAPUTI N, KANGAS M, DENHAM A, et al. Management adaptation of invertebrate fisheries to an extreme marine heat wave event at a global warming hot spot[J]. Ecol Evol, 2016, 6(11): 3 583-3 593. [4] LEE W K, LEE H A, LIM Y H, et al. Added effect of heat wave on mortality in Seoul, Korea[J]. Int J Biometeor, 2016, 60(5): 1-8. [5] 张宁, 常清, 尹红, 等. 山西省夏季极端高温的时空变化及特征分析[J]. 自然灾害学报, 2022, 31(4): 116-124. [6] SOUSA P M, BARRIOPEDRO D, GARICIA H, et al. Distinct influences if large-scale circulation and regional feedbacks in two exceptional 2019 Europen heat-waves[J]. Commun Earth Environ, 2020(1): 48-57. [7] 范进进, 秦鹏程, 史瑞琴, 等. 气候变化背景下湖北省高温干旱复合灾害变化特征[J]. 干旱气象, 2022, 40(5): 780-790. [8] 史印山, 谷永利, 林艳. 京津冀高温天气的时空分布及环流特征分析[J]. 气象, 2009, 35(6): 63-69. [9] 张尚印, 宋艳玲, 张德宽, 等. 华北主要城市夏季高温气候特征及评估方法[J]. 地理学报, 2004, 59(3): 383-390. [10] 施洪波. 华北地区高温日数的气候特征及变化规律[J]. 地理科学, 2012, 32(7): 866-871. [11] 张迎新, 张守保. 2009年华北平原大范围持续性高温过程的成因分析[J]. 气象, 2010, 36(10): 8-13. [12] 邢佩, 杨若子, 杜吴鹏, 等. 1961-2017年华北地区高温日数及高温热浪时空变化特征[J]. 地理科学, 2020, 40(8): 1 365-1 376. [13] 张兴山, 王娟怀, 赵亮, 等. 1960-2020年京津冀高温热浪时空分布特征[J]. 气象与减灾研究, 2022, 45(3): 179-186. [14] 王艳姣, 任福民, 闫峰. 中国区域持续性高温事件时空变化特征研究[J]. 地理科学, 2013, 33(3): 314-321. [15] 林爱兰, 谷德军, 彭冬冬, 等. 近60年我国东部区域性持续高温过程变化特征[J]. 应用气象学报, 2021, 32(3): 302-314. [16] 王荣, 王遵娅, 高荣, 等. 1961-2020年中国区域性高温过程的气候特征及变化趋势[J]. 地球物理学报, 2023, 66(2): 494-504. [17] 李芷卉, 胡亚敏. 广东群发性高温事件的气候特征研究[J]. 热带气象学报, 2023, 39(1): 37-46. [18] 陈颖, 邵伟玲, 曹萌, 等. 新疆夏季高温日数的变化特征及其影响因子[J]. 干旱区研究, 2020, 37(1): 58-66. [19] 李朝月, 崔鹏, 郝建盛, 等. 1960年以来藏东南地区气温和降水的变化特征[J]. 高原气象, 2023, 42(2): 344-358. [20] 宾昕, 蒋贤玲, 任晓玥. 近51年海南岛极端气温事件分析[J]. 热带气象学报, 2023, 39(3): 424-432. [21] 贾文雄. 近50年来祁连山及河西走廊降水的时空变化[J]. 地理学报, 2012, 67(5): 631-644. [22] 魏凤英. 现代气候统计诊断与预测技术[M]. 北京: 气象出版社, 2007. -

 点击查看大图
图(8) / 表(2)
计量
- 文章访问数: 4
- HTML全文浏览量: 0
- PDF下载量: 0
- 被引次数: 0
 粤公网安备 4401069904700003号