


Analysis of S2S Multi-models Forecasting Performance for Persistent Heavy Precipitation Events During May-September over South China
-
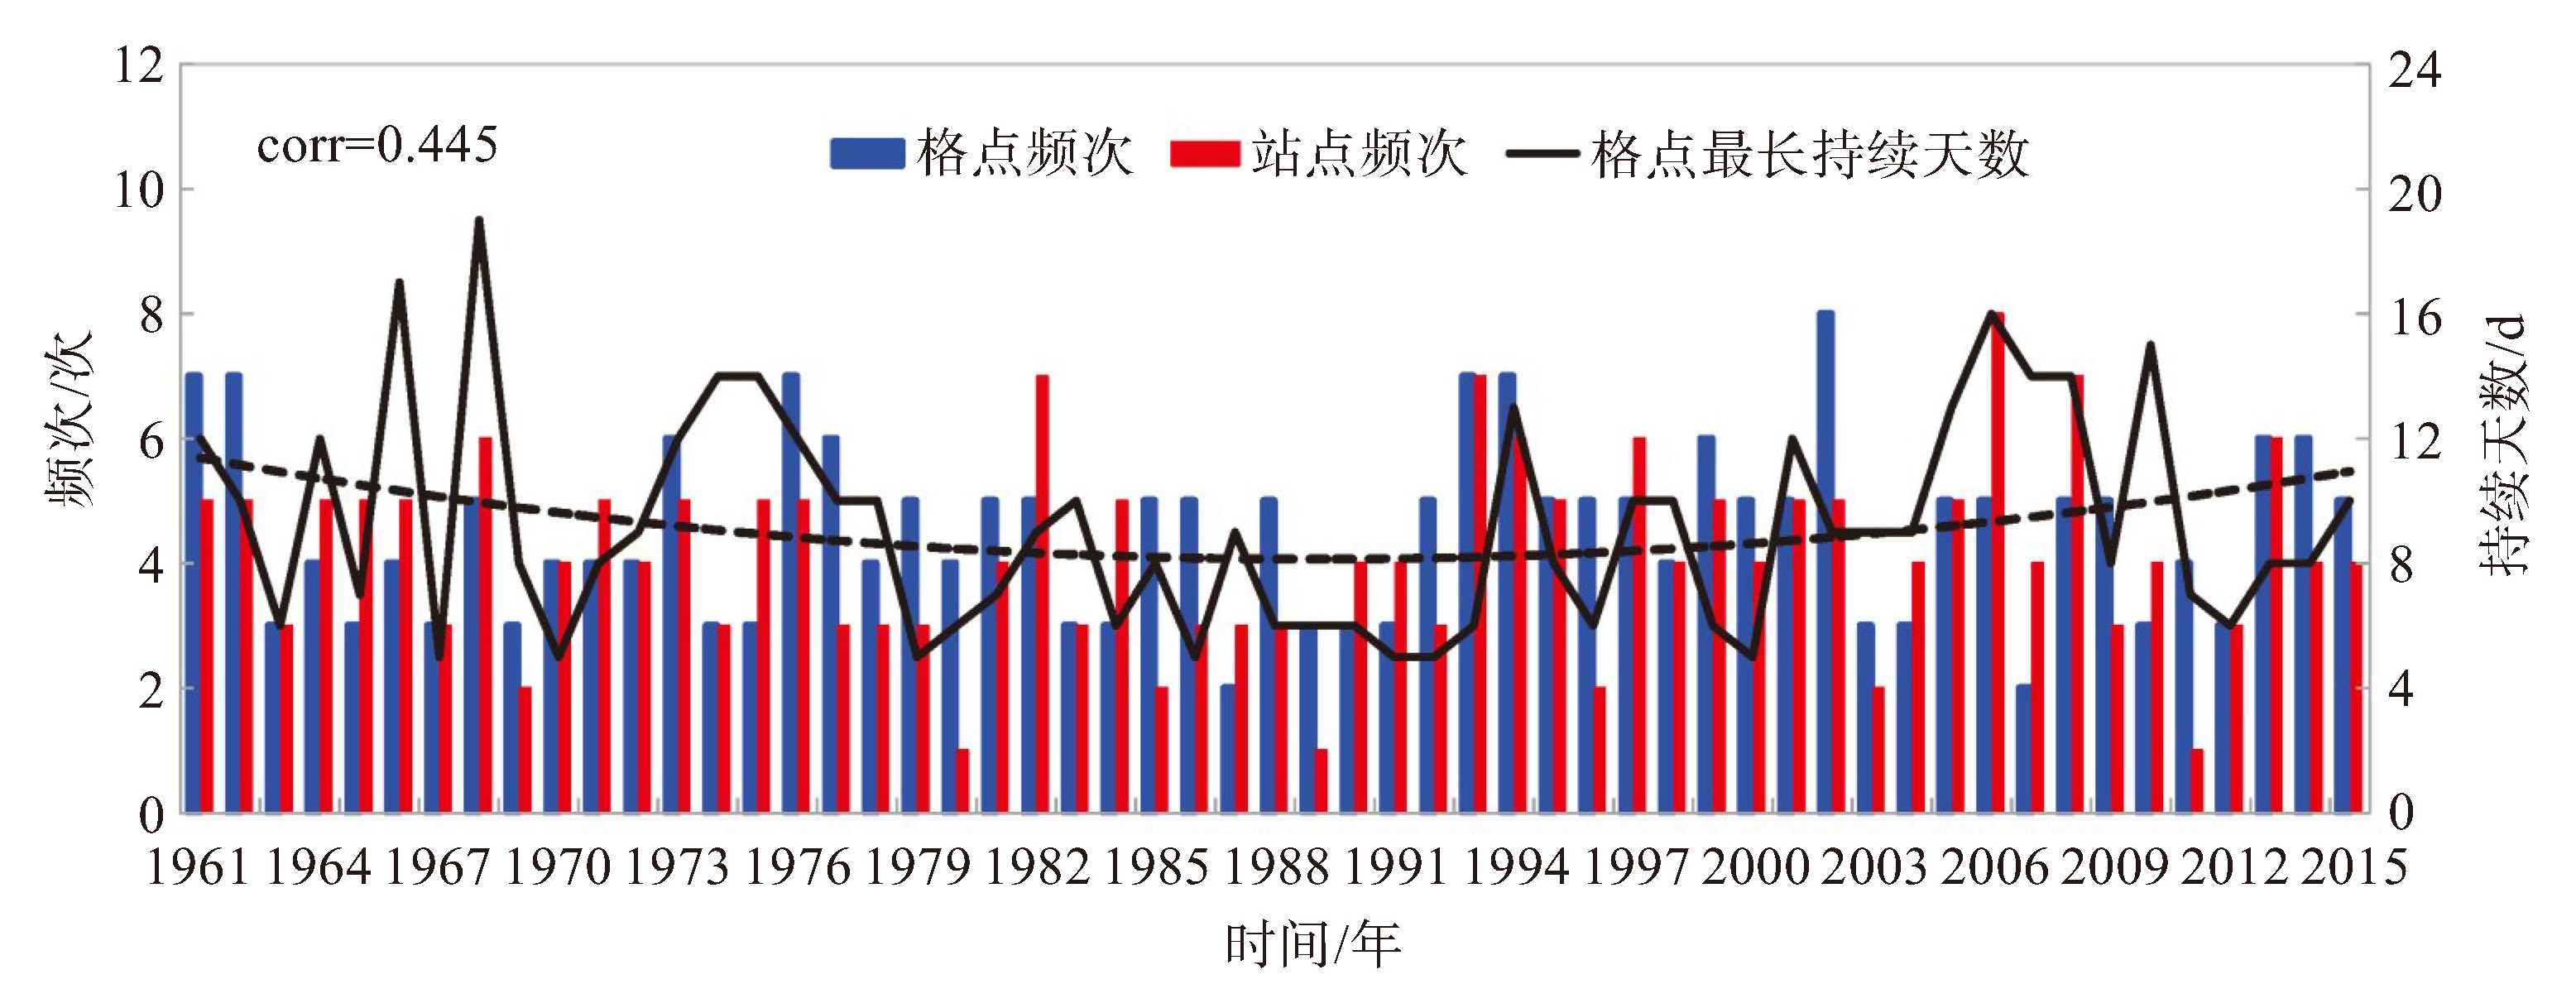
摘要: 利用世界气象组织(WMO)次季节至季节(S2S)第一阶段预测计划中的欧洲中期预报中心(ECMWF)、中国气象局(CMA)、英国气象局(UKMO)和美国国家环境预报中心(NCEP)4家模式回报数据以及1961—2015年中国2 407站逐日降水观测资料,研制了基于格点的区域持续性强降水事件客观识别和定量预测综合评分(CTS)及改进的二分类评分等指标,评估了S2S多模式回报产品降序排列后不同比例成员数集合平均对华南地区5—9月持续性强降水事件的预报效果。结果表明:华南地区平均每年出现4.5次持续性强降水事件,但年际波动大,最多8次,最少2次,以出现5次为最多;持续时间以3~7 d为主,最长可持续达19 d且呈增加趋势。各家S2S模式降序排列后CTS、成功指数(TS)和公平成功指数(ETS)评分总体随着参与集合平均的成员数增加而评分降低,CTS评分以NCEP模式为最优,TS和ETS评分则UKMO模式略优于ECMWF模式和NCEP模式,而多模式集成在前50%成员集成上有最高的预报效果。各家模式预报效果在年际分布上略有差异,所有成员集合平均对持续时间长的强降水事件的评分较高。所得结果可以为区域持续性强降水的实时监测和次季节预报提供参考。Abstract: This study develops grid-based objective identification criteria for persistent heavy precipitation events (PHPEs) in South China during May-September using daily precipitation observations from 2 407 stations across China (1961-2015). We then evaluated extended-range forecast skill using a Comprehensive Test Score (CTS) and improved dichotomous metrics, assessing multi-model ensemble means constructed from different proportions of top-ranked members based on the reforecast data from four operational models in the World Meteorological Organization's (WMO) Subseasonal-to-Seasonal (S2S) Prediction Project-the European Centre for Medium-Range Forecasts (ECMWF), China Meteorological Administration (CMA), United Kingdom Met Office (UKMO), and National Centers for Environmental Prediction (NCEP). The results show that South China experiences an average of 4.5 PHPEs per year, with significant interannual variability ranging from a minimum of 2 to a maximum of 8 events. The duration is mainly 3-7 days, and the longest duration can be up to 19 days with an increasing trend. The CTS, threat score (TS), and equitable threat score (ETS) decrease as more ensemble members in descending order are included in the mean. Among individual models, NCEP performs best in terms of CTS, while UKMO shows slightly better performance than ECMWF and NCEP according to TS and ETS. The CMA model exhibits the lowest skill across all metrics. The multi-model ensemble achieves the highest forecast skill when combining the top 50% of ensemble members. Additionally, all-ensemble-mean forecasts show higher scores for heavy precipitation events with longer durations. The results can provide valuable insights for real-time monitoring and subseasonal forecasting of PHPEs.
-
Key words:
- persistence /
- heavy precipitation /
- S2S models /
- forecast assessment
-

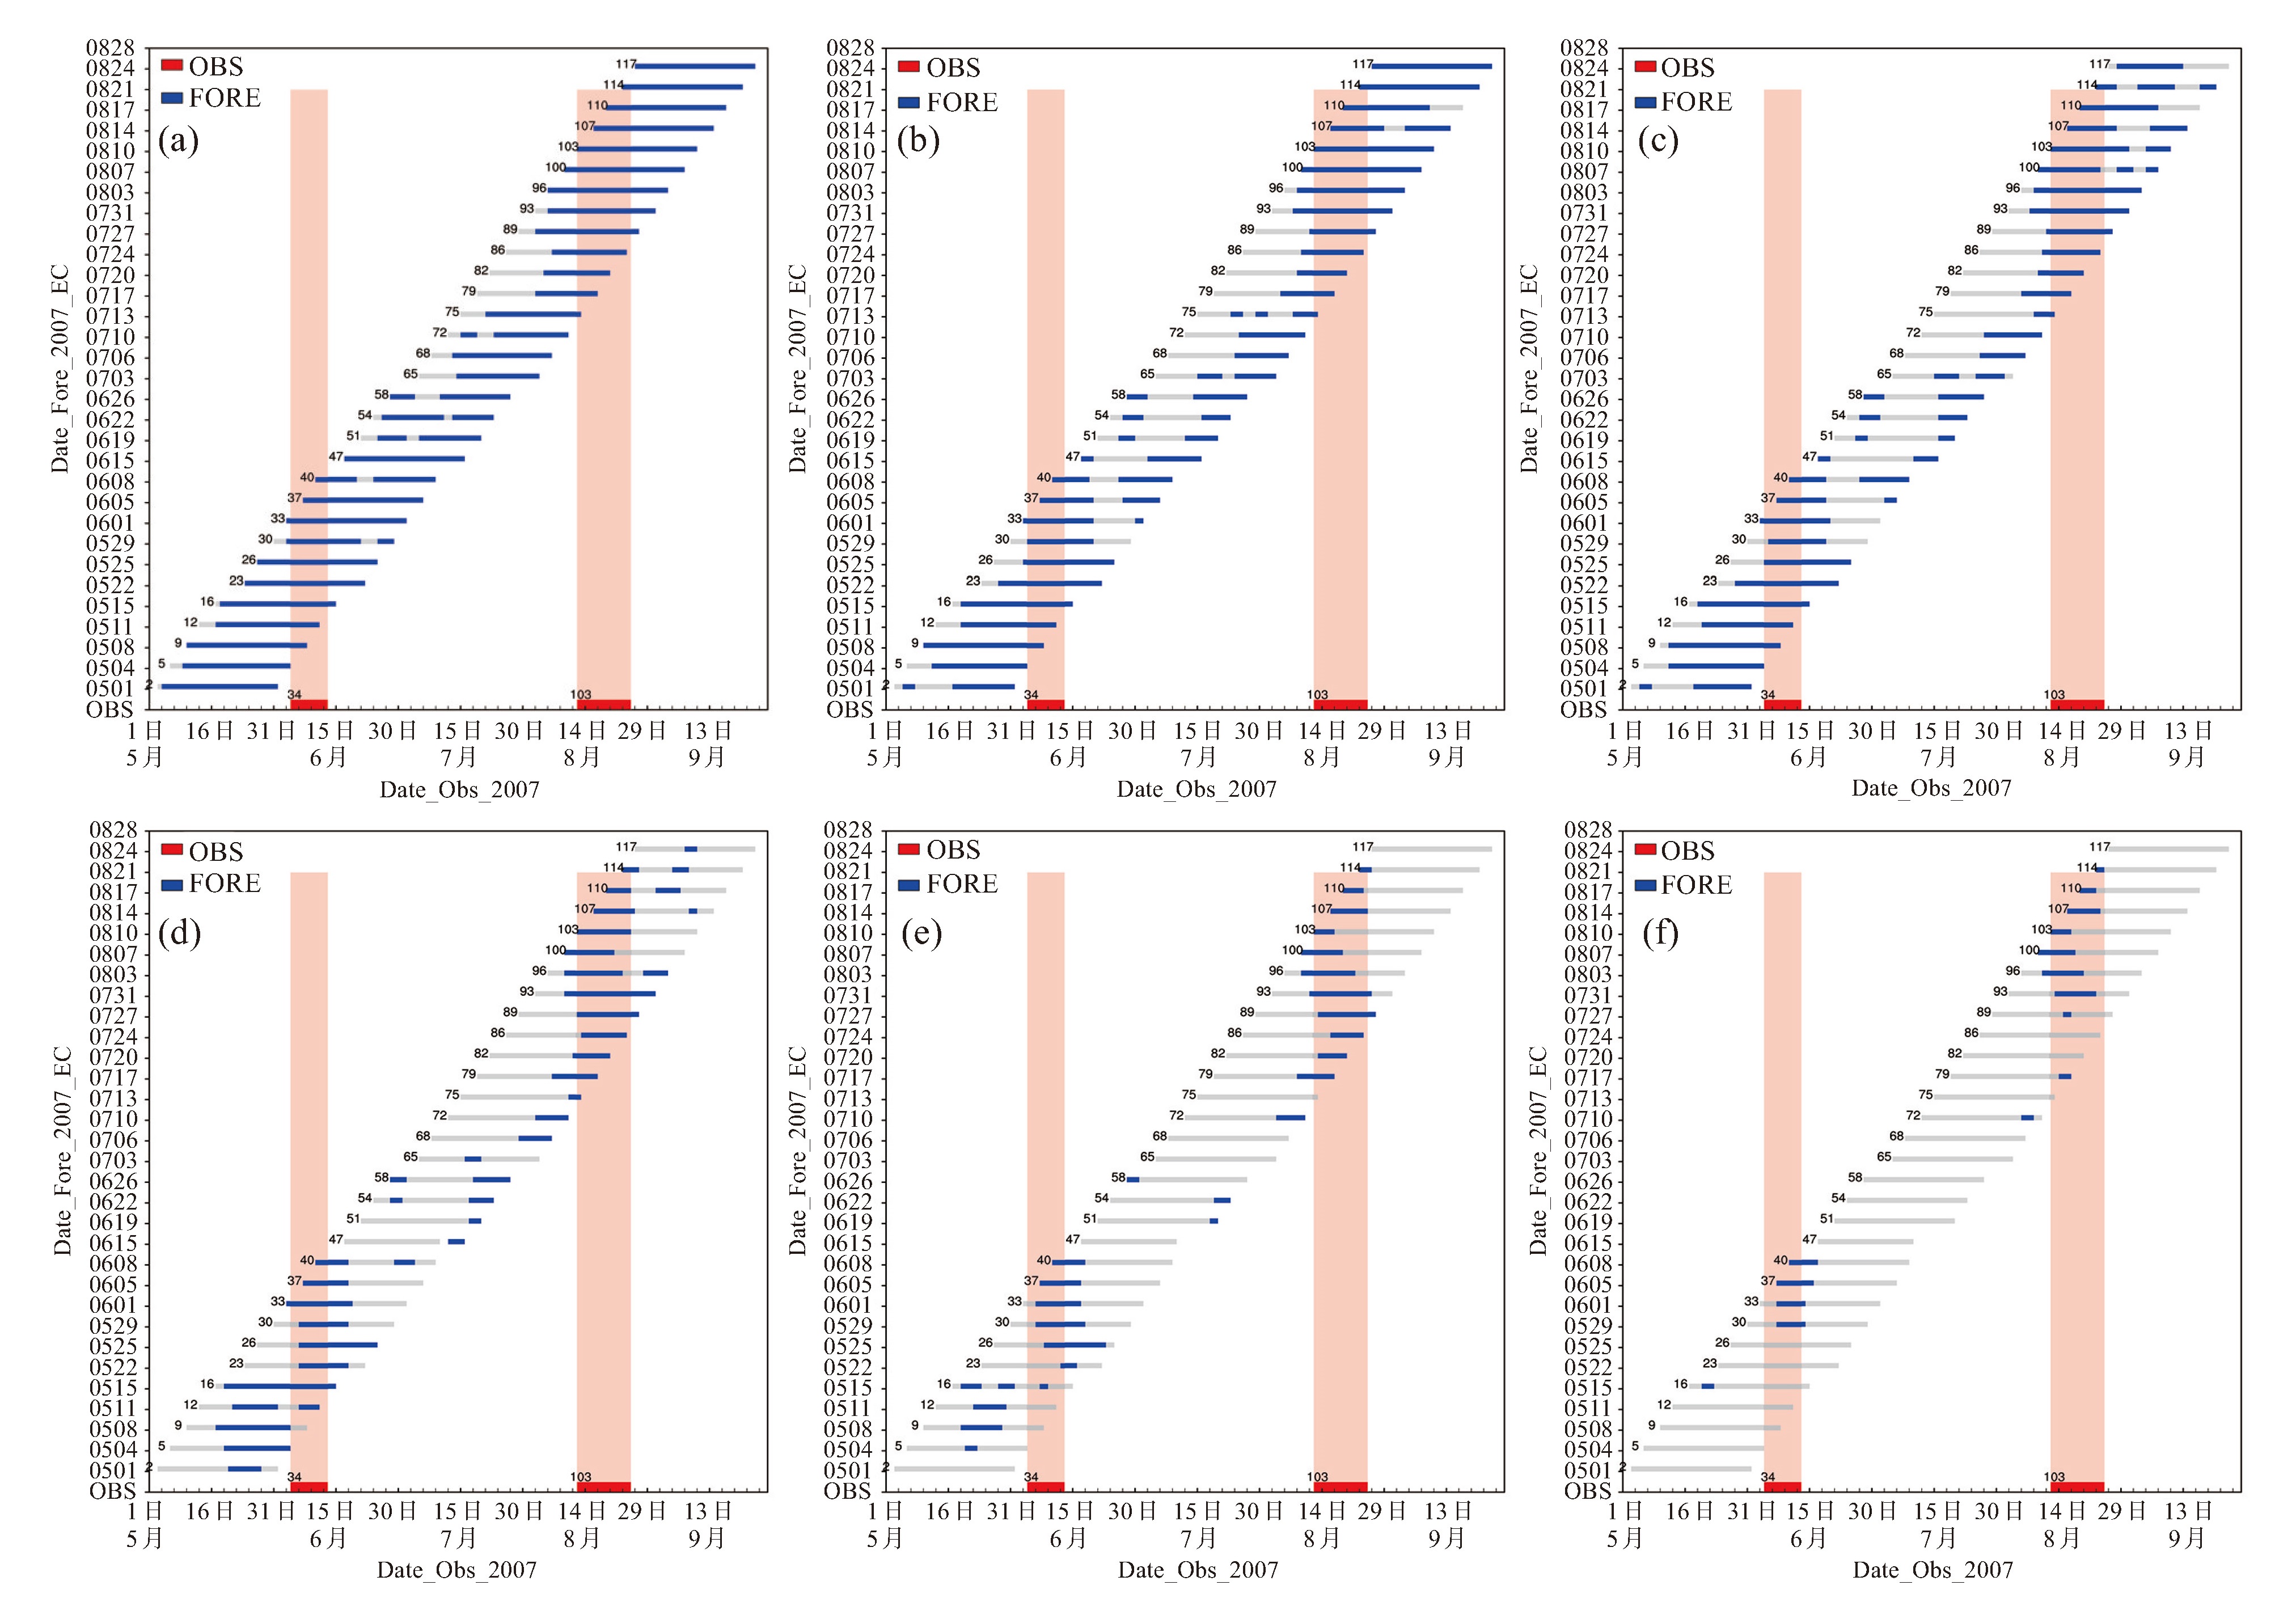
图 3 ECMWF模式不同比例成员数集合平均对2007年持续性强降水事件预报及CTS
a. Max1 (Nh:20,Nm:0,Nf:18,CTS:0.35);b. P75 (Nh:20,Nm:0,Nf:24,CTS:0.36);c. P67 (Nh:20,Nm:0,Nf:26,CTS:0.39);d. P50 (Nh:19,Nm:1,Nf:22,CTS:0.41);e. P33 (Nh:17,Nm:3,Nf:11,CTS:0.34);f. ENS (Nh:13,Nm:7,Nf:2,CTS:0.27)。

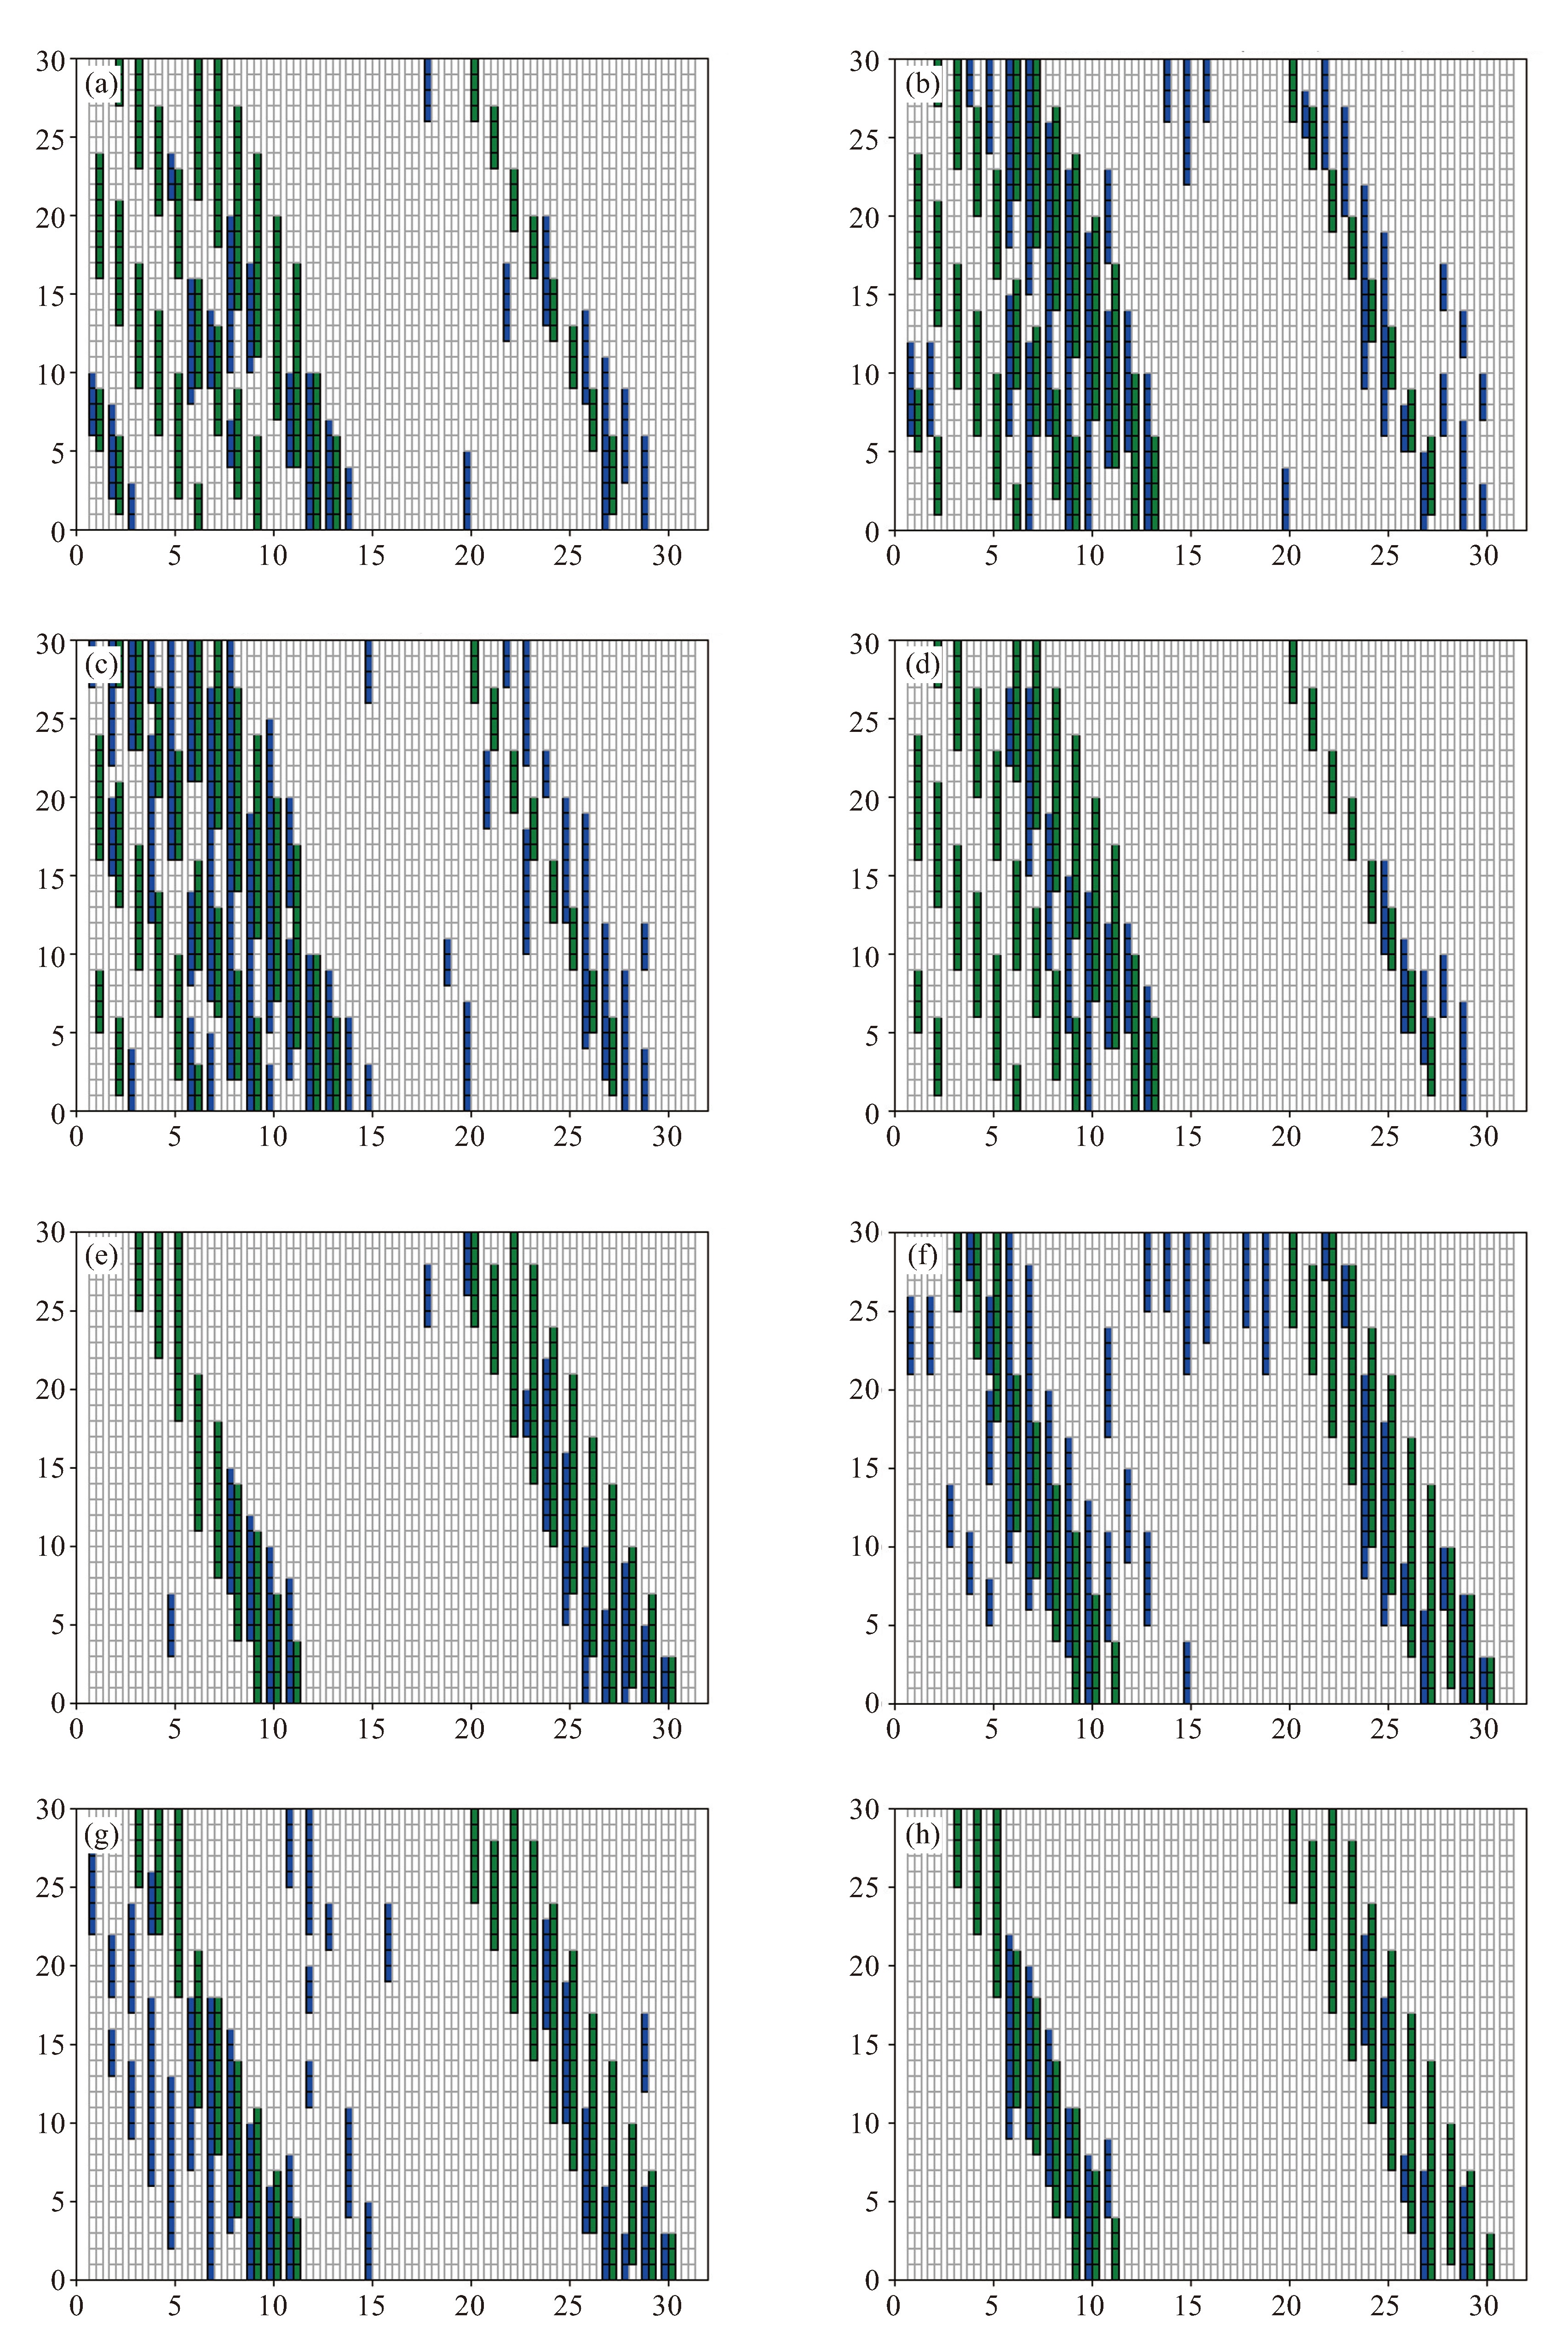
图 5 2005年(a~d)和2007年(e~h)年各家模式ENS及相应MME的预报情况(绿色:实况,蓝色:模式)
a. ECMWF(Nh:12,Nm:20,Nf:9,TS:0.29);b. UKMO(Nh:17,Nm:15,Nf:17,TS:0.35);c. NCEP(Nh:21,Nm:11,Nf:19,TS:0.41);d. MME(Nh:11,Nm:21,Nf:2,TS:0.32);e. ECMWF(Nh:13,Nm:7,Nf:2,TS:0.59);f. UKMO(Nh:16,Nm:4,Nf:17,TS:0.43);g. NCEP(Nh:13,Nm:7,Nf:17,TS:0.35);h. MME(Nh:10,Nm:10,Nf:1,TS:0.48)。
表 1 所选S2S模式回报资料说明
数据中心 预报时效 集合成员 更新频率 回报时长 模式版本年份 ECMWF(ecmf) 0~46 d 11 一周两次 过去20年 2015,2016,2017,2018 UKMO(egrr) 0~60 d 7 每月4次 1993—2015年 2016,2017 NCEP(kwbc) 0~44 d 4 逐日 1999—2010年 2015,2016 CMA(babj) 0~60 d 4 逐日 1994—2014年 2015  下载: 导出CSV
表 2 区域不同阈值和格点比例确定持续极端强降水事件对比
过程 阈值 年份 阈值 年份 阈值 年份 1961—2015 1999—2010 1961—2015 1999—2010 1961—2015 1999—2010 站点过程 226 56 226 56 226 56 格点过程 80百分位10%格点 379 83 85百分位10%格点 330 75 90百分位10%格点 248 55 格点/站点 1.68 1.48 1.46 1.34 1.1 0.98 过程一致(一致率) 216
(95.6%)53
(94.6%)217
(96%)51
(91.1%)193
(85.4%)46
(82.1%)格点过程 80百分位15%格点 320 77 85百分位15%格点 263 63 90百分位15%格点 169 44 格点/站点 1.42 1.38 1.16 1.13 0.75 0.79 过程一致(一致率) 207
(91.6%)47
(83.9%)193
(85.4%)47
(83.9%)151
(66.8%)40
(71.4%)格点过程 80百分位20%格点 258 53 85百分位20%格点 213 51 90百分位20%格点 132 33 格点/站点 1.14 0.95 0.94 0.91 0.58 0.59 过程一致(一致率) 202
(89.4%)47
(83.9%)177
(78.3%)44
(78.6%)121
(53.5%)31
(55.4%)
下载: 导出CSV
表 3 二分类预报检验列联表
预报 观测 事件发生 事件不发生 累计 事件发生 命中数(A) 空报数(B) 预报事件发生数 事件不发生 漏报数(C) 正确否定(D) 预报事件不发生数 累计 观测事件发生数 观测事件不发生数 总样本数
下载: 导出CSV
表 4 1999—2010年平均各家模式不同比例成员数集合平均及MME的CTS
模式 Max1 P75 P67 P50 P33 ENS ECMWF 0.42 0.38 0.40 0.39 0.34 0.23 UKMO 0.43 0.39 0.41 0.42 0.43 0.34 NCEP 0.50 0.50 0.50 0.50 0.41 0.32 CMA 0.30 0.30 0.14 0.14 0.05 0.03 MME 0.50 0.50 0.50 0.50 0.37 0.16
下载: 导出CSV
表 5 1999—2010年平均各家模式不同比例成员数集合平均及MME的TS评分
模式 Max1 P75 P67 P50 P33 ENS ECMWF 0.70 0.52 0.46 0.36 0.30 0.21 UKMO 0.65 0.57 0.48 0.42 0.36 0.28 NCEP 0.48 0.48 0.38 0.38 0.33 0.28 CMA 0.21 0.21 0.10 0.10 0.03 0.01 MME 0.70 0.66 0.54 0.43 0.30 0.16
下载: 导出CSV
表 6 1999—2010年平均各家模式不同比例成员数集合平均及MME的ETS评分
模式 Max1 P75 P67 P50 P33 ENS ECMWF 0.34 0.22 0.19 0.13 0.10 0.08 UKMO 0.37 0.30 0.23 0.19 0.15 0.09 NCEP 0.21 0.21 0.15 0.15 0.12 0.10 CMA 0 0 -0.06 -0.06 -0.04 -0.01 MME 0.42 0.38 0.28 0.19 0.10 0.07
下载: 导出CSV
-
[1] IPCC. Climate Change 2021: The Physical Science Basis[R]. NY, USA: Working Group Ⅰ to the Sixth Assessment Report of the Intergovernmental Panel on Climate Change, 2021. [2] ZHAI P M, ZHANG X B, WANG H, et al. Trends in total precipitation and frequency of daily precipitation extremes over China[J]. J Climate, 2005, 18(7): 1 096-1 108. [3] 张庆云, 陶诗言, 彭京备. 我国灾害性天气气候事件成因机理的研究进展[J]. 大气科学, 2008, 32(4): 815-825. [4] 翟盘茂, 余荣, 周佰铨, 等. 1.5℃增暖对全球和区域影响的研究进展[J]. 气候变化研究进展, 2017, 13(5): 465-472. [5] ZHOU B T, WANG Z Y, SHI Y, et al. Historical and future changes of snowfall events in China under a warming background[J]. J Climate, 2018, 31(15): 5 873-5 889. [6] LIU L, WANG Y Q. Trends in landfalling tropical cyclone-induced precipitation over China[J]. J Climate, 2020, 33(6): 2 223-2 235. [7] WANG Z Y, LIU Y J, WANG G F, et al. Factors responsible for the increase of winter low temperature extremes from the mid-1990s to the early 2010s in northern China[J]. J Appl Meteor Climatol, 2021, 60(9): 1 207-1 218. [8] CHEN Y, ZHAI P M. Persistent extreme precipitation events in China during 1951-2010[J]. Climate Res, 2013, 57: 143-155. [9] CHEN Y, ZHAI P M. Two types of typical circulation pattern for persistent extreme precipitation in central-eastern China[J]. Quart J Roy Meteor Soc, 2014, 140(682): 1 467-1 478. [10] 李华实, 王东海, 陆虹, 等. 广西汛期大范围持续性强降水特征与天气学分型研究[J]. 热带气象学报, 2023, 39(2): 242-255. [11] 李卓凡, 王东海, 曾智琳. 粤港澳大湾区一次局地极端强降水过程的多尺度观测特征与演变分析[J]. 热带气象学报, 2023, 39(6): 915-928. [12] 翟盘茂, 李蕾, 周佰铨, 等. 江淮流域持续性极端降水及预报方法研究进展[J]. 应用气象学报, 2016, 27(5): 631-640. [13] 王东海, 夏茹娣, 刘英. 2008年华南前汛期致洪暴雨特征及其对比分析[J]. 应用气象学报, 2011, 69 (1): 137-148. [14] WU H, ZHAI P M, CHEN Y. A comprehensive classi fi cation of anomalous circulation patterns responsible for persistent precipitation extremes in South China[J]. J Meteor Res, 2016, 30(4): 483-495. [15] 刘国忠, 周云霞, 覃月凤, 等. "20.6"华南西部前汛期极端持续性暴雨特征与成因分析[J]. 热带气象学报, 2023, 39(6): 807-824. [16] 鲍名. 两次华南持续性暴雨过程中热带西太平洋对流异常作用的比较[J]. 热带气象学报, 2008, 24(1): 27-36. [17] 胡娅敏, 翟盘茂, 罗晓玲, 等. 2013年华南前汛期持续性强降水的大尺度环流与低频信号特征[J]. 气象学报, 2014, 72(3): 465-477. [18] 苗芮, 温敏, 张人禾. 2010年华南前汛期持续性降水异常与准双周振荡[J]. 热带气象学报, 2017, 33(2): 155-166. [19] 伍红雨, 郭尧, 邹燕, 等. 华南区域性暴雨过程的客观评估及异常机理分析[J]. 暴雨灾害, 2021, 40(3): 306-315. [20] 林爱兰, 谷德军, 李春晖, 等. 影响华南汛期持续性强降水年际变化的大气环流和海温异常[J]. 热带气象学报, 2022, 38(1): 1-10. [21] 朱跃建. 基于最新全球集合预报系统的可预报性评估[J]. 大气科学学报, 2020, 43(1): 193-200. [22] 徐邦琪, 臧钰歆, 朱志伟, 等. 时空投影模型(STPM) 的次季节至季节(S2S)预测应用进展[J]. 大气科学学报, 2020, 43(1): 212-224. [23] 张可越, 李娟, 徐邦琪, 等. 中国南方降水及其极端事件的动力-统计相结合延伸期预报[J]. 气象学报, 2023, 81(1): 79-93. [24] DOBLAS R F J, GARCIA S J, LIENERT F, et al. Seasonal climate predictability and forecasting: Status and prospects[J]. WIREs Clim Change, 2013, 4(4): 245-268. [25] VITART F, LIN H, HENDON H, et al. The subseasonal to seasonal (S2S) prediction project database[J]. Bull Amer Meteor Soc, 2017, 98 (1): 163-176. [26] 胡星, 张志强, 张强, 等. 次季节-季节(S2S)预测数据分析与应用[J]. 气象科技, 2020, 48(6): 779-787. [27] VITART F, ROBERTSON A W. The sub-seasonal to seasonal prediction project (S2S) and the prediction of extreme events[J]. npj Clim Atmos Sci, 2018, 1(3): 1-3. [28] JIE W H, VITART F, WU T W, et al. Simulations of Asian Summer Monsoon in the Sub-seasonal to Seasonal Prediction Project (S2S) database[J]. Quart J of Royal Meter Soc, 2017, 143(706): 2 282-2 295. [29] 贺铮, 徐邦琪, 高欢侠. BCC S2S模式对亚洲夏季风准双周振荡预报评估[J]. 应用气象学报, 2018, 29(4): 436-448. [30] YANG J, ZHU T, GAO M N, et al. Late-July barrier for subseasonal forecast of summer daily maximum temperature over Yangtze River Basin[J]. Geophy Res Lett, 2018, 45(22): 12 610-12 615. [31] HE Z, HSU P C, LIU X W, et al. Factors limiting the forecast skill of the boreal summer intraseasonal oscillation in a subseasonal-to-seasonal model[J]. Adv Atmos Sci, 2019, 36(1): 104-118. [32] HSU P C, QIAN Y T, LIU Y, et al. Role of abnormally enhanced MJO over the Western Pacific in the formation and subseasonal predictability of the record-breaking Northeast Asian heatwave in the summer of 2018[J]. J Climate, 2020, 33(8): 3 333-3 349. [33] WU J, REN H L, LU B, et al. Effects of moisture initialization on MJO and its teleconnection prediction in BCC subseasonal coupled model [J]. J Geophy Res: Atmos, 2020, 125: e2019JD031537. [34] 彭阳, 李晓静, 姚永红, 等. 11个S2S模式对MJO预报效果的评估分析[J]. 气象科学, 2021, 41(3): 339-348. [35] STAN C, ZHENG C, CHANG E K M, et al. Advances in the prediction of MJO teleconnections in the S2S forecast systems[J]. Bull Amer Meteor Soc, 2022, 103(6): 1 426-1 447. [36] DE ANDRADE F M, COELHO C A S, CAVALCANTI I F A. Global precipitation hindcast quality assessment of the Subseasonal to Seasonal (S2S) prediction project models[J]. Climate Dyn, 2019, 52: 5 451-5 475. [37] 王晨, 李建平. 基于次季节—季节(S2S)模式的中国东部夏季日降水预报评估[J]. 海洋气象学报, 2022, 42(4): 22-36. [38] 林倩, 陈杰, 李威, 等. S2S次季节到季节预报对全球降水预报的性能评价[J]. 水资源研究, 2019, 8(6): 547-556. [39] FU Z P, HUANG A N, GUO Q. Improvements of the sub-seasonal precipitation predicted by the BCC_S2S forecast system over Eastern China in summer using the singular value decomposition bias correction method[J]. Front Earth Sci, 2022, 9: 770167. [40] WANG X J, LI S, LIU L, et al. The performance of S2S models on predicting the 21.7 extreme rainfall event in Henan China[J]. Atmos, 2022, 13(9): 1 516. [41] 林爱兰, 谷德军, 彭冬冬, 等. 体现大尺度特征的区域持续性强降水过程定义指标[J]. 热带气象学报, 2020, 36(3): 1-10. [42] 杜良敏, 柯宗建. 一种适用于延伸期过程事件预报的检验方法[J]. 应用气象学报, 2013, 24(6): 686-694. [43] 洪伟. 华南5-8月持续性强降水的10-30天低频特征分析[D]. 南京: 南京大学, 2014: 3. [44] 张弛. 华南地区极端持续性强降水事件研究[D]. 长沙: 国防科技大学, 2020: 1, 19. [45] SIBSON R. A brief description of natural neighbor interpolation[C]. In: Barnett V, Ed, Interpreting Multivariate Data, John Wiley & Sons, New York, 1981: 21-36. [46] 王喆, 唐伟, 朱玉洁. 国家级气象业务现代化评估与分析思考[J]. 气象软科学, 2017, 27(1): 97-115. [47] 季晓东, 漆梁波. ECMWF模型降水预报与极端天气预报指数在暴雨预报中的评估与应用[J]. 暴雨灾害, 2018, 37(6): 566-573. [48] 卫捷, 陶诗言, 梁丰. 2007年夏季中国大陆85°E以东的异常天气与气候—中国科学院大气物理研究所2007年汛期降水预测的总结[J]. 气候与环境研究, 2007, 12(6): 699-712. [49] ROEBBER P J. Visualizing multiple measures of forecast quality[J]. Wea Forecasting, 2009, 24(2): 601-608. [50] 杨露, 陈杰, 孔若杉, 等. BCC-CPSv3-S2Sv2模式对中国区域降水和气温预测的性能评价[J]. 武汉大学学报(工学版), 2023, 56(3): 281-295. -

 点击查看大图
计量
- 文章访问数: 14
- HTML全文浏览量: 8
- PDF下载量: 3
- 被引次数: 0
 粤公网安备 4401069904700003号