


The Impacts of Temperature, Relative Humidity and Climate Comfort on Depression Symptoms
-
摘要: 气候变化正在对人类社会带来重大而深远的影响,气候对心理健康的影响及其机制,亟需深入探讨。基于2012—2020年中国家庭追踪调查(China Family Panel Studies,CFPS)成人库数据(N=58 256)和202个气象观测站气象数据,通过地级市中心经纬度坐标关联匹配,对季节气候条件如何影响人们的抑郁情绪展开研究,关键气候因子选取基本气象因素(气温、相对湿度)以及气候舒适度(温湿指数、寒冷指数和人体舒适度指数),得到以下结论。(1)春夏季节气象因素对抑郁情绪有显著影响,其中,气温和气候舒适度对抑郁情绪的影响程度较大。具体为适宜的气温、相对湿度、温湿指数和人体舒适度指标可以显著降低抑郁情绪,但是寒冷指数升高显著加重抑郁。人体舒适度指数每增加一个单位,抑郁情绪显著降低3%。(2)在春夏季节,当同时控制气温和相对湿度两个气象因素时,各自对抑郁情绪的影响比控制单个气象因素时更为明显。(3)春夏季节南北地区的气候因素对抑郁情绪存在明显差异。北方气候因素对抑郁情绪影响显著,而南方地区未发现显著影响。(4)在春夏季节,不同社会人口因素对抑郁情绪的影响也存在差异,比如未婚人口占比越大,公众抑郁情绪水平可能越高。本研究结果强调了非极端的气候条件对身心健康的潜在影响,以期推动我国对公众气候变化心理问题的关注,并为气候学、心理学相关学科和政府部门制定政策提供参考,助力构建全民参与的气候适应型社会。Abstract: Climate change strongly affects human society. Further research is required to fully understand how the climatic conditions affect human health, particularly mental health. This study investigates how seasonal climatic conditions affect seasonal affective disorder using data from the China Family Panel Study (CFPS, N=58 256), based on nationally representative data from 2012 to 2020. We analyzed the impact of temperature, relative humidity and climate amenity on depression, and compared the effects under different geographical locations and social demographic factors, including gender, age, and household registration. The results are shown as follows. (1) During spring and summer, all meteorological factors significantly affected depression. The climate amenity influence was more significant than that of basic meteorological factors. The results showed that meteorological factors were all significantly and negatively related to depression, except for the Cool Index, which was positively related to depression. (2) When temperature and relative humidity were controlled simultaneously, the influence on depression was more obvious than that of individual meteorological factor. (3) Different effects of meteorological conditions on depression existed in the same season in different regions. All meteorological indicators on depression showed significant effects in northern cities, while no significant effect was found in the southern cities. (4) Socio-demographic factors also significantly affected depression. For example, the larger the proportion of unmarried population, the higher the level of public depression would be. This study enhances understanding for psychologists, climate scientists, and policymakers regarding psychology application in climate practices and public mental health response. This offers insights for climate-resilient society health strageties.
-
Key words:
- climate change /
- mental health /
- climate comfort /
- adaptive thermal comfort /
- depression symptoms /
- climate amenity
-
表 1 春夏季节CFPS城市人口学变量描述性统计
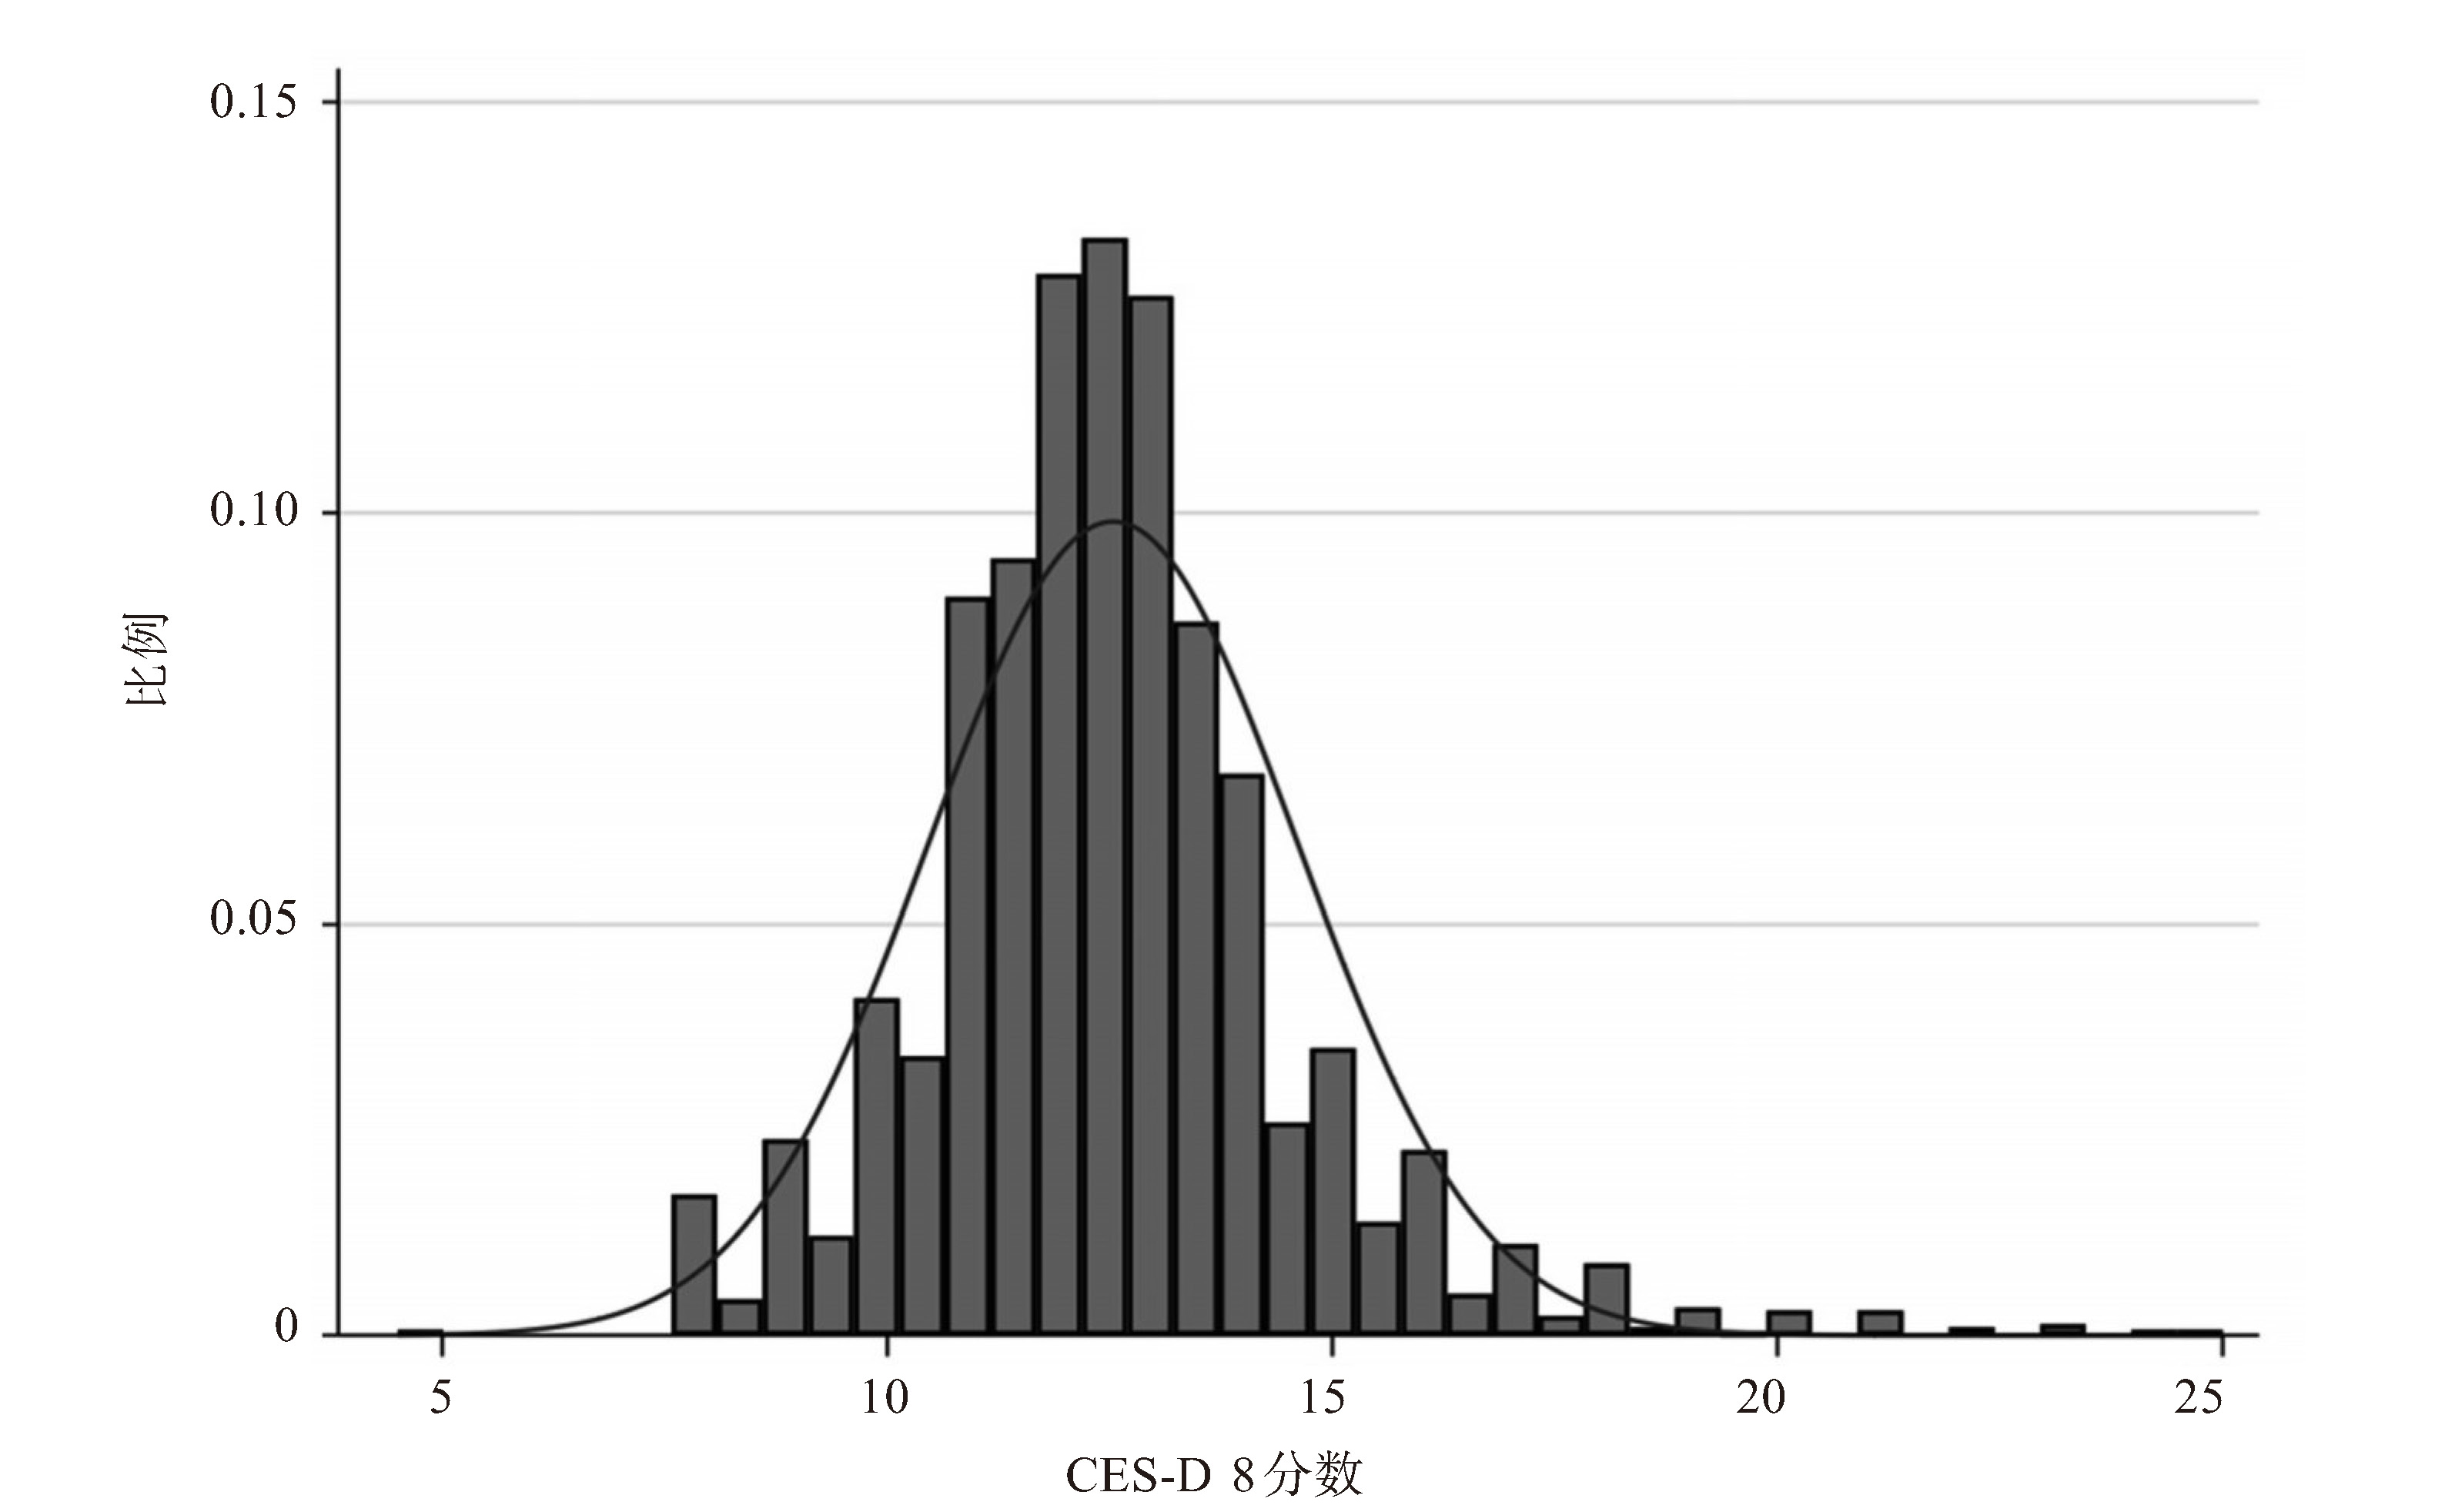
变量 均值 标准差 最小值 最大值 观测组 CES-D8 12.49 1.85 8 25 1 413 教育程度 4.61 1.82 1 10 1 413 身体健康 3.80 1.73 1 7 1 413 性别 0.51 0.50 0 1 1 413 年龄 39.42 11.79 18 60 1 413 婚姻状况 0.17 0.38 0 1 1 413 农村户口 0.71 0.46 0 1 1 413 年 2017 2.71 2012 2020 1 413 月 7.17 1.12 3 8 1 413  下载: 导出CSV
表 2 春夏季节CFPS全国城市月度气象变量描述性统计
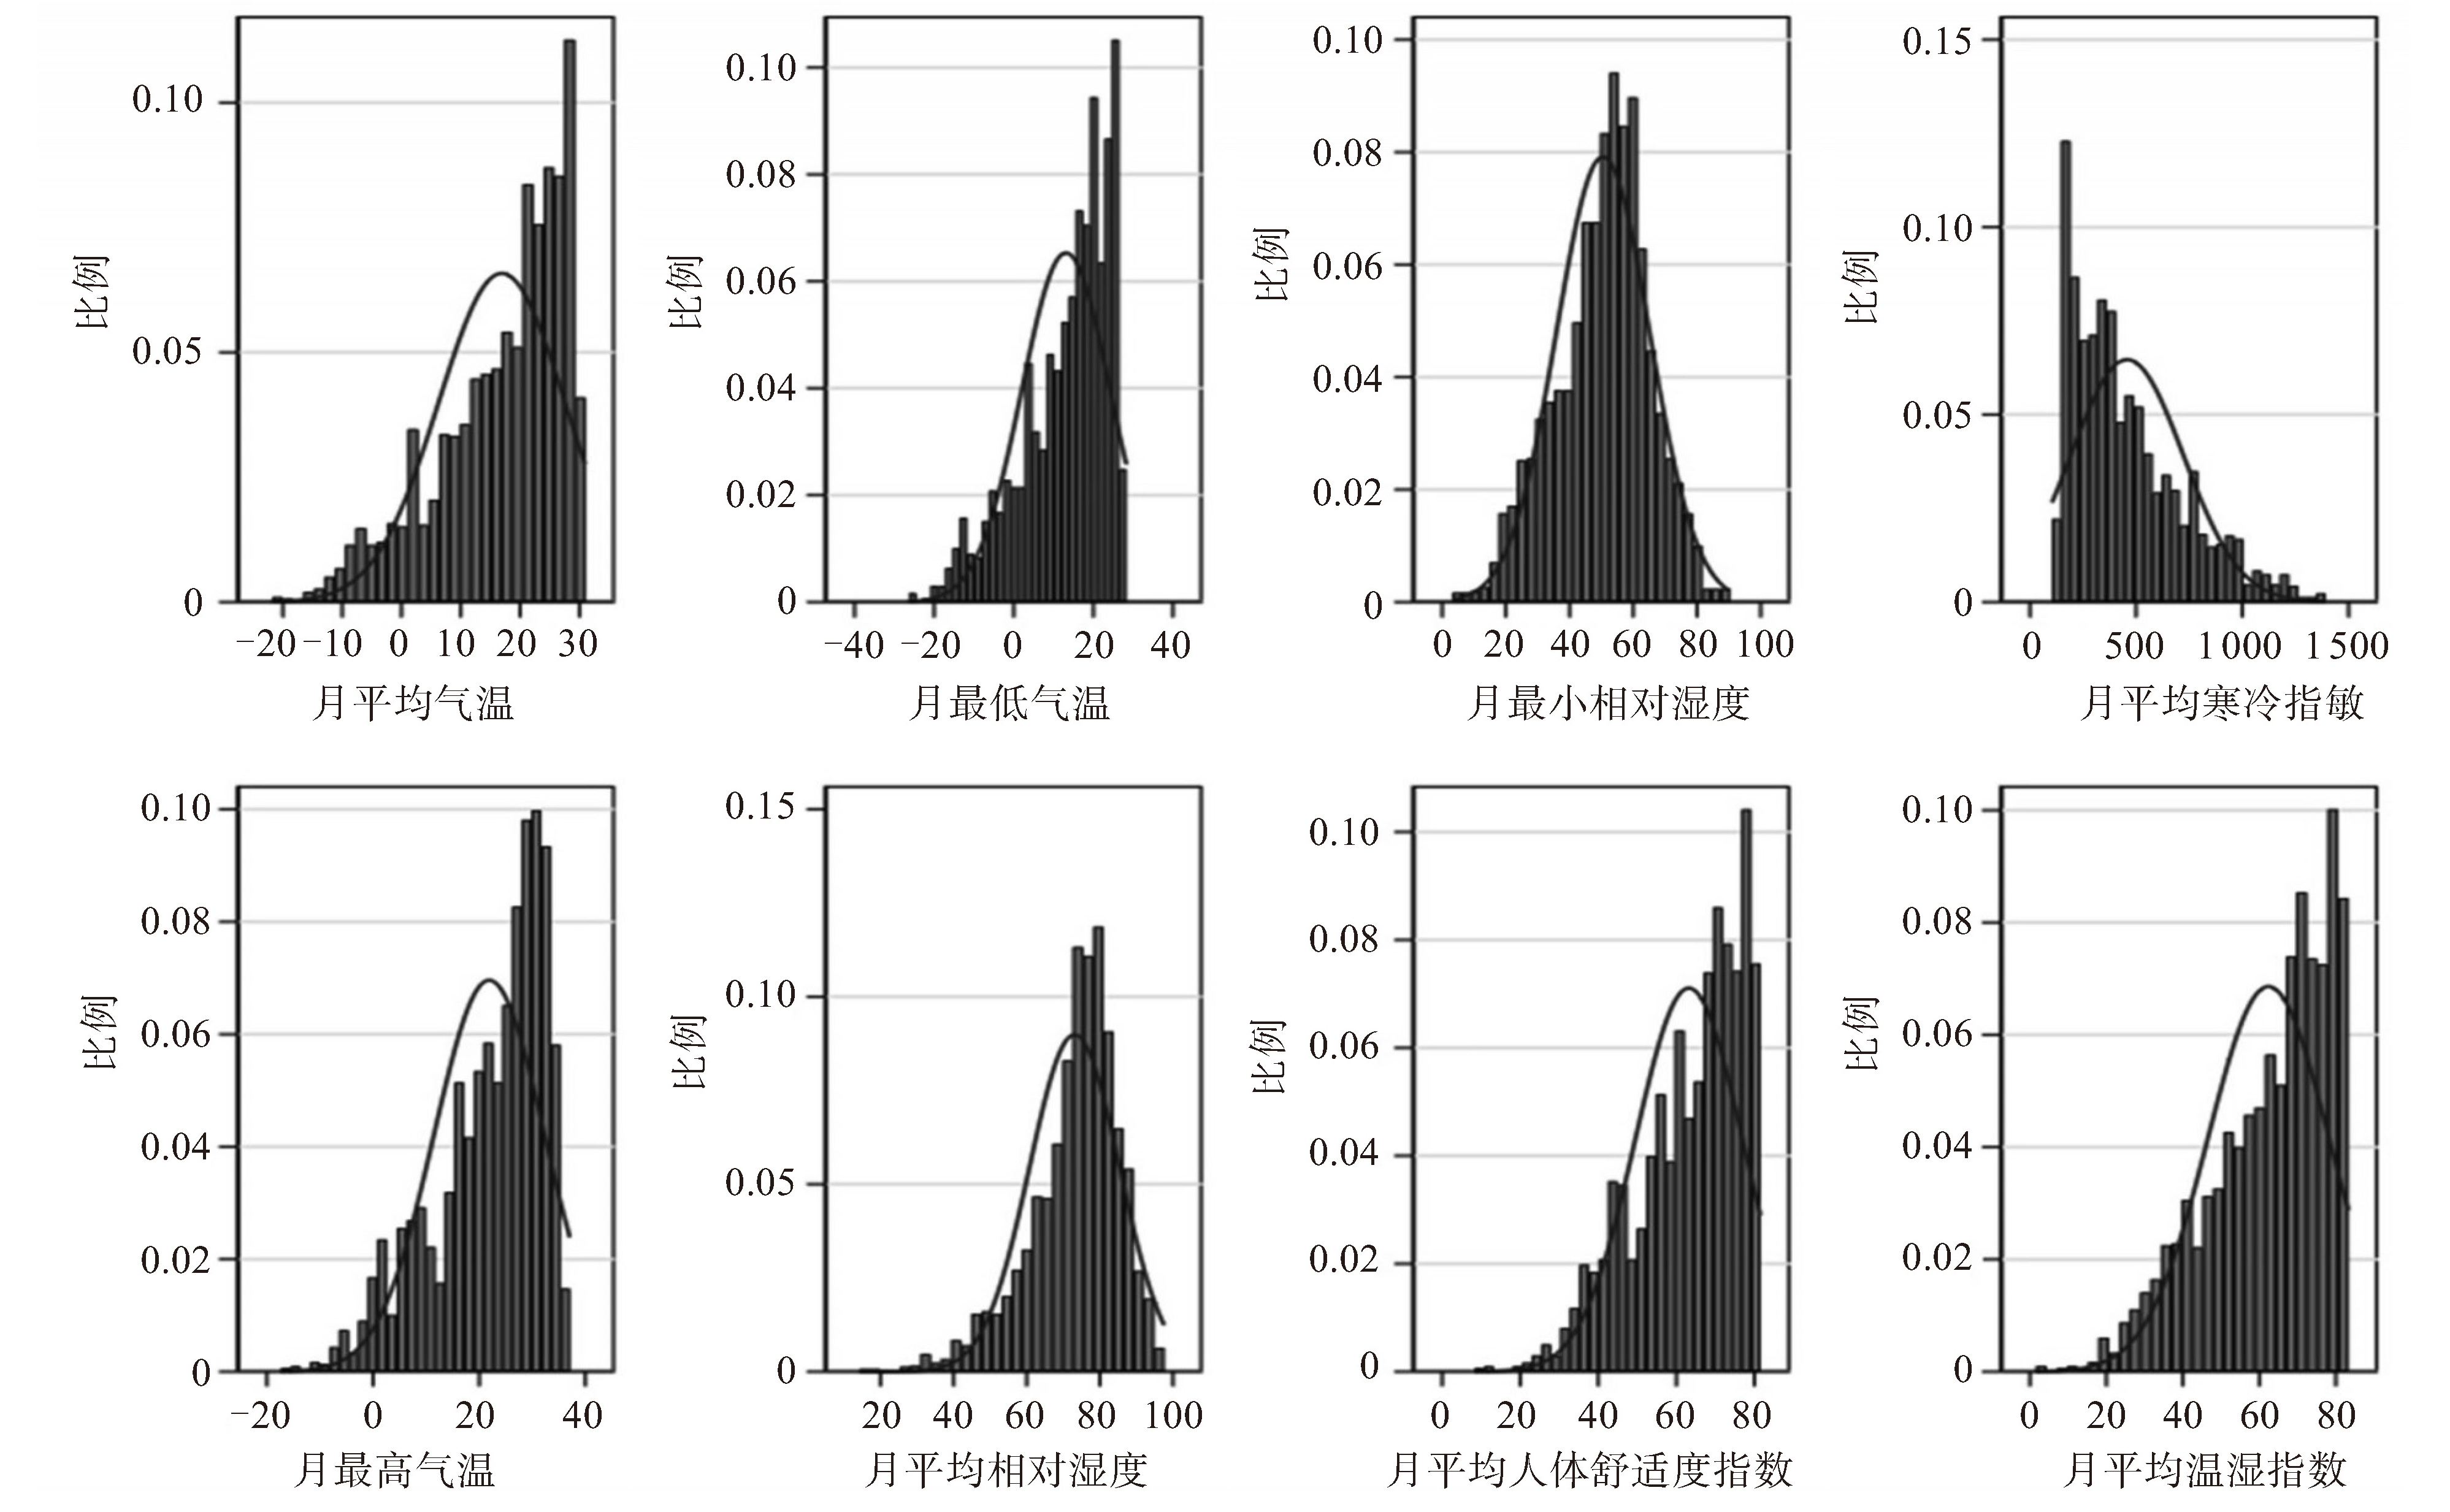
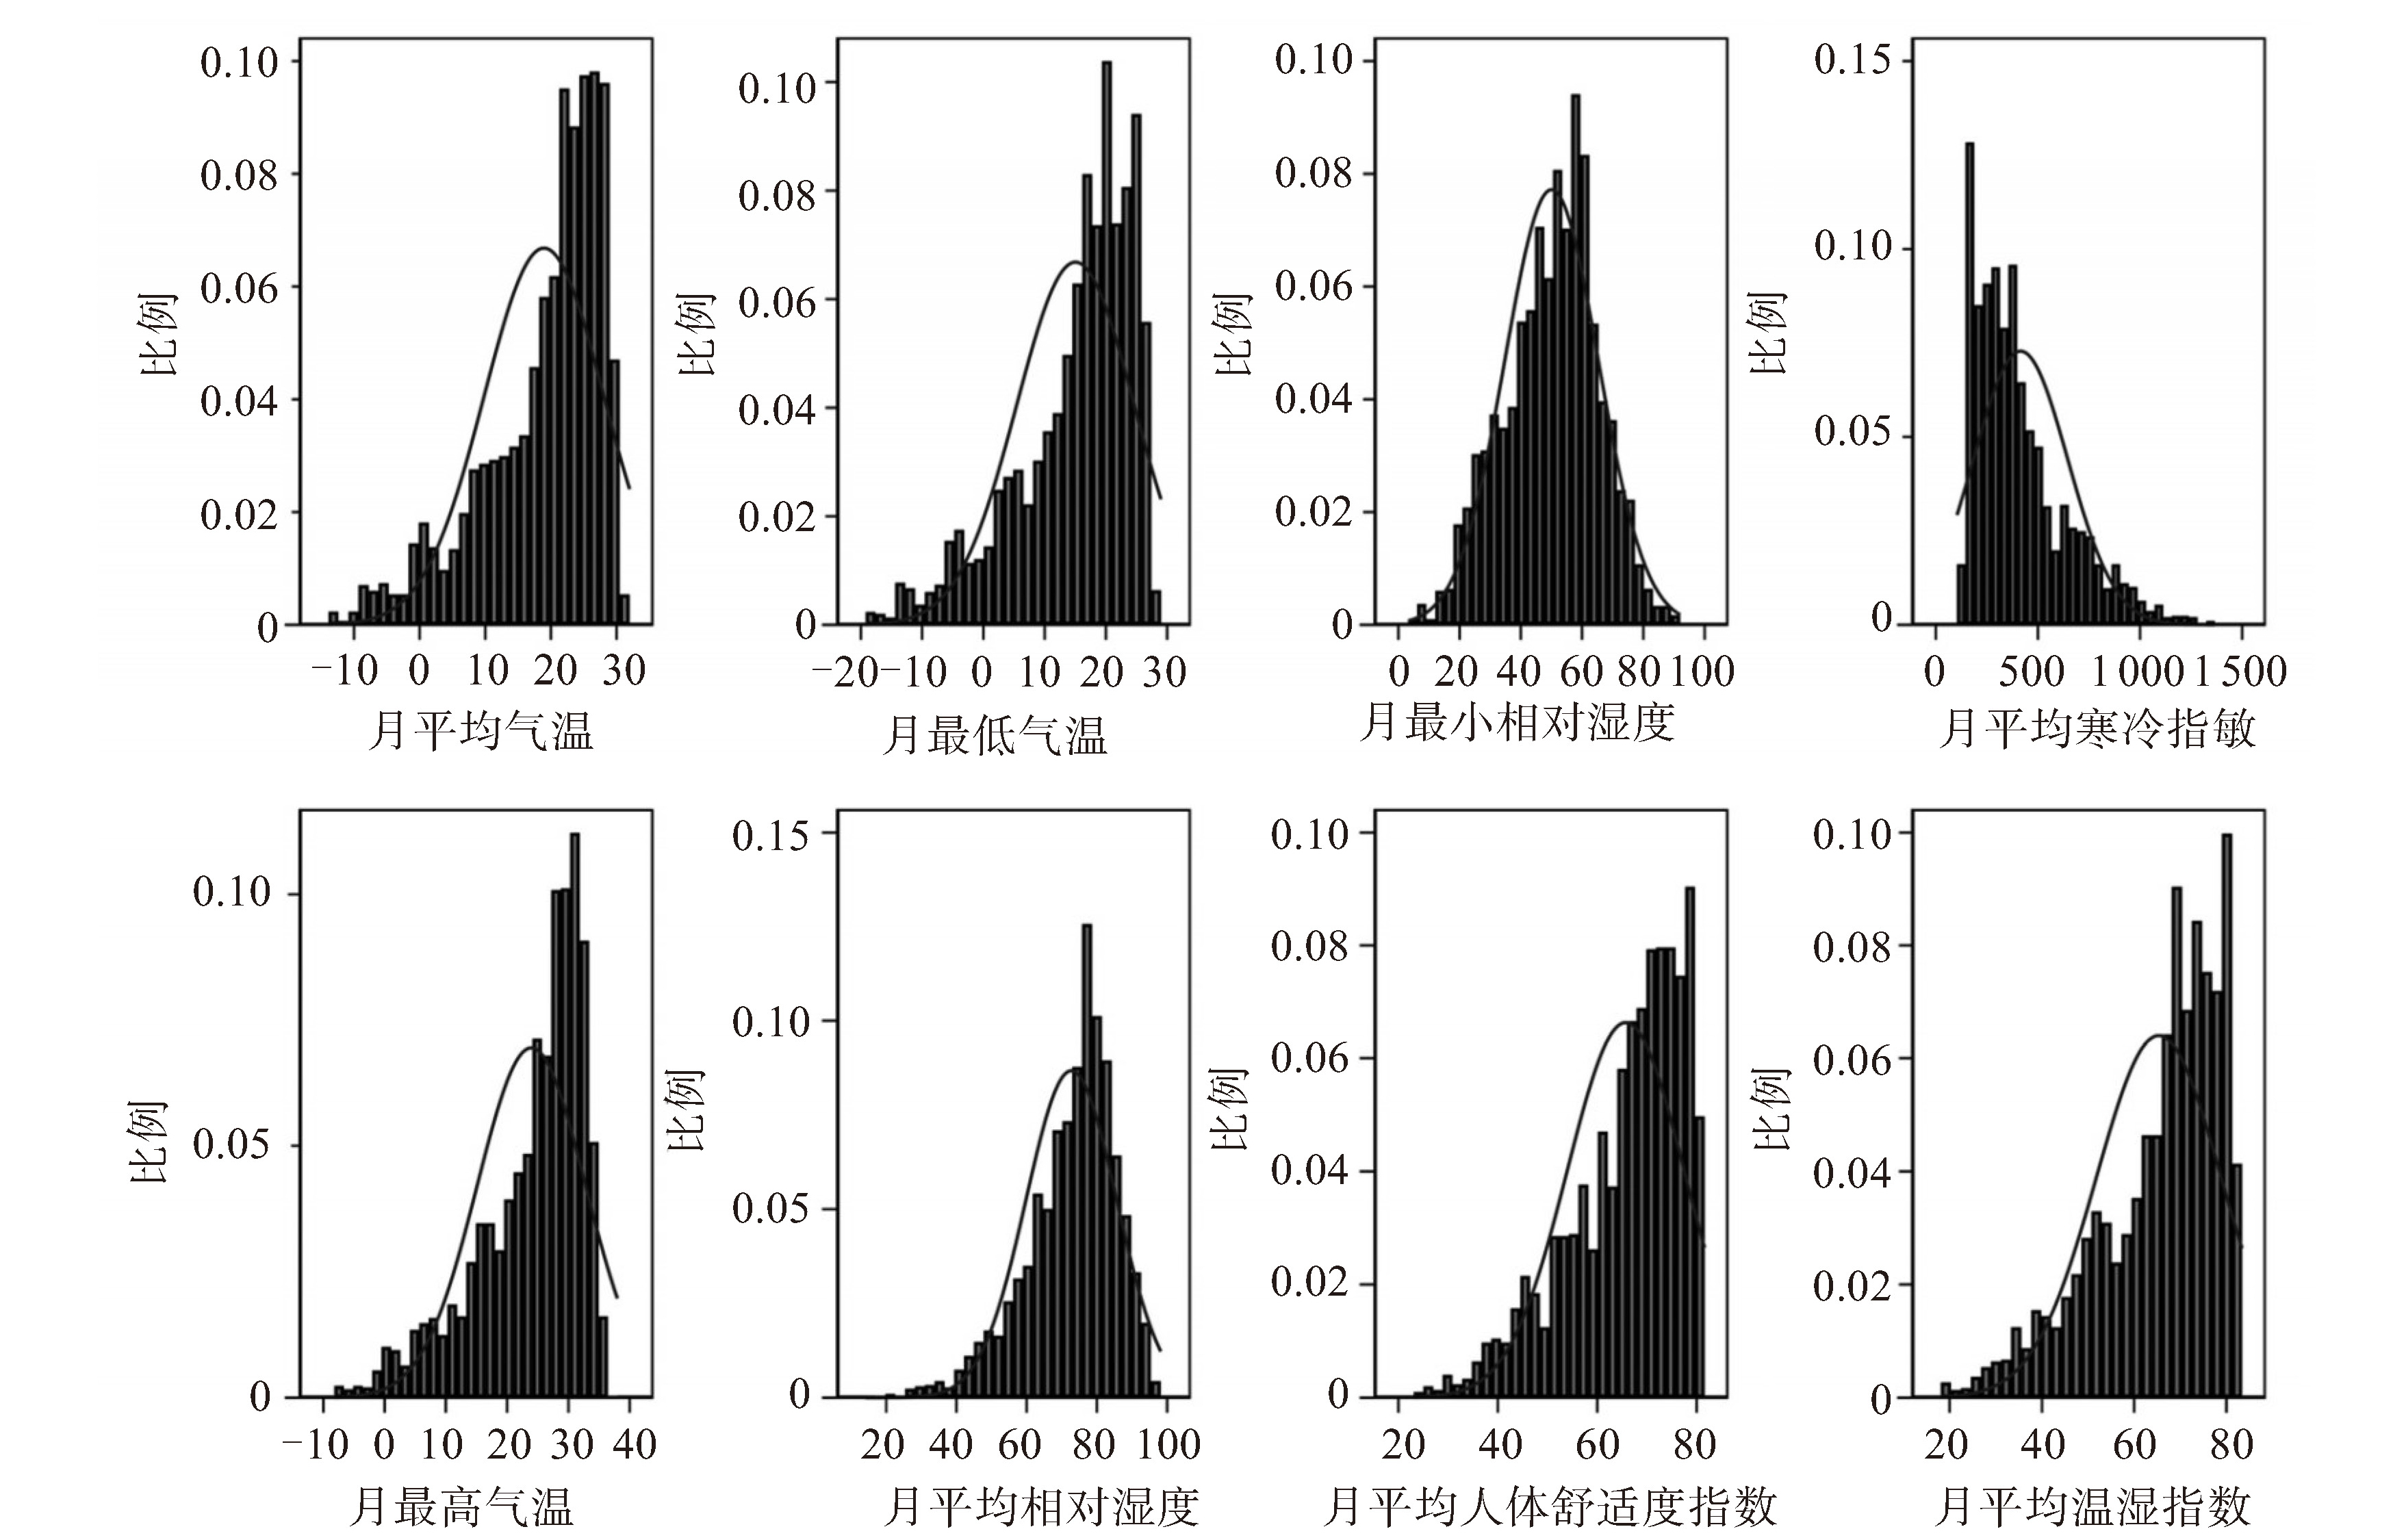
变量 均值 标准差 观测组 月平均气温/°c 23.98 5.24 1 413 月最高气温/℃ 28.83 5.09 1 413 月最低气温/C 20.23 5.72 1 413 月平均相对湿度/% 76.40 11.62 1 413 月最小相对湿度/% 54.05 13.71 1 413 月平均人体舒适度指数 72.35 7.38 1 413 月平均寒冷指数 296.70 147.70 1 413 月平均温湿指数 73.04 8.18 1 413
下载: 导出CSV
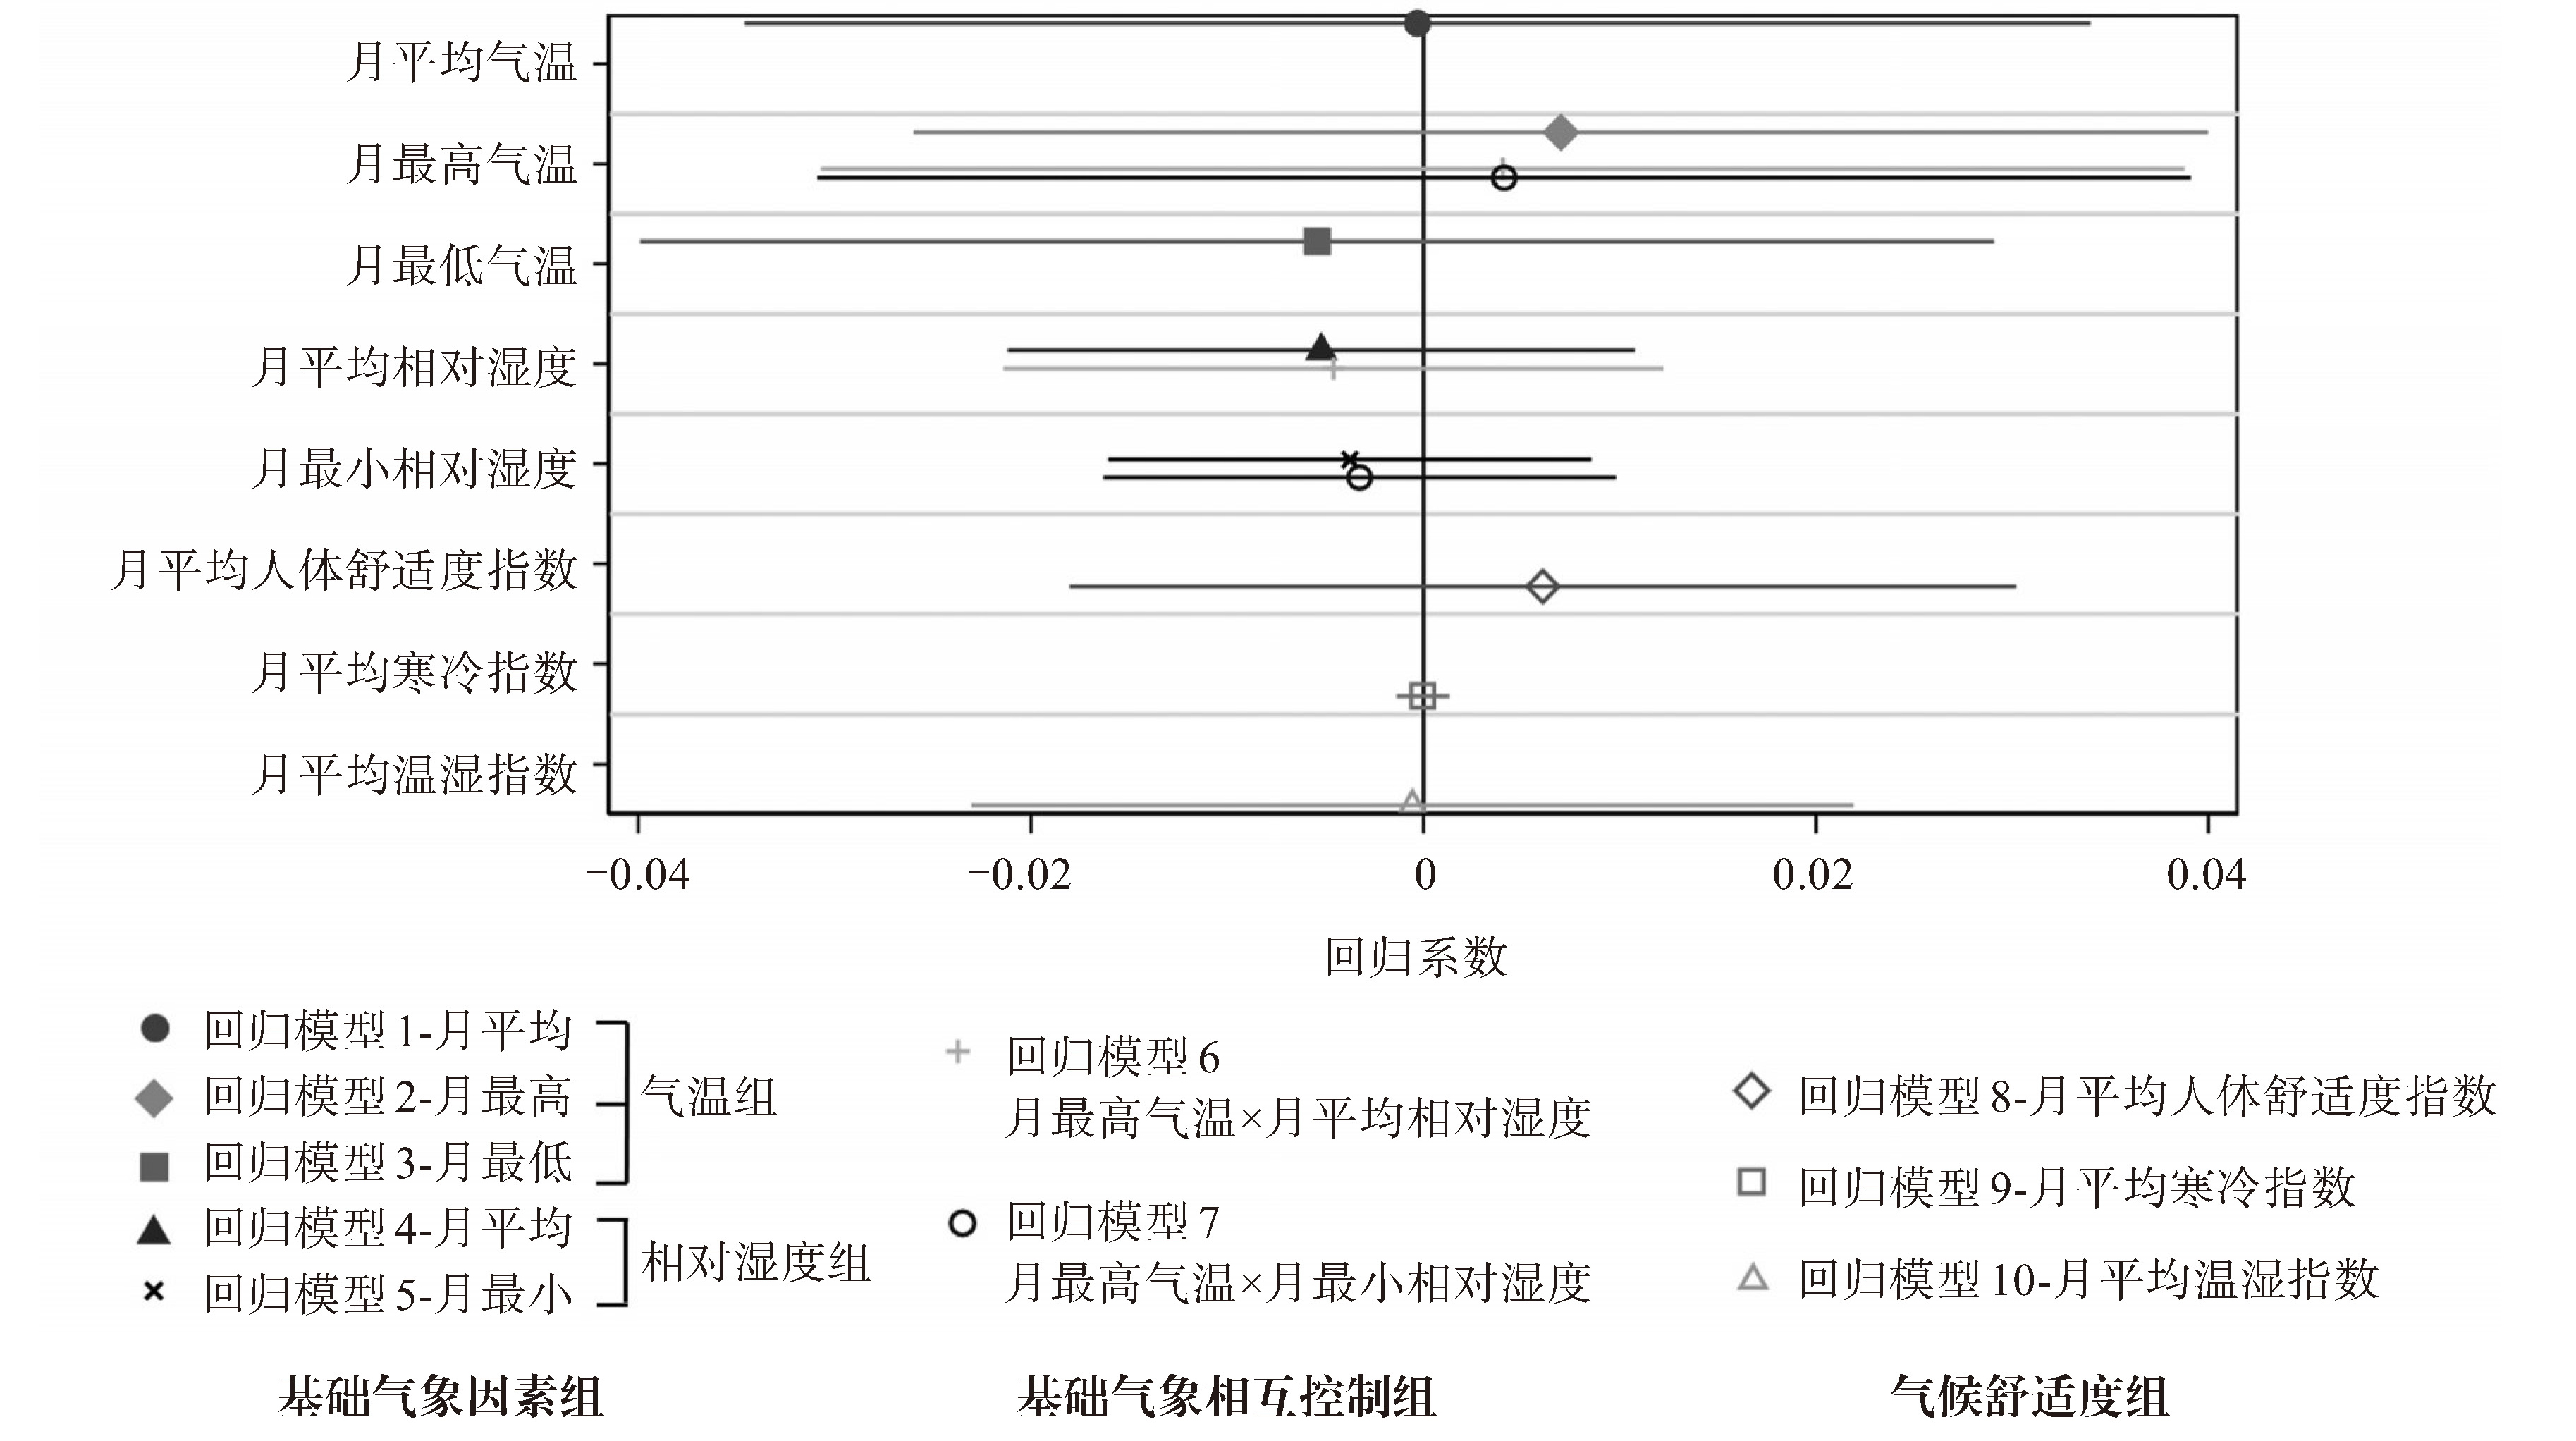
表 3 春夏季节CFPS全国城市居民抑郁水平回归结果
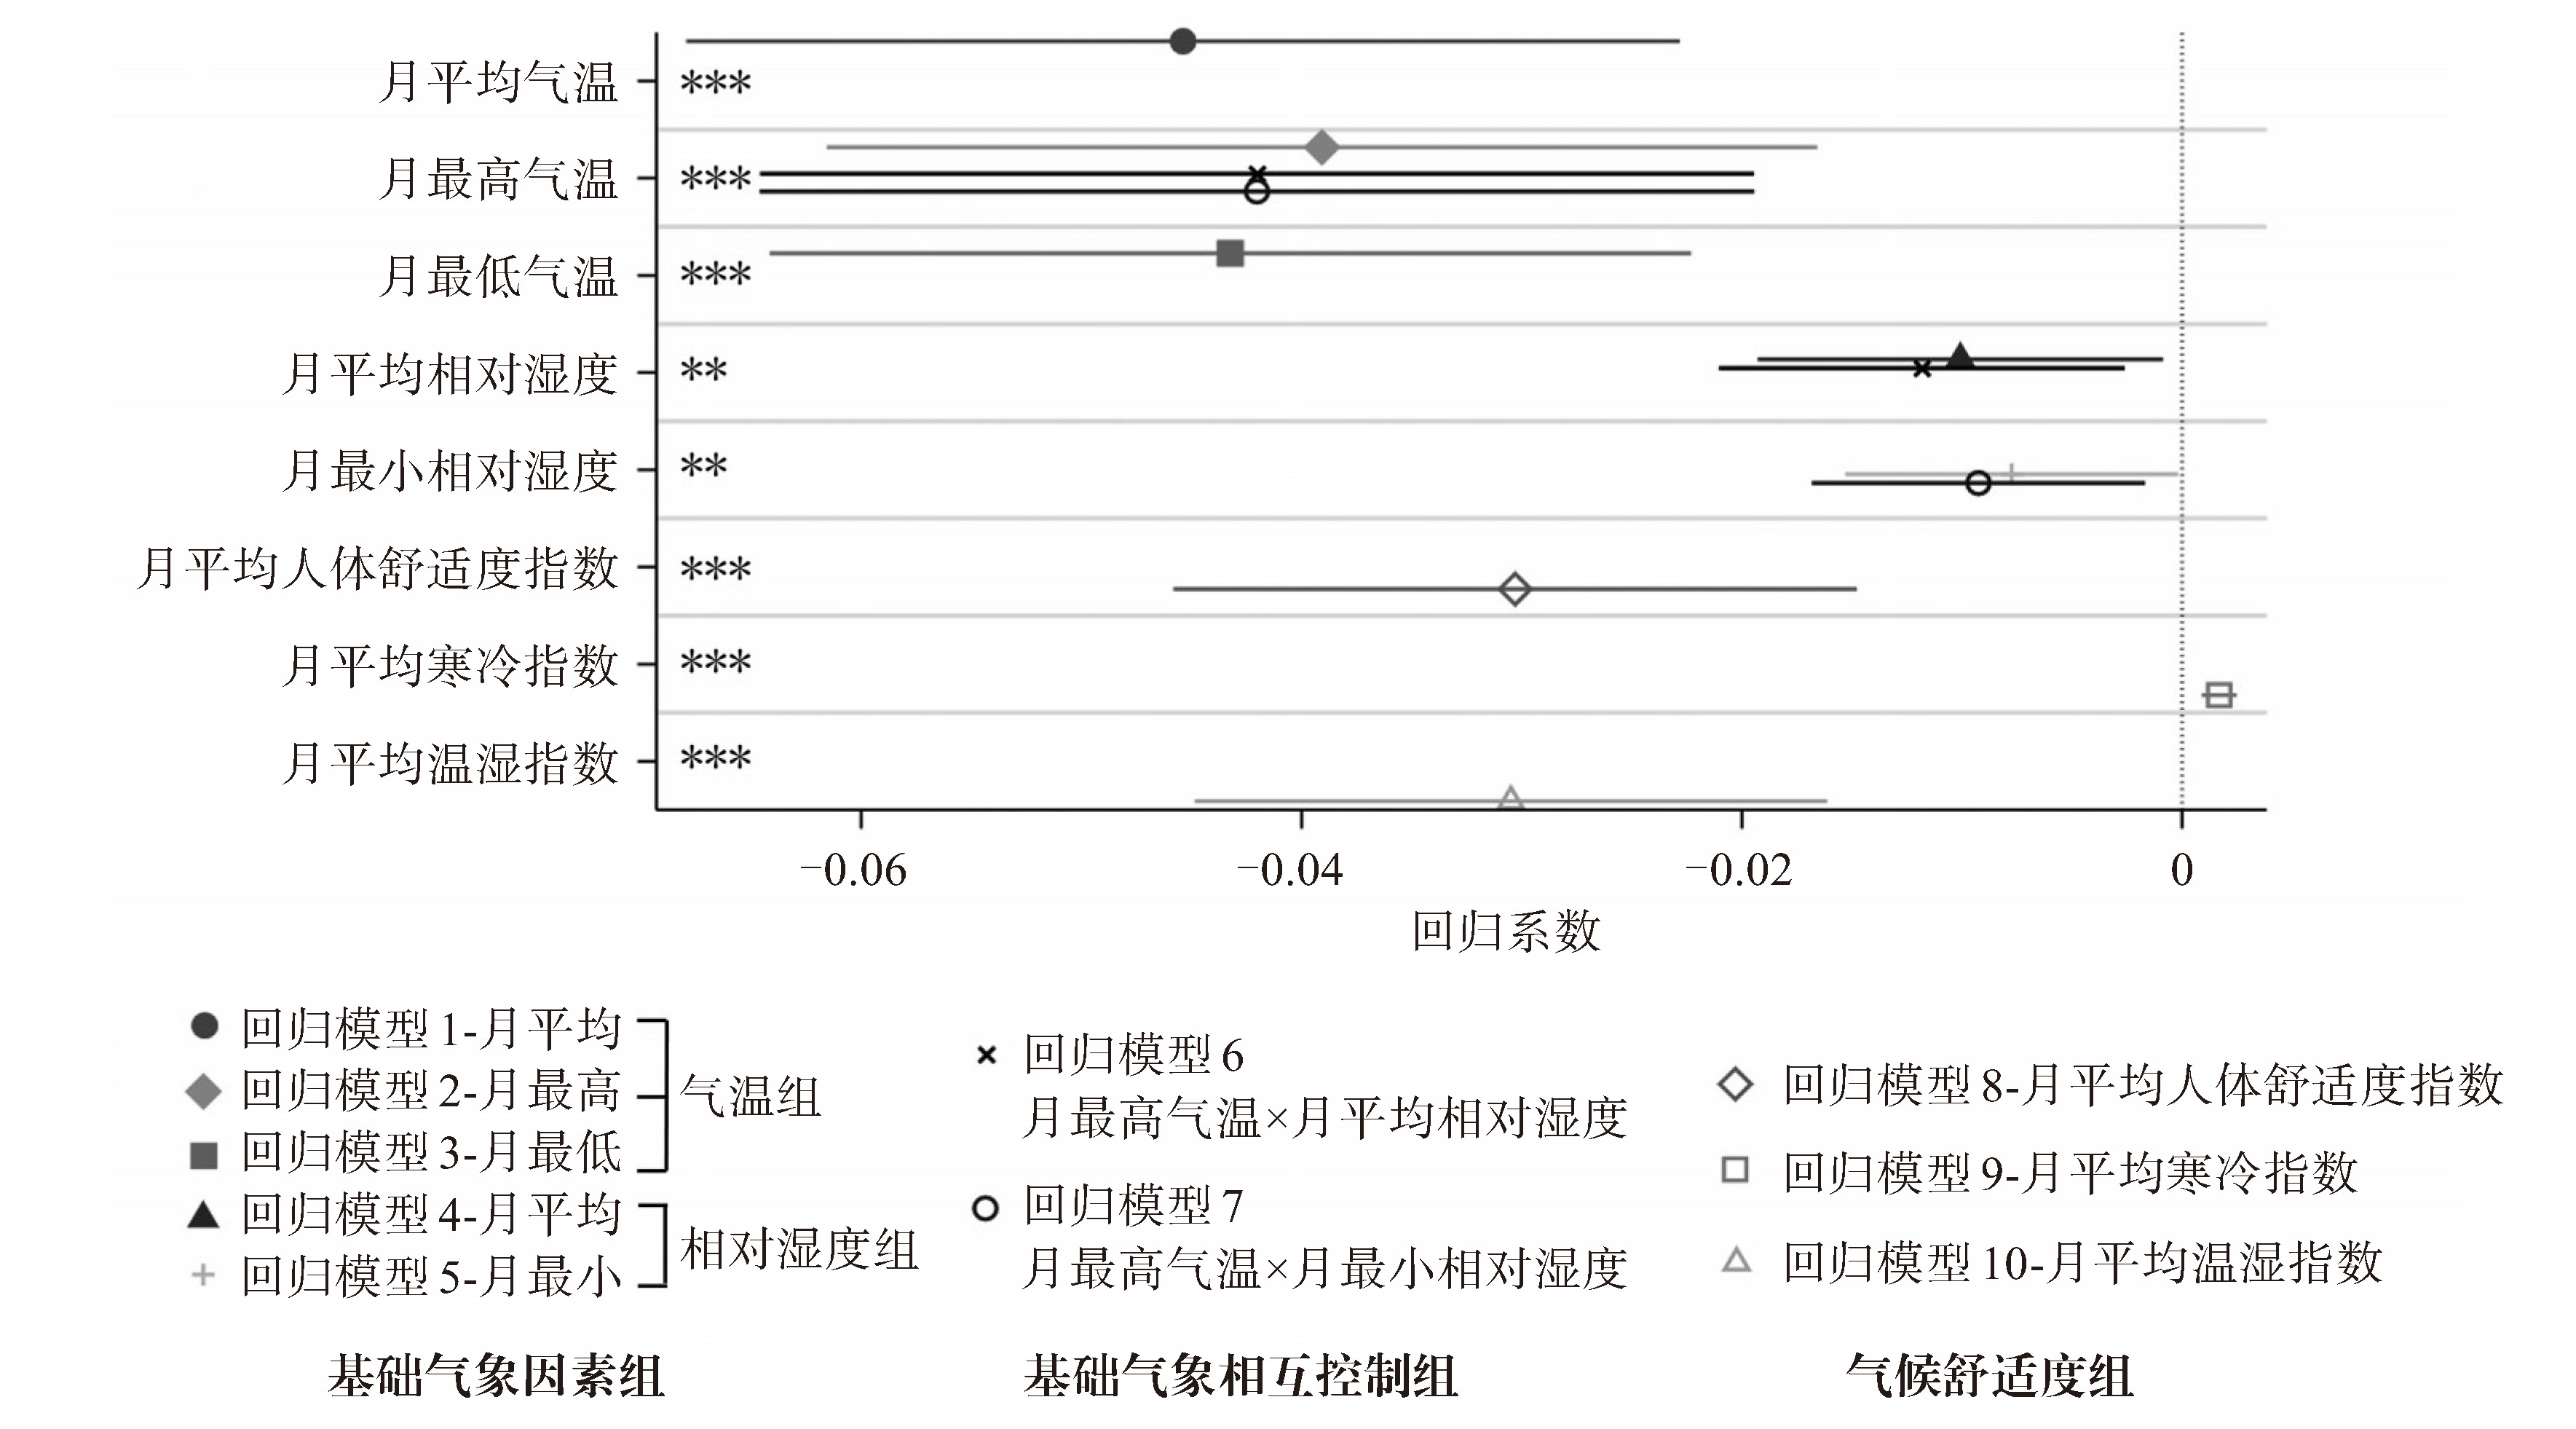
变量 回归模型1 回归模型2 回归模型3 回归模型4 回归模型5 回归模型6 回归模型7 回归模型8 回归模型9 回归模型10 年龄 0.012(0.01) 0.012(0.01) 0.011(0.01) 0.012(0.01) 0.012(0.01) 0.011(0.01) 0.011(0.01) 0.012(0.01) 0.011(0.01) 0.012(0.01) 性别 -0.510**(0.20) -0.502**(0.20) -0.512**(0.20) -0.520**(0.20) -0.515**(0.20) -0.533***(0.20) -0.528***(0.20) -0.512**(0.20) -0.518**(0.20) -0.514**(0.20) 婚姻状态 0.477*(0.25) 0.468*(0.25) 0.487**(0.25) 0.468*(0.25) 0.479*(0.25) 0.459*(0.25) 0.472*(0.25) 0.471*(0.25) 0.477*(0.25) 0.482**(0.25) 教育水平 -0.167***(0.06) -0.173***(0.06) -0.163***(0.06) -0.158***(0.06) -0.156***(0.06) -0.167***(0.06) -0.164***(0.06) -0.172***(0.06) -0.171***(0.06) -0.164***(0.06) 农村户籍 0.323*(0.17) 0.323*(0.17) 0.328*(0.17) 0.307*(0.17) 0.309*(0.17) 0.311*(0.17) 0.314*(0.17) 0.323*(0.17) 0.319*(0.17) 0.324*(0.17) 健康水平 0.358***(0.07) 0.356***(0.07) 0.361***(0.07) 0.371***(0.07) 0.371***(0.07) 0.364***(0.07) 0.364***(0.07) 0.357***(0.07) 0.359***(0.07) 0.359***(0.07) 月平均气温 -0.045***(0.01) 月最高气温 -0.039***(0.01) -0.042***(0.01) -0.042***(0.01) 月最低气温 -0.043***(0.01) 月平均相对湿度 -0.010**(0.00) -0.012**(0.00) 月最小相对湿度 -0.008**(0.00) -0.009**(0.00) 月平均人体舒适度指数 -0.030***(0.01) 月平均寒冷指数 0.002***(0.00) 月平均温湿指数 -0.030***(0.01) 常数项 12.463***(0.69) 12.530***(0.72) 12.224***(0.66) 12.059***(0.72) 11.693***(0.66) 13.495***(0.82) 13.074***(0.75) 13.590***(0.86) 10.927***(0.63) 13.575***(0.83) 观测值 1413 1413 1413 1413 1413 1413 1413 1413 1413 1413 R2 0.08 0.07 0.08 0.07 0.07 0.08 0.08 0.08 0.08 0.08 注:括号内为标准误差。*p < 0.1,**p < 0.05,***p < 0.01。
下载: 导出CSV
表 4 春夏季节CFPS北方城市居民抑郁水平回归结果
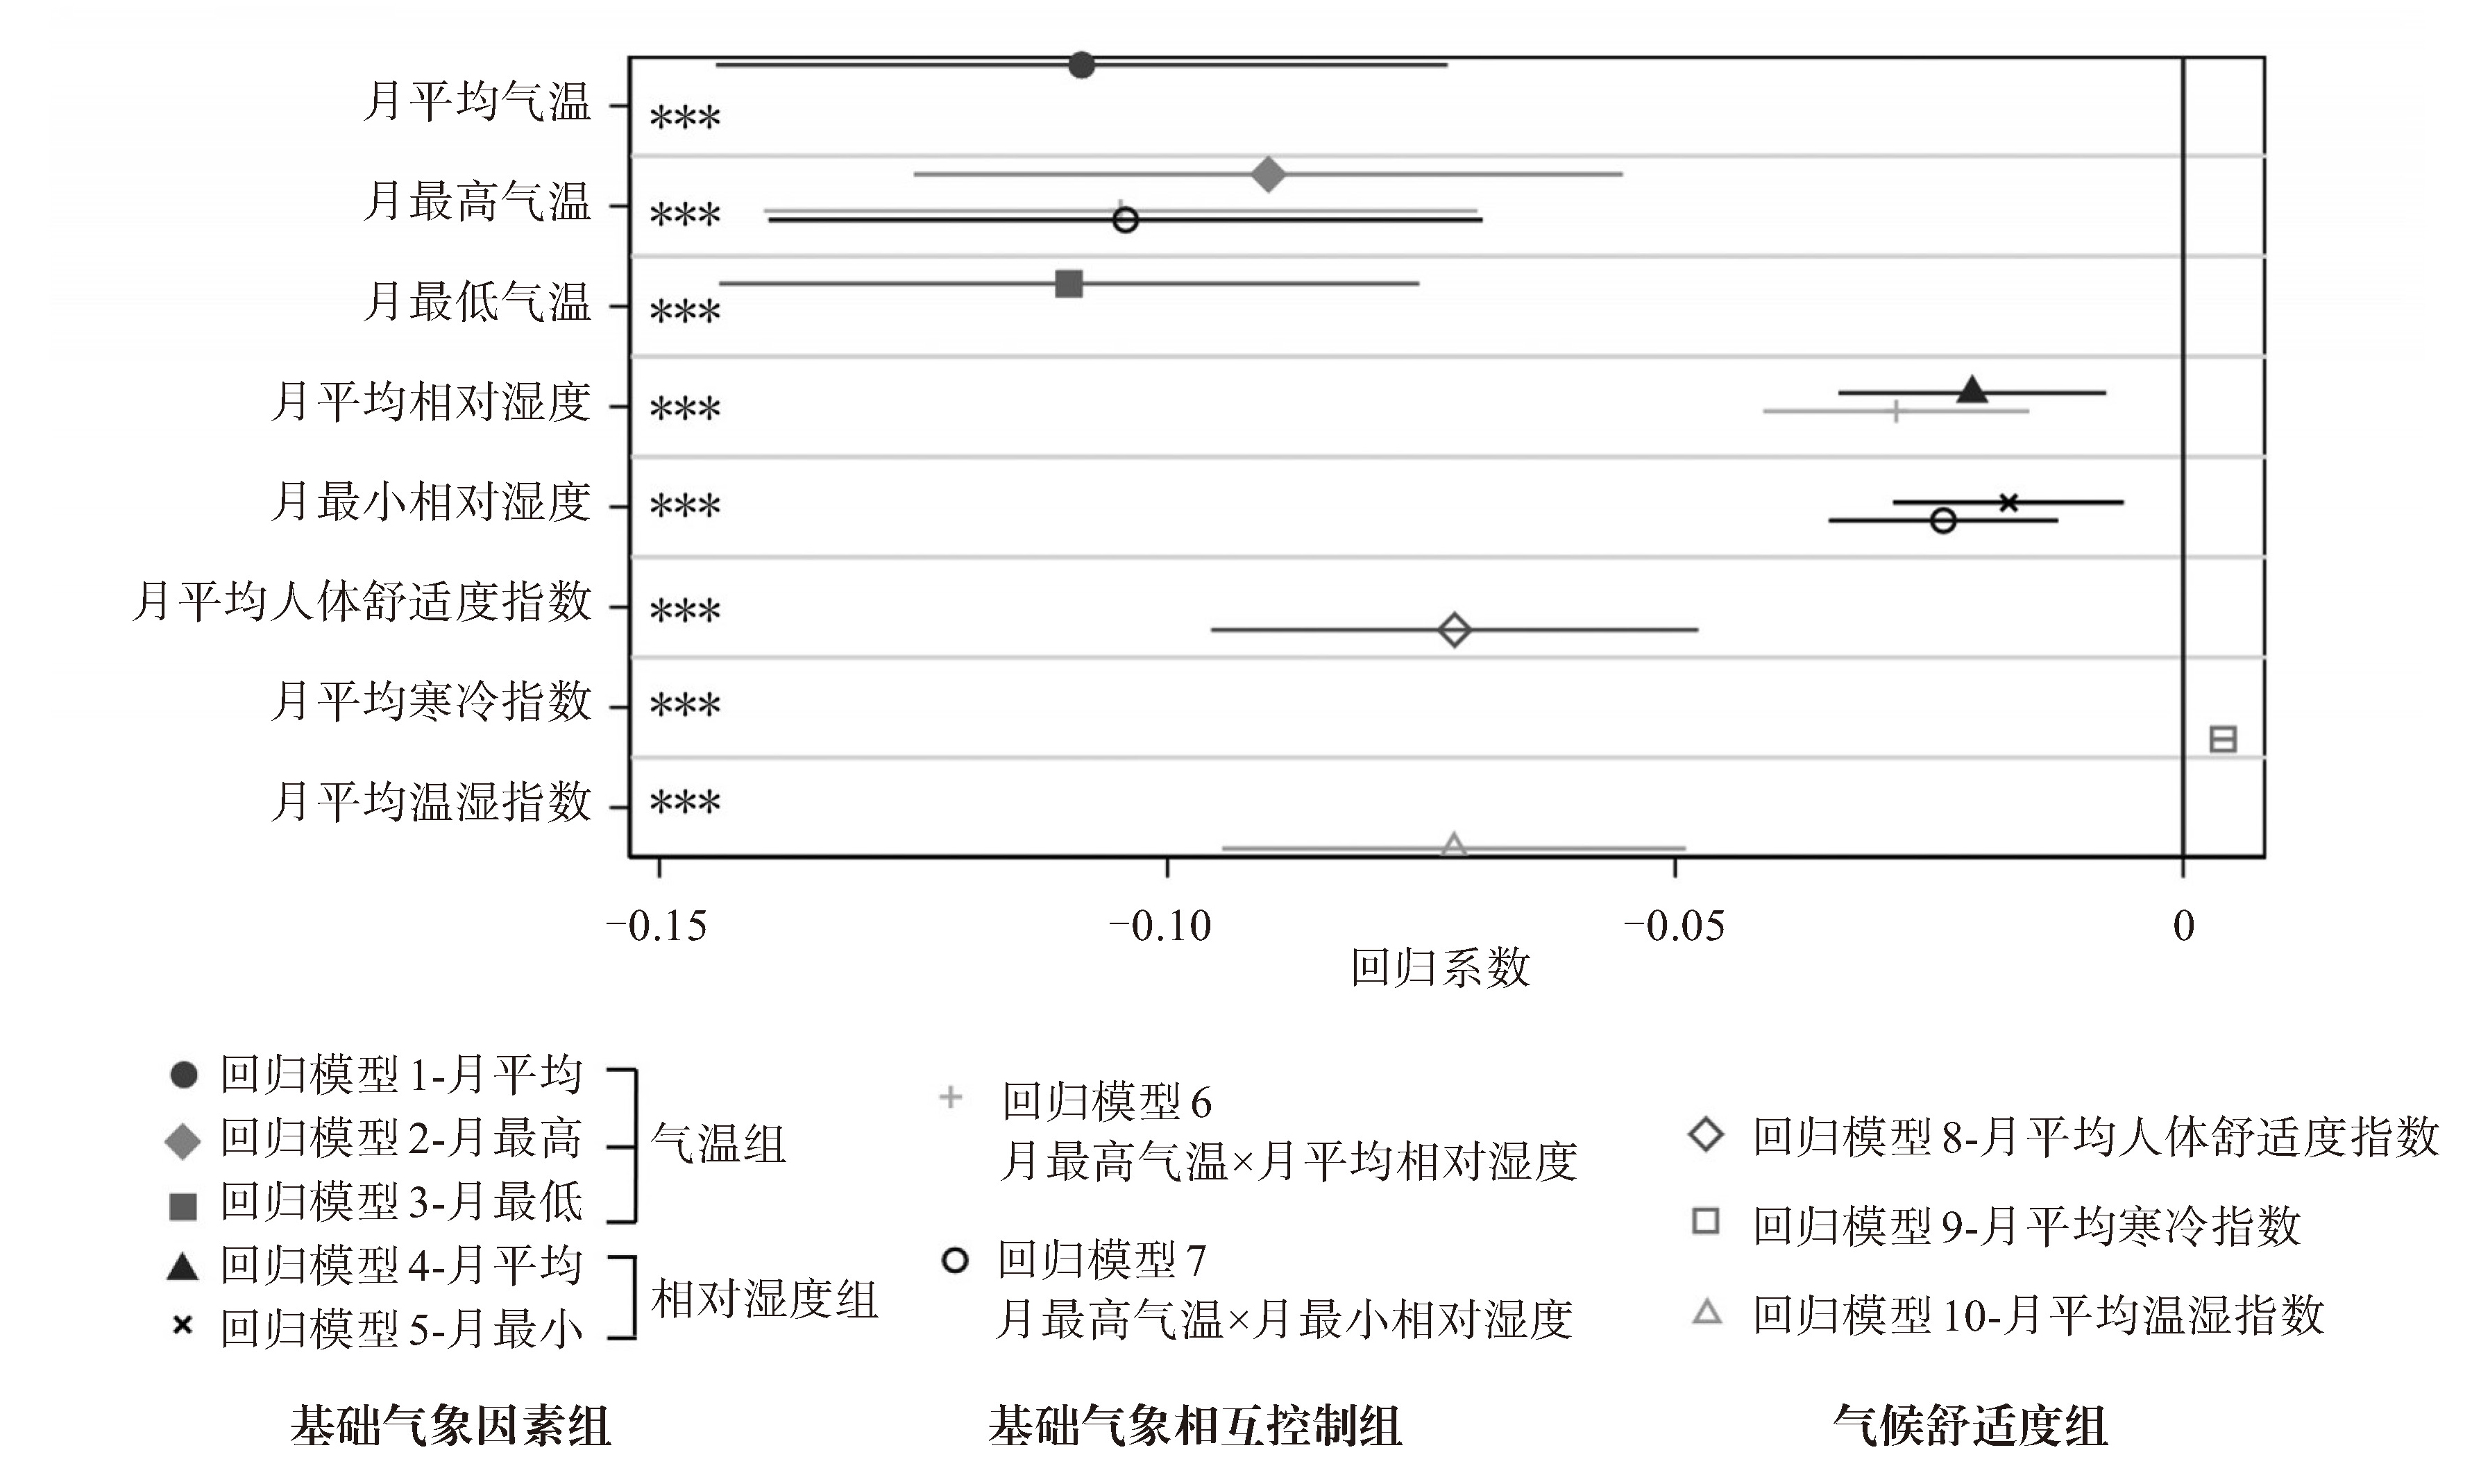
变量 回归模型1 回归模型2 回归模型3 回归模型4 回归模型5 回归模型6 回归模型7 回归模型8 回归模型9 回归模型10 年龄 0.010(0.01) 0.009(0.01) 0.010(0.01) 0.010(0.01) 0.010(0.01) 0.012(0.01) 0.012(0.01) 0.010(0.01) 0.010(0.01) 0.011(0.01) 性别 -0.302(0.28) -0.283(0.29) -0.304(0.28) -0.312(0.29) -0.307(0.29) -0.365(0.28) -0.359(0.28) -0.320(0.28) -0.319(0.28) -0.326(0.28) 婚姻状态 0.872**(0.35) 0.875**(0.35) 0.871**(0.35) 0.881**(0.36) 0.906**(0.36) 0.797**(0.35) 0.831**(0.35) 0.867**(0.35) 0.886**(0.35) 0.870**(0.35) 教育水平 -0.072(0.08) -0.109(0.08) -0.037(0.08) -0.096(0.08) -0.088(0.08) -0.067(0.08) -0.056(0.08) -0.094(0.08) -0.070(0.08) -0.061(0.08) 农村户籍 0.369(0.24) 0.346(0.24) 0.441*(0.24) 0.465*(0.24) 0.481**(0.24) 0.357(0.24) 0.380(0.24) 0.318(0.24) 0.345(0.24) 0.372(0.24) 健康水平 0.403***(0.11) 0.391***(0.11) 0.414***(0.11) 0.429***(0.11) 0.431***(0.11) 0.420***(0.11) 0.422***(0.11) 0.401***(0.11) 0.407***(0.11) 0.409***(0.11) 月平均气温 -0.108***(0.02) 月最高气温 -0.090***(0.02) -0.105***(0.02) -0.104***(0.02) 月最低气温 -0.110***(0.02) 月平均相对湿度 -0.021***(0.01) -0.028***(0.01) 月最小相对湿度 -0.017***(0.01) -0.024***(0.01) 月平均人体舒适度指数 -0.072***(0.01) 月平均寒冷指数 0.004***(0.00) 月平均温湿指数 -0.072***(0.01) 常数项 13.047***(0.95) 13.370***(1.01) 12.331***(0.90) 12.136***(0.98) 11.410***(0.91) 15.456***(1.11) 14.460***(1.03) 15.796***(1.21) 9.264***(0.91) 15.574***(1.16) 观测值 689 689 689 689 689 689 689 689 689 689 R2 0.12 0.11 0.13 0.09 0.09 0.13 0.13 0.12 0.13 0.13 注:括号内为标准误差。*p < 0.1,**p < 0.05,***p < 0.01。
下载: 导出CSV
表 5 春夏季节CFPS南方城市居民抑郁水平回归结果
变量 回归模型1 回归模型2 回归模型3 回归模型4 回归模型5 回归模型6 回归模型7 回归模型8 回归模型9 回归模型10 年龄 0.024*(0.01) 0.024*(0.01) 0.024*(0.01) 0.024*(0.01) 0.024*(0.01) 0.024*(0.01) 0.024*(0.01) 0.024*(0.01) 0.024*(0.01) 0.024*(0.01) 性别 -0.410(0.27) -0.409(0.27) -0.413(0.27) -0.415(0.27) -0.416(0.27) -0.409(0.27) -0.410(0.27) -0.412(0.27) -0.413(0.27) -0.411(0.27) 婚姻状态 0.479(0.33) 0.474(0.33) 0.489(0.33) 0.488(0.33) 0.491(0.33) 0.474(0.33) 0.474(0.33) 0.477(0.33) 0.492(0.33) 0.476(0.33) 教育水平 -0.144*(0.08) -0.138*(0.08) -0.147*(0.08) -0.145*(0.08) -0.142*(0.08) -0.138*(0.08) -0.138*(0.08) -0.137*(0.08) -0.145*(0.08) -0.144*(0.08) 农村户籍 0.068(0.22) 0.050(0.22) 0.081(0.22) 0.080(0.22) 0.078(0.22) 0.049(0.22) 0.050(0.22) 0.045(0.22) 0.078(0.22) 0.067(0.22) 健康水平 0.299***(0.10) 0.301***(0.10) 0.299***(0.10) 0.302***(0.10) 0.304***(0.10) 0.301***(0.10) 0.302***(0.10) 0.300***(0.10) 0.299***(0.10) 0.299***(0.10) 月平均气温 0.014(0.02) 月最高气温 0.024(0.02) 0.025(0.02) 0.024(0.02) 月最低气温 0.004(0.02) 月平均相对湿度 -0.004(0.01) 0.001(0.01) 月最小相对湿度 -0.004(0.01) -0.001(0.01) 月平均人体舒适指数 0.018(0.01) 月平均寒冷指数 0.000(0.00) 月平均温湿指数 0.010(0.01) 常数项 10.940***(0.96) 10.545***(0.99) 11.194***(0.93) 11.620***(1.04) 11.512***(0.89) 10.436***(1.38) 10.601***(1.17) 9.944***(1.26) 11.330***(0.86) 10.537***(1.23) 观测值 724 724 724 724 724 724 724 724 724 724 R2 0.11 0.11 0.11 0.11 0.11 0.11 0.11 0.11 0.11 0.11 注:括号内为标准误差。*p < 0.1,**p < 0.05,***p < 0.01。
下载: 导出CSV
表 6 春夏季节CFPS全国城市月度气象变量滞后一期
变量名称 均值 标准差 观测组 月平均气温/C 22.72 6.25 1 413 月最高气温/C 27.67 6.08 1 413 月最低气温/C 18.72 6.74 1 413 月平均相对湿度/% 73.12 13.45 1 413 月最小相对湿度/% 51.12 15.92 1 413 月平均人体舒适度指数 70.33 8.54 1 413 月平均寒冷指数 335.10 171.30 1 413 月平均温湿指数 70.86 9.53 1 413
下载: 导出CSV
表 7 春夏季节CFPS全国城市居民抑郁水平的滞后效应
变量 回归模型1 回归模型2 回归模型3 回归模型4 回归模型5 回归模型6 回归模型7 回归模型8 回归模型9 回归模型10 年龄 0.012(0.01) 0.012(0.01) 0.012(0.01) 0.012(0.01) 0.012(0.01) 0.012(0.01) 0.012(0.01) 0.012(0.01) 0.011(0.01) 0.012(0.01) 性别 -0.530***(0.20) -0.521***(0.20) -0.533***(0.20) -0.538***(0.20) -0.525***(0.20) -0.555***(0.20) -0.542***(0.20) -0.525***(0.20) -0.538***(0.20) -0.528***(0.20) 婚姻状态 0.483**(0.25) 0.473*(0.25) 0.497**(0.25) 0.500**(0.25) 0.504**(0.25) 0.496**(0.25) 0.500**(0.25) 0.484**(0.25) 0.491**(0.25) 0.491**(0.25) 教育水平 -0.165***(0.06) -0.170***(0.06) -0.161***(0.06) -0.156***(0.06) -0.155***(0.06) -0.163***(0.06) -0.162***(0.06) -0.170***(0.06) -0.168***(0.06) -0.165***(0.06) 农村户籍 0.321*(0.17) 0.320*(0.17) 0.323*(0.17) 0.293*(0.17) 0.295*(0.17) 0.303*(0.17) 0.305*(0.17) 0.318*(0.17) 0.315*(0.17) 0.320*(0.17) 健康水平 0.358***(0.07) 0.355***(0.07) 0.362***(0.07) 0.373***(0.07) 0.373***(0.07) 0.365***(0.07) 0.365***(0.07) 0.358***(0.07) 0.360***(0.07) 0.361***(0.07) 月平均气温 -0.039***(0.01) 月最高气温 -0.033***(0.01) -0.033***(0.01) -0.033***(0.01) 月最低气温 -0.038***(0.01) 月平均相对湿度 -0.012***(0.00) -0.012***(0.00) 月最小相对湿度 -0.009***(0.00) -0.009***(0.00) 月平均人体舒适度指数 -0.026***(0.01) 月平均寒冷指数 0.002***(0.00) 月平均温湿指数 -0.026***(0.01) 常数项 12.250***(0.68) 12.286***(0.71) 12.060***(0.66) 12.151***((0.69) 11.724***(0.65) 13.147***(0.76) 12.726***(0.72) 13.227***(0.84) 10.880***(0.63) 13.200***(0.81) 观测值 1413 1413 1413 1413 1413 1413 1413 1413 1413 1413 R2 0.08 0.07 0.08 0.07 0.07 0.08 0.08 0.07 0.08 0.08 注:括号内为标准误差。*p < 0.1,**p < 0.05,***p < 0.01。
下载: 导出CSV
表 8 春夏季节CFPS北方城市的居民抑郁水平的滞后效应
变量 回归模型1 回归模型2 回归模型3 回归模型4 回归模型5 回归模型6 回归模型7 回归模型8 回归模型9 回归模型10 年龄 0.010(0.01) 0.009(0.01) 0.010(0.01) 0.010(0.01) 0.010(0.01) 0.013(0.01) 0.013(0.01) 0.010(0.01) 0.010(0.01) 0.010(0.01) 性别 -0.275(0.28) -0.252(0.29) -0.288(0.28) -0.325(0.29) -0.306(0.29) -0.351(0.28) -0.327(0.28) -0.284(0.28) -0.312(0.28) -0.287(0.28) 婚姻状态 0.809**(0.35) 0.824**(0.35) 0.821**(0.35) 0.959***(0.36) 0.959***(0.36) 0.836**(0.35) 0.840**(0.35) 0.834**(0.35) 0.867**(0.35) 0.807**(0.35) 教育水平 -0.088(0.08) -0.125(0.08) -0.042(0.08) -0.083(0.08) -0.082(0.08) -0.065(0.08) -0.062(0.08) -0.109(0.08) -0.076(0.08) -0.077(0.08) 农村户籍 0.398*(0.24) 0.377(0.24) 0.452*(0.24) 0.454*(0.24) 0.460*(0.24) 0.374(0.24) 0.384(0.24) 0.338(0.24) 0.353(0.24) 0.390(0.24) 健康水平 0.399***(0.11) 0.386***(0.11) 0.418***(0.11) 0.433***(0.11) 0.432***(0.11) 0.418***(0.11) 0.418***(0.11) 0.398***(0.11) 0.413***(0.11) 0.410***(0.11) 月平均气温 -0.106***(0.02) 月最高气温 -0.084***(0.02) -0.104***(0.02) -0.103***(0.02) 月最低气温 -0.112***(0.02) 月平均相对湿度 -0.021***(0.01) -0.029***(0.01) 月最小相对湿度 -0.017***(0.01) -0.024***(0.01) 月平均人体舒适度指数 -0.072***(0.01) 月平均寒冷指数 0.004***(0.00) 月平均温湿指数 -0.075***(0.01) 常数项 12.936***(0.95) 13.206***(1.01) 12.207***(0.90) 11.911***(0.94) 11.241***(0.90) 15.186***(1.07) 14.216***(1.02) 15.744***(1.22) 9.132***(0.92) 15.675***(1.18) 观测值 689 689 689 689 689 689 689 689 689 689 R2 0.12 0.11 0.13 0.09 0.09 0.14 0.13 0.12 0.13 0.12 注:括号内为标准误差。*p < 0.1,**p < 0.05,***p < 0.01。
下载: 导出CSV
表 9 春夏季节CFPS南方城市的居民抑郁水平的滞后效应
变量 回归模型1 回归模型2 回归模型3 回归模型4 回归模型5 回归模型6 回归模型7 回归模型8 回归模型9 回归模型10 年龄 0.020(0.01) 0.020(0.01) 0.020(0.01) 0.019(0.01) 0.019(0.01) 0.019(0.01) 0.019(0.01) 0.020(0.01) 0.020(0.01) 0.020(0.01) 性别 -0.638**(0.29) -0.627**(0.29) -0.647**(0.29) -0.649**(0.28) -0.639**(0.28) -0.646**(0.29) -0.638**(0.29) -0.629**(0.29) -0.641**(0.29) -0.636**(0.29) 婚姻状态 0.179(0.35) 0.171(0.35) 0.189(0.35) 0.162(0.35) 0.174(0.35) 0.160(0.35) 0.173(0.35) 0.172(0.35) 0.179(0.35) 0.178(0.35) 教育水平 -0.187**(0.08) -0.188**(0.08) -0.187**(0.08) -0.181**(0.08) -0.180**(0.08) -0.181**(0.08) -0.180**(0.08) -0.187**(0.08) -0.188**(0.08) -0.187**(0.08) 农村户籍 0.278(0.24) 0.263(0.24) 0.285(0.24) 0.244(0.24) 0.243(0.24) 0.240(0.24) 0.242(0.24) 0.263(0.24) 0.284(0.24) 0.276(0.24) 健康水平 0.340***(0.01) 0.343***(0.01) 0.339***(0.01) 0.347***(0.01) 0.349***(0.01) 0.348***(0.01) 0.349***(0.01) 0.342***(0.01) 0.339***(0.01) 0.341***(0.01) 月平均气温 -0.004(0.02) 月最高气温 0.005(0.02) 0.002(0.02) 0.001(0.02) 月最低气温 -0.012(0.02) 月平均相对湿度 -0.012*(0.01) -0.011*(0.01) 月最小相对湿度 -0.009*(0.01) -0.009(0.01) 月平均人体舒适度指数 0.003(0.01) 月平均寒冷指数 0.000(0.01) 月平均温湿指数 -0.002(0.01) 常数项 11.426***(0.98) 11.191***(1.01) 11.564***(0.96) 12.267***(1.07) 11.836***(0.96) 12.200***(1.18) 11.801***(1.08) 11.088***(1.21) 11.247***(0.92) 11.478***(1.17) 观测值 724 724 724 724 724 724 724 724 724 724 R2 0.09 0.09 0.09 0.1 0.1 0.1 0.1 0.09 0.09 0.09 注:括号内为标准误差。*p<0.1,**p<0.05,***p<0.01。
下载: 导出CSV
-
[1] HAYES K, BLASHKI G, WISEMAN J, et al. Climate change and mental health: risks, impacts and priority actions[J]. International Journal of Mental Health Systems, 2018, 12: 1-12. [2] HAYES K, POLAND B. Addressing mental health in a changing climate: Incorporating mental health indicators into climate change and health vulnerability and adaptation assessments[J]. International Journal of Environmental Research and Public Health, 2018, 15(9): 1 806. [3] WATTS N, AMANN M, AYEB-KARLSSON S, et al. The Lancet Countdown on health and climate change: From 25 years of inaction to a global transformation for public health[J]. Lancet, 2018, 391(10120): 581-630. [4] HWONG A R, WANG M, KHAN H, et al. Climate change and mental health research methods, gaps, and priorities: A scoping review[J]. The Lancet Planetary Health, 2022, 6(3): e281-e291. [5] 鲍枫, 潘伟刚, 毛佩贤, 等. 中重度晚发抑郁症患者的神经认知功能损害[J]. 中国心理卫生杂志, 2017, 31(6): 442-446. [6] ROSENTHAL N E, SACK D A, GILLIN J C, et al. Seasonal affective disorder: A description of the syndrome and preliminary findings with light therapy[J]. Archives of General Psychiatry, 1984, 41(1): 72-80. [7] ROSENTHAL N E, WEHR T A. Seasonal affective disorders[J]. Psychiatric Annals, 1987, 17(10): 670-674. [8] World Health Organization[R]. Depression and other common mental disorders: Global health estimates, 2017. [9] BAI R, DONG W, PENG Q, et al. Trends in depression incidence in China, 1990-2019[J]. Journal of Affective Disorders, 2022, 296, 291-297. [10] LU J, XU X, HUANG Y, et al. Prevalence of depressive disorders and treatment in China: A cross-sectional epidemiological study[J]. The Lancet Psychiatry, 2021, 8(11), 981-990. [11] NICOL J F, HUMPHREYS M A. Thermal comfort as part of a self-regulating system[J]. Journal of International Council for Research and Innovation in Building and Construction, 1973, 6(3): 191-197. [12] YU J, ZHU Y X, OU Y Q, et al. Experimental study on the effects of climatic characteristics on people's adaptability to thermal environment[J]. Journal of Southeast University (English Edition), 2010, 26(2): 279-282. [13] 江燕涛, 杨昌智, 李文菁, 等. 非空调环境下性别与热舒适的关系[J]. 暖通空调, 2006, (5): 17-21. [14] 李山, 孙美淑, 张伟佳, 等. 中国大陆1961-2010年间气候舒适期的空间格局及其演变[J]. 地理研究, 2016, 35(11): 2 053-2 070. [15] PALINKAS L A, WONG M. Global climate change and mental health[J]. Current Opinion in Psychology, 2020, 32: 12-16. [16] 孙彦, 陈雪峰, 龚园超, 等. 气候变化心理学研究进展及发展建议[J]. 中国科学院院刊, 2023, 38(8): 1 197-1 211. [17] DESCHENES O, GREENSTONE M. Climate change, mortality, and adaptation: Evidence from annual fluctuations in weather in the US[J]. American Economic Journal: Applied Economics, 2011, 3(4): 152-185. [18] HOU J, WANG C, WANG H, et al. Effects of temperature on mental health: Evidence and mechanisms from China[J]. China Economic Review, 2023, 79: 101953. [19] HUA Y, QIU Y, TAN X. The effects of temperature on mental health: Evidence from China[J]. Journal of Population Economics, 2022, 36 (3): 1 293-1 332. [20] KARIM J, WEISE R, BIBI Z, et al. Validation of the eight-item center for epidemiologic studies depression scale (CES-D) among older adults[J]. Current Psychology, 2015, 34: 681-692. [21] ANDRESEN E M, MALMGREN J A, Carter W B, et al. Screening for depression in well older adults: Evaluation of a short form of the CES-D[J]. American Journal of Preventive Medicine, 1994, 10(2): 77-84. [22] VAN D V S, LEVECQUE K, BRACKE P. Measurement equivalence of the CES-D 8 in the general population in Belgium: a gender perspective[J]. Archives of Public Health, 2009, 67: 1-15. [23] TURVEY C L, WALLACE R B, HERZOG R. A revised CES-D measure of depressive symptoms and a DSM-based measure of major depressive episodes in the elderly[J]. International Psychogeriatrics, 1999, 11(2): 139-148. [24] O'HALLORAN A, KENNY R, KING-KALLIMANIS B. The latent factors of depression from the short forms of the CES-D are consistent, reliable and valid in community-living older adults[J]. European Geriatric Medicine, 2014, 5(2): 97-102. [25] DING N, BERRY H L, BENNETT C M. The importance of humidity in the relationship between heat and population mental health: Evidence from Australia[J]. PLoS One, 2016, 11(10): e0164190. [26] FLORIDO N F, KELMAN I, CHAMBERS J, et al. Correlating heatwaves and relative humidity with suicide (fatal intentional self-harm)[J]. Scientific Reports, 2021, 11(1): 22175. [27] ZHANG X, CHEN F, CHEN Z. Heatwave and mental health[J]. Journal of Environmental Management, 2023, 332: 117385. [28] BULLOCK B, MURRAY G, MEYER D. Highs and lows, ups and downs: Meteorology and mood in bipolar disorder[J]. PLoS One, 2017, 12(3): e0173431. [29] CHEN N-T, LIN P-H, GUO Y-L L. Long-term exposure to high temperature associated with the incidence of major depressive disorder[J]. Science of the Total Environment, 2019, 659: 1 016-1 020. [30] GAO J, CHENG Q, DUAN J, et al. Ambient temperature, sunlight duration, and suicide: A systematic review and meta-analysis[J]. Science of the Total Environment, 2019, 646: 1 021-1 029. -

 点击查看大图
图(7) / 表(9)
计量
- 文章访问数: 7
- HTML全文浏览量: 5
- PDF下载量: 0
- 被引次数: 0
 粤公网安备 4401069904700003号