


A Comparative Analysis of Radiation at Offshore and Inland Stations in Maoming
-
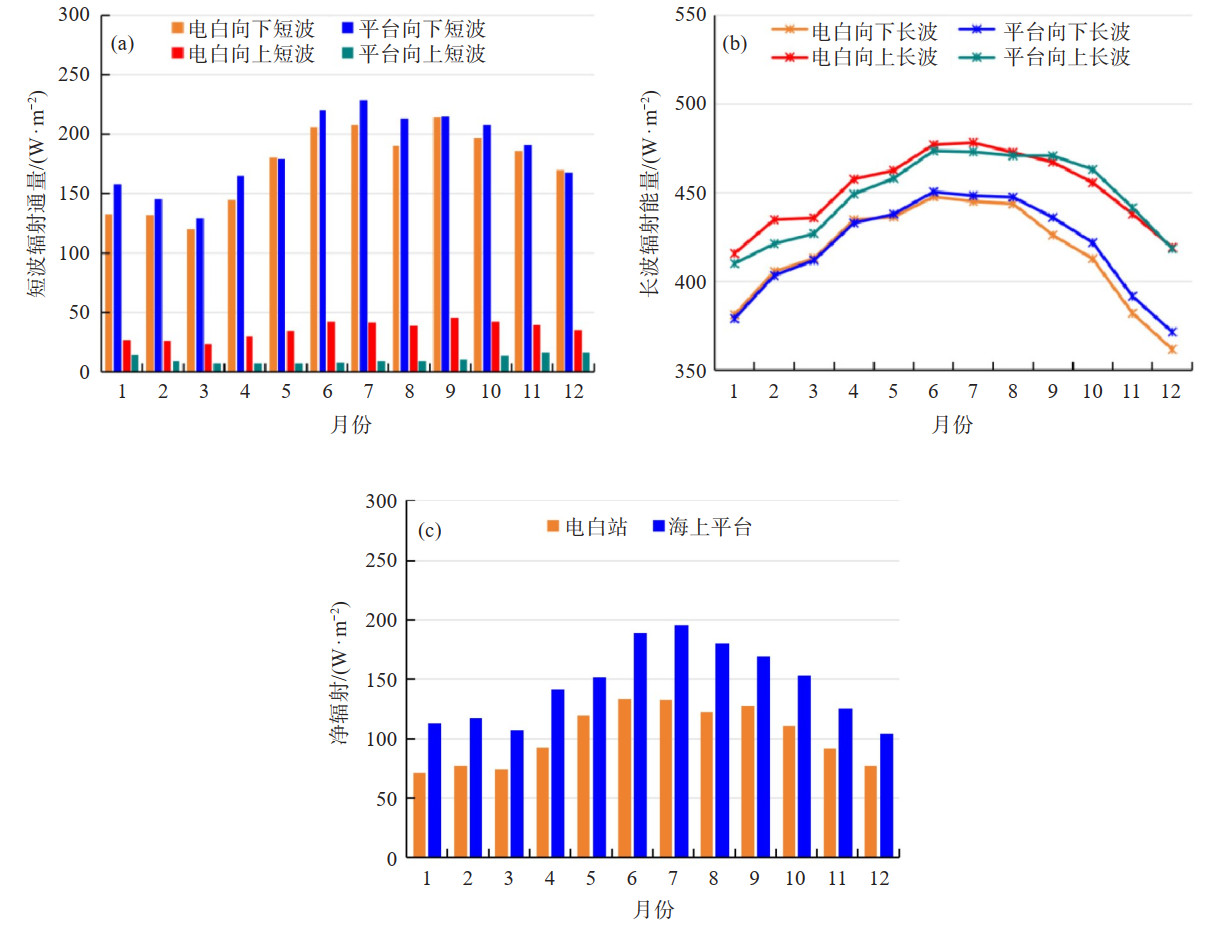
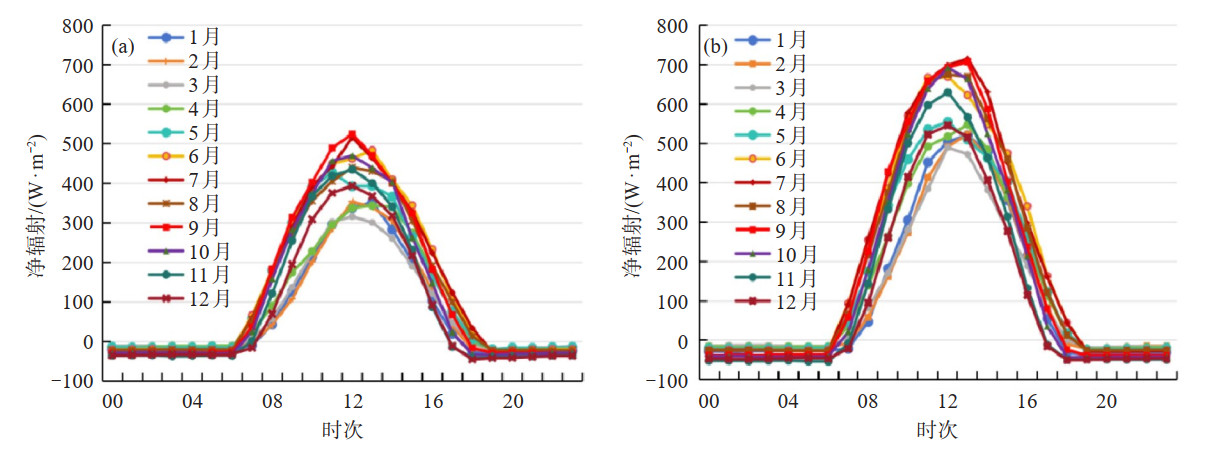
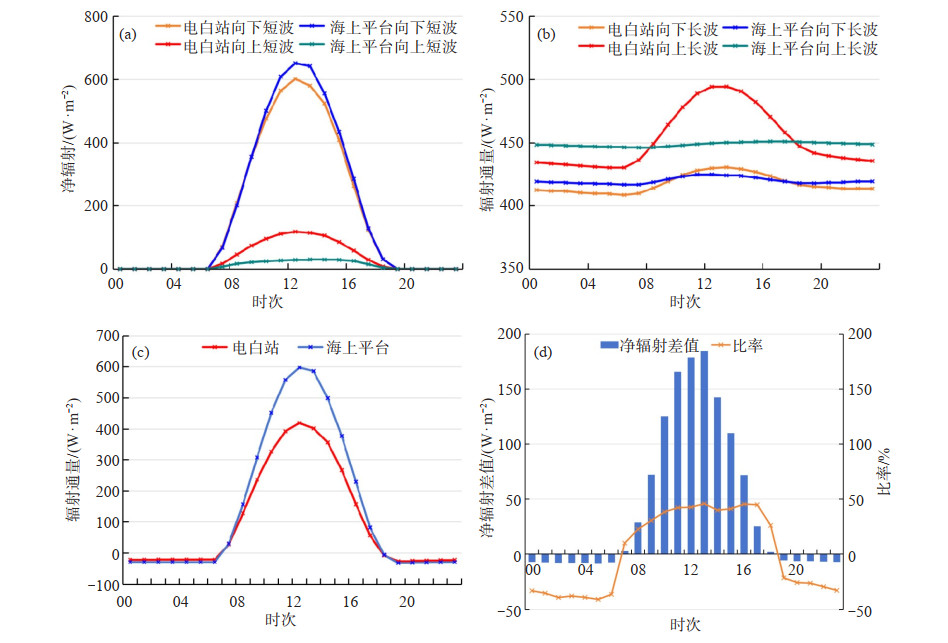
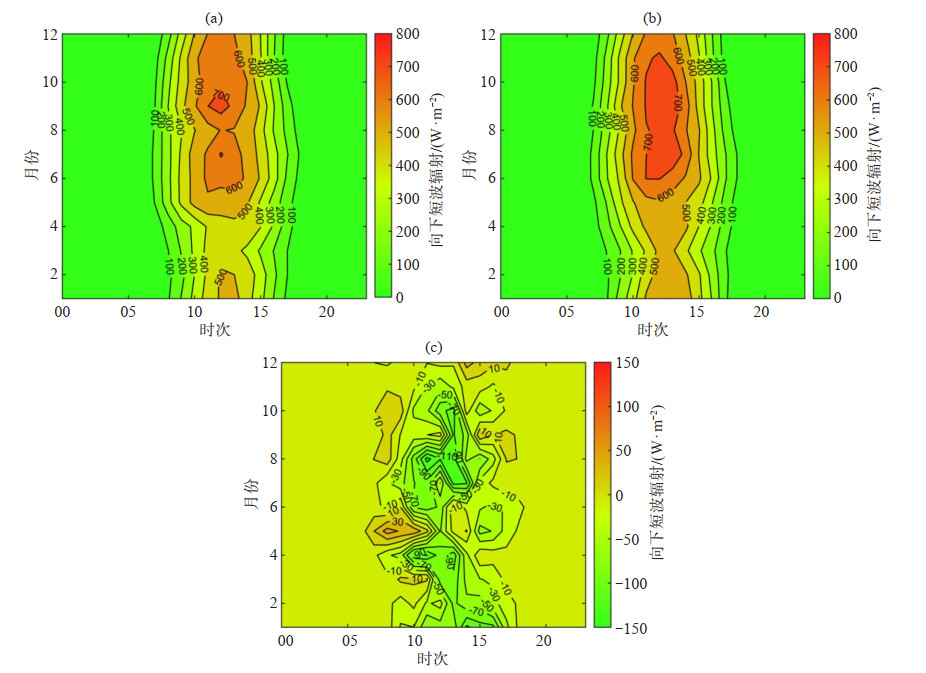
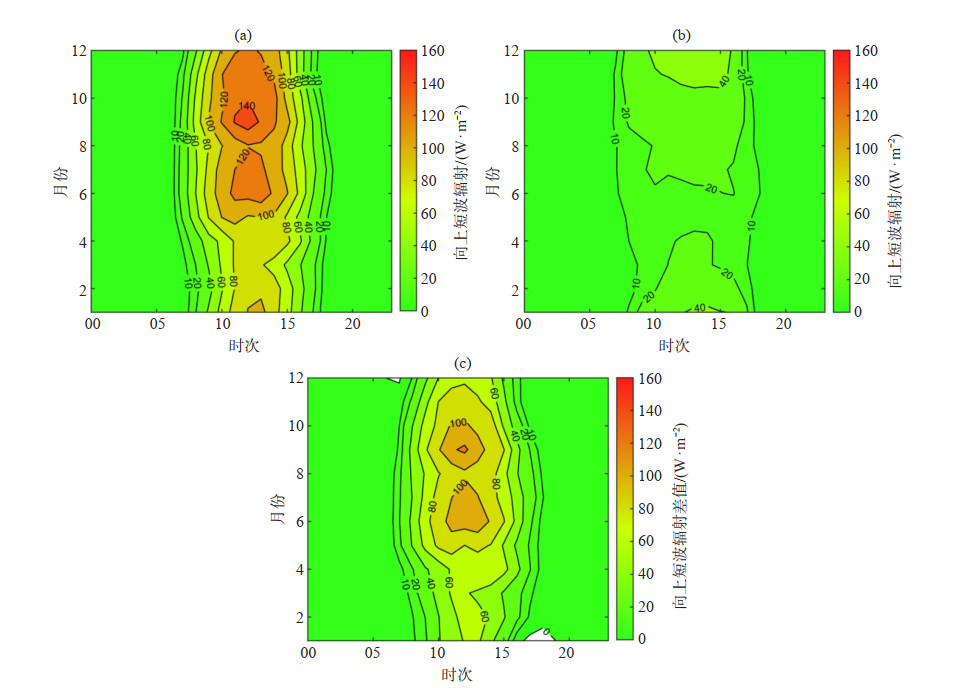
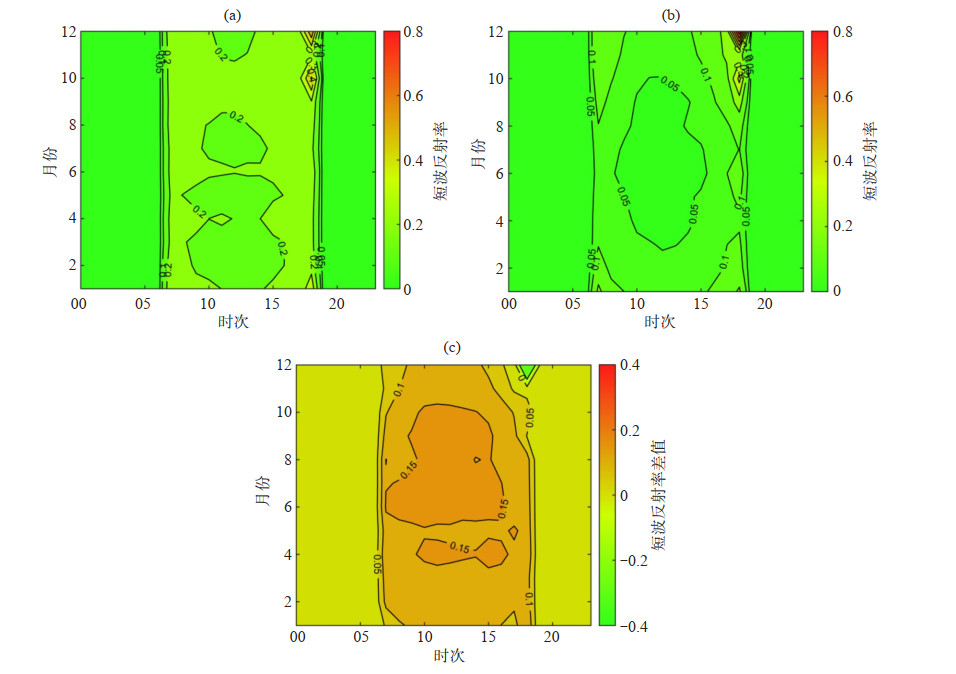
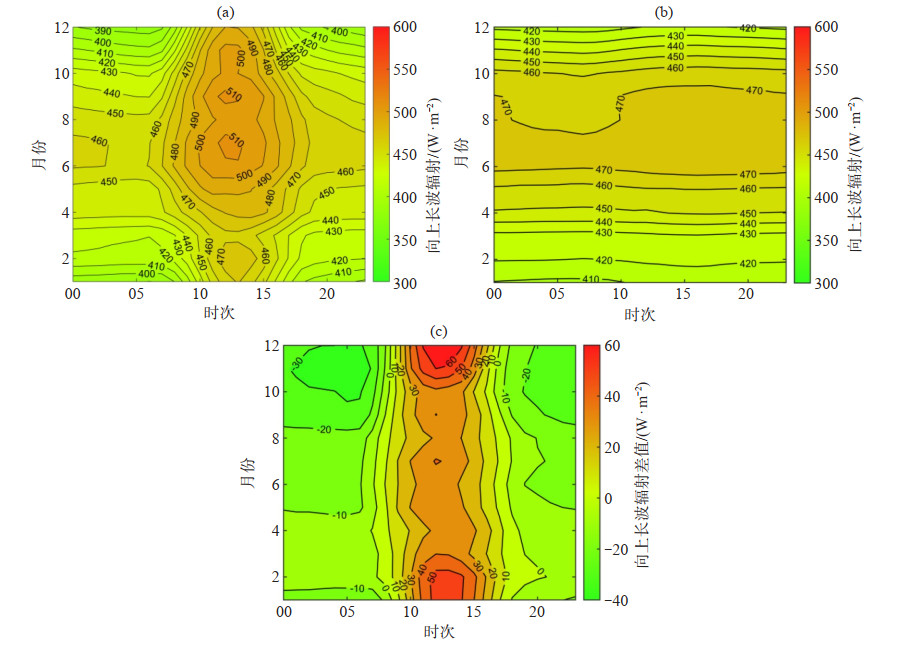
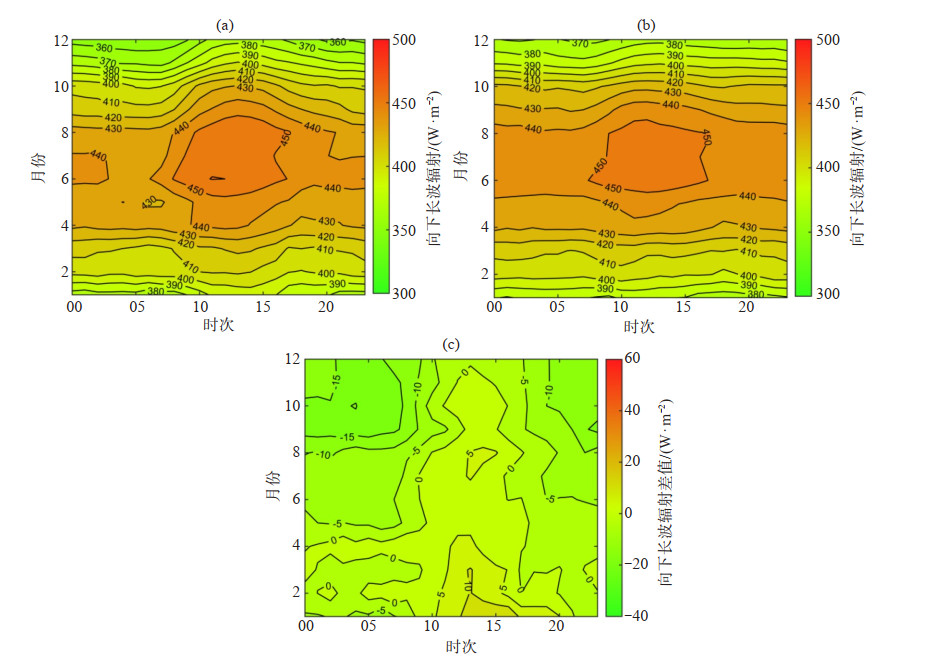
摘要: 基于2019年电白国家气候基准站(电白站)和中国气象局南海(博贺)海洋气象野外科学试验基地海洋气象综合观测平台(海上平台)的辐射观测数据,以及基本气象要素,对比分析了两站点辐射全年平均的月变化、日变化和逐月平均日变化特征,同时分析了辐射与其它气象要素之间的关系。(1) 两站点各辐射分量的月平均最大值一般都出现在夏秋季(仅海上平台的向上短波辐射最大值在12月),最小值都出现在冬春季。因下垫面不同,电白站向上短波辐射的月平均值明显大于海上平台,导致电白站获得的净辐射年平均值为103.8 W·m-2,明显低于海上平台年平均值145.8 W·m-2。(2) 两站点净辐射日变化对比表明,海陆接收到的净辐射差异显著,白天海上平台比电白站净辐射平均多35.8%,均值为92.5 W·m-2;晚上海上平台比电白站净辐射平均少33.1%,均值为-7.34 W·m-2。(3) 海上平台的向下短波辐射大于电白站,其高值区主要集中在6—11月的中午前后;电白站向上短波辐射明显高于海上平台,两站点向上短波辐射差值主要出现在夏季到冬季之间。电白站的短波反照率一般都是高于海上平台,两站点9月—次年1月的傍晚均出现反照率的高值区,而海上平台在早晨也出现较高值。(4) 电白站白天时段向上长波辐射的高值区分布特征和向下短波辐射相接近,而海上平台向上长波辐射反映出的是整体海水温度的季节性变化特征。电白站向下长波辐射一般在白天时段比海上平台大,其余时间比海上平台小,冬季更为明显。Abstract: Based on the radiation observations and the basic meteorological elements from the Dianbai National Climate Reference Station (Dianbai station) and the Integrated Observation Platform for Marine Meteorology of the Marine Meteorological Science Experiment Base (MMSEB) at Bohe (offshore platform) of China Meteorological Administration (CMA) in 2019, this study comparatively analyzes the annual average monthly variation, daily variation, and monthly average daily variation of radiation at two stations. The relationships between radiation and other meteorological elements are also analyzed. The main conclusions are as follows. (1) The monthly average maximum values for each radiation components at the two sites generally occur in summer and autumn (with the exception of upward shortwave radiation at the offshore platform, which peaks in December), while the minimum values occur in winter and spring. Due to differences in the underlying surface, the monthly average upward short-wave radiation at Dianbai station is significantly higher than that at the offshore platform, resulting in a notably lower annual net radiation of 103.8 W · m-2 at Dianbai station compared to 145.8 W · m-2 at the offshore platform. (2) The comparison of the daily variation of net radiation at the two stations reveals significant differences between the land and sea. During the daytime, the net radiation at the offshore platform is, on average, 35.8% higher than that at Dianbai station, with an average value of 92.5 W·m-2. At nighttime, the net radiation at the offshore platform is, on average, 33.1% lower than that at Dianbai station, with an average value of - 7.34 W · m-2. (3) The downward shortwave radiation of offshore platforms is greater than that at Dianbai station, with its peak-values concentrated around noon from June to November. The upward short-wave radiation at Dianbai station is obviously higher than that at offshore platform, with the largest differences between the two stations occurring between summer and winter. The short-wave albedo at Dianbai station is generally higher than that at the offshore platform station, and both stations exhibit a high value area in the evening from September to January, while the offshore platform also shows a secondary peak in the morning. (4) The spatial distribution of the upward long-wave radiation at Dianbai station during the daytime are similar to the downward short-wave radiation. In contrast, the upward long-wave radiation at offshore platform reflects the seasonal characteristics of the overall sea temperature. The downward long-wave radiation at Dianbai station is generally greater than that at the offshore platform in the daytime, but smaller in the rest of the time, especially in winter.
-
Key words:
- Maoming area /
- offshore /
- inland /
- radiation /
- comparative analysis
-
表 1 电白站和海上平台地理信息表
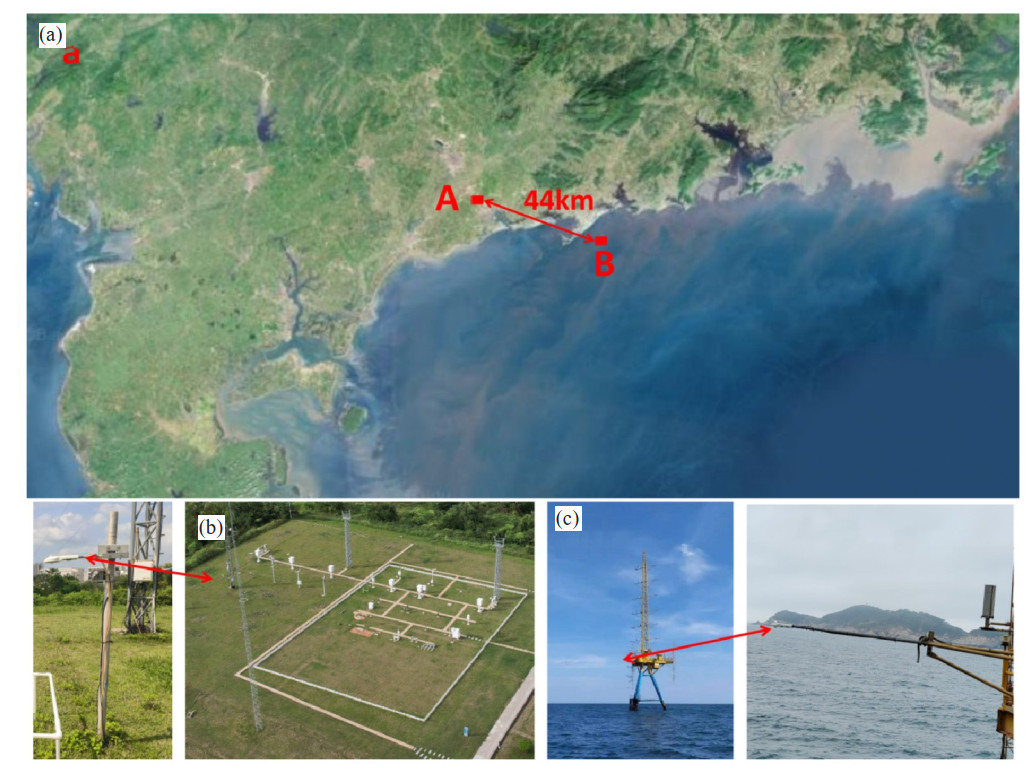
站点名称 海拔/m 水深/m 观测高度/m 离海岸线距离/km 电白站 31.6 -- 1.5 11.2 海上平台 11.0 15 12.0 6.5  下载: 导出CSV
表 2 仪器设备参数表
设备名称 设备型号 产地厂家 测量范围 测量精度(敏感度) 四分量辐射仪 CNR 4 荷兰
Kipp & Zonen短波:300~2 800 nm
长波:4.5~42 μm短波:7~20 µV·(W·m-2)-1
长波:5~10 µV·(W·m-2)-1温湿度传感器 HMP155 芬兰
Vaisala温度:-80~60 ℃
湿度:0~100%温度:±(0.226 0-0.002 8×温度读数)℃ (-80~20 ℃);±(0.055 0+0.005 7×温度读数)℃ (20~60 ℃)。
湿度:±(1.0+0.008×相对湿度读数)% (-20~40 ℃);±(1.2+0.012×相对湿度读数)% (40~60 ℃)风向风速传感器 Young-05106 美国
RM Young风速:0~100 m·s-1
风向:0~360°风速:±0.3 m·s-1或1%读数
风向:±3 °
下载: 导出CSV
表 3 两站点各辐射分量月平均值(W·m-2)
月份 向下短波辐射 向上短波辐射 向下长波辐射 向上长波辐射 净辐射 短波反照率 电白站 海上平台 电白站 海上平台 电白站 海上平台 电白站 海上平台 电白站 海上平台 电白站 海上平台 1 132.5 157.9 26.9 13.9 381.3 379.1 415.8 410.1 71.1 112.9 0.203 0.088 2 132.2 145.1 25.9 9.6 405.6 403.3 434.8 421.2 77.1 117.6 0.196 0.066 3 119.8 129.2 23.5 7.1 413.0 412.0 435.8 427.0 73.5 107.1 0.196 0.055 4 144.7 164.6 29.8 7.4 434.8 432.9 457.7 449.3 92.0 140.8 0.206 0.045 5 180.1 178.9 34.6 7.2 436.3 437.9 462.6 458.2 119.1 151.5 0.192 0.040 6 205.3 220.2 42.4 8.3 447.7 450.6 477.2 473.7 133.4 188.8 0.207 0.038 7 207.7 229.0 41.7 9.3 445.1 448.4 478.3 473.1 132.9 195.0 0.201 0.041 8 190.2 213.1 39.0 9.5 443.7 447.5 472.7 471.0 122.2 180.2 0.205 0.045 9 214.2 214.7 45.7 10.9 426.1 436.0 467.3 470.9 127.3 168.9 0.213 0.051 10 196.3 208 42.4 13.6 412.8 421.9 455.7 463.1 111.0 153.2 0.216 0.065 11 186.0 190.7 39.2 16.0 382.2 391.7 437.9 441.6 91.0 124.8 0.211 0.084 12 169.5 167.6 35.0 16.7 361.7 371.5 419.2 418.4 77.1 104.1 0.206 0.100 年平均 175.3 185.3 36.0 10.8 417.4 419.8 452.8 448.6 103.8 145.8 0.205 0.058 注:表中加粗数字代表最大值,加粗斜体数字代表最小值(表 4、表 5、表 6同)。
下载: 导出CSV
表 4 两站点各辐射分量季节平均值(W·m-2)
季节 向下短波辐射 向上短波辐射 向下长波辐射 向上长波辐射 净辐射 短波反照率 电白站 海上平台 电白站 海上平台 电白站 海上平台 电白站 海上平台 电白站 海上平台 电白站 海上平台 春季 149.2 159.0 29.5 7.3 428.0 427.6 452.1 444.8 95.9 151.4 0.198 0.046 夏季 200.9 220.7 41.0 9.0 445.5 448.8 476.0 472.6 130.1 212.0 0.204 0.041 秋季 198.5 205.4 42.4 13.6 407.0 416.1 453.6 458.3 109.3 183.4 0.214 0.066 冬季 147.4 157.1 29.8 13.5 382.0 384.3 435.5 416.8 75.0 141.2 0.202 0.086
下载: 导出CSV
表 5 两站点各辐射分量的年小时平均值(W·m-2)
时次 向下短波辐射 向上短波辐射 向下长波辐射 向上长波辐射 净辐射 短波反照率 电白站 海上平台 电白站 海上平台 电白站 海上平台 电白站 海上平台 电白站 海上平台 电白站 海上平台 0 0.0 0.0 0.0 0.0 412.5 419.2 434.4 448.3 -21.9 -29.1 0.0 0.0 1 0.0 0.0 0.0 0.0 411.8 418.6 433.4 447.9 -21.7 -29.3 0.0 0.0 2 0.0 0.0 0.0 0.0 411.6 418.3 432.7 447.5 -21.0 -29.2 0.0 0.0 3 0.0 0.0 0.0 0.0 410.4 417.8 431.7 447.1 -21.3 -29.3 0.0 0.0 4 0.0 0.0 0.0 0.0 409.8 417.5 430.9 446.8 -21.1 -29.3 0.0 0.0 5 0.0 0.0 0.0 0.0 409.4 417.3 430.2 446.6 -20.8 -29.3 0.0 0.0 6 0.0 0.0 0.0 0.0 408.6 416.8 430.3 446.3 -21.6 -29.5 0.0 0.0 7 70.7 67.0 16.7 7.2 409.9 416.8 436.2 446.0 27.7 30.5 0.236 0.107 8 209.0 201.4 45.9 16.5 414.1 418.7 449.0 446.3 128.2 157.3 0.220 0.082 9 354.7 355.4 74.0 21.6 419.2 421.1 464.1 447.0 235.8 307.9 0.209 0.061 10 475.8 500.9 95.7 24.6 424.5 423.2 478.1 447.9 326.5 451.7 0.201 0.049 11 564.8 609.3 111.4 27.0 427.9 424.7 488.8 448.8 392.5 558.3 0.197 0.044 12 601.6 651.5 117.9 28.8 429.8 424.8 494.2 449.5 419.2 598.0 0.196 0.044 13 580.3 642.5 114.5 30.1 430.5 424.1 494.4 450.1 401.9 586.4 0.197 0.047 14 524.3 555.7 105.9 29.6 429.1 423.6 490.6 450.4 356.8 499.3 0.202 0.053 15 408.4 434.6 85.7 28.8 426.8 422.4 482.3 450.8 267.3 377.4 0.210 0.066 16 263.0 285.4 58.4 25.7 423.6 420.7 470.5 451.0 157.7 229.4 0.222 0.090 17 124.4 128.9 29.2 14.9 419.7 419.2 458.1 450.9 56.8 82.4 0.235 0.116 18 30.4 30.8 7.7 4.2 416.6 418 447.1 450.4 -7.9 -5.8 0.253 0.136 19 0.0 0.0 0.0 0.0 415.2 417.8 441.8 450 -26.5 -32.2 0.0 0.0 20 0.0 0.0 0.0 0.0 414.6 418.4 439.5 449.6 -24.9 -31.3 0.0 0.0 21 0.0 0.0 0.0 0.0 413.6 418.7 437.9 449.3 -24.3 -30.6 0.0 0.0 22 0.0 0.0 0.0 0.0 413.7 419.3 436.6 449.0 -23.0 -29.7 0.0 0.0 23 0.0 0.0 0.0 0.0 413.5 419.3 435.5 448.5 -22.0 -29.2 0.0 0.0
下载: 导出CSV
表 6 两站点月平均日出日落时间
月份 日出时间 日落时间 月平均日照时长/小时 电白站 海上平台 电白站 海上平台 电白站 海上平台 1 07时16分 07时23分 18时16分 18时25分 11.17 11.20 2 07时13分 07时16分 18时33分 18时39分 11.26 11.55 3 07时10分 07时10分 18时45分 18时46分 11.46 11.41 4 07时10分 07时10分 18时50分 18时50分 11.73 11.73 5 07时10分 07时10分 18时50分 18时50分 11.80 11.82 6 07时10分 07时10分 18时50分 18时50分 11.78 11.83 7 07时10分 07时10分 18时50分 18时50分 11.83 11.83 8 07时14分 07时10分 18时50分 18时50分 11.78 11.81 9 07时11分 07时10分 18时41分 18时36分 11.67 11.44 10 07时10分 07时10分 18时14分 18时12分 11.24 11.20 11 07时10分 07时10分 18时06分 17时52分 10.94 10.87 12 07时12分 07时10分 17时57分 17时48分 10.92 10.81 年平均 07时11分 07时10分 18时33分 18时33分 11.46 11.46
下载: 导出CSV
-
[1] 廖国男. 大气辐射导论(第二版)[M]. 郭彩丽, 周诗健, 译. 北京: 气象出版社, 2004. [2] 蒋全荣, 王宁邦. 太阳辐射与西北太平洋副高季节性移动关系的研究[J]. 热带气象, 1989, 5(4): 289-294. [3] 任国玉. 太阳辐射与气候变化[J]. 地球科学进展, 1991, 6(6): 37-41. [4] 盛裴轩, 毛节泰, 李建国, 等. 大气物理学[M]. 北京: 北京大学出版社, 2003. [5] 查良松. 我国地面太阳辐射量的时空变化研究[J]. 地理科学, 1996(3): 41-46. [6] 李晓文, 李维亮, 周秀骥. 中国近30年太阳辐射状况研究[J]. 应用气象学报, 1998(1): 25-32. [7] 徐玉貌, 刘红年, 徐桂玉. 大气科学概论[M]. 南京: 南京大学出版社, 2000. [8] 曹越前, 张武, 药静宇, 等. 半干旱区云量变化特征及其与太阳辐射关系的研究[J]. 干旱气象, 2015, 33(4): 684-693. [9] 刘平平, 刘鑫, 刘琼, 等. 新疆地区气溶胶对地表太阳辐射的影响初探[J]. 环境科学学报, 2020, 40(9): 3 155-3 164. [10] 施红, 许建明, 李成才. 华南地面太阳辐射状况及其转折特征分析[J]. 热带气象学报, 2009, 25(2): 209-215. [11] 陈玲, 罗鹍, 袁志扬, 等. 东莞市辐射强度特征及影响因子[J]. 热带气象学报, 2014, 30(3): 585-593. [12] 邱宗旭, 杨琳, 李兴荣, 等. 从辐射强度变化分析深圳太阳辐射气象条件[J]. 太阳能学报, 2019, 40(3): 724-732. [13] 王欢, 韦志刚, 朱献, 等. 岭南地区典型次生常绿阔叶林下垫面太阳和长波辐射特征分析[J]. 高原气象, 2020, 39(5): 1 033-1 044. [14] HUANG H J, MAO W K. The South China Sea Monsoon Experiment-Boundary Layer Height(SCSMEX-BLH): Experimental design and preliminary results[J]. Mon Wea Rev, 2015, 143(12): 5 035-5 053. [15] CHEN G. Diurnal cycle of the Asian Summer Monsoon: Air pump of the second kind[J]. J Climate, 2020, 33(3): 1 747-1 775. [16] 王举, 姚华栋, 蒋国荣, 等. 南海北部海区太阳辐射观测分析与计算方法研究[J]. 海洋与湖沼, 2005(5): 385-393. [17] 林绍迎, 邹涛, 高会旺, 等. 北黄海春季海面太阳辐射船基观测与分析[J]. 中国海洋大学学报(自然科学版), 2010, 40(4): 73-78. [18] 詹国伟, 黄辉军, 周明森, 等. 茂名近海、近岸及陆地站点气象要素对比分析[J]. 热带气象学报, 2023, 39(6): 898-914. [19] ARYA S P. Introduction to Micrometeorology[M]. Academic Press, San Diego, 2001. [20] PAYNE R E. Albedo of the Sea Surface[J]. J Atmos Sci, 1972, 29: 959-970. [21] HUANG C J, QIAO F L, CHEN S Y, et al. Observation and parameterization of Broadband Sea Surface albedo[J]. J Geophys Res Oceans, 2019, 124(7): 4 480-4 491. [22] 中国气象局. 地面气象观测规范[M]. 北京: 气象出版社, 2003. [23] WENDISCH M, PILEWSKIE P, J KEL E, et al. Airborne measurements of areal spectral surface albedo over different sea and land surfaces [J]. JGeophy Res-Atmos, 2004, 109: D08203. [24] WEI J, REN T, YANG P, et al. An improved ocean surface albedo computational scheme: Structure and performance[J]. J Geophy Res: Oceans, 2021, 126: e2020JC016958. -


 点击查看大图
图(13) / 表(6)
计量
- 文章访问数: 23
- HTML全文浏览量: 8
- PDF下载量: 4
- 被引次数: 0
 粤公网安备 4401069904700003号