


Comparison of Rainrate Between Raindrop Spectra and Rain Gauge Observations of the South China Precipitation Validation Station of Fengyun Meteorological Satellite
-
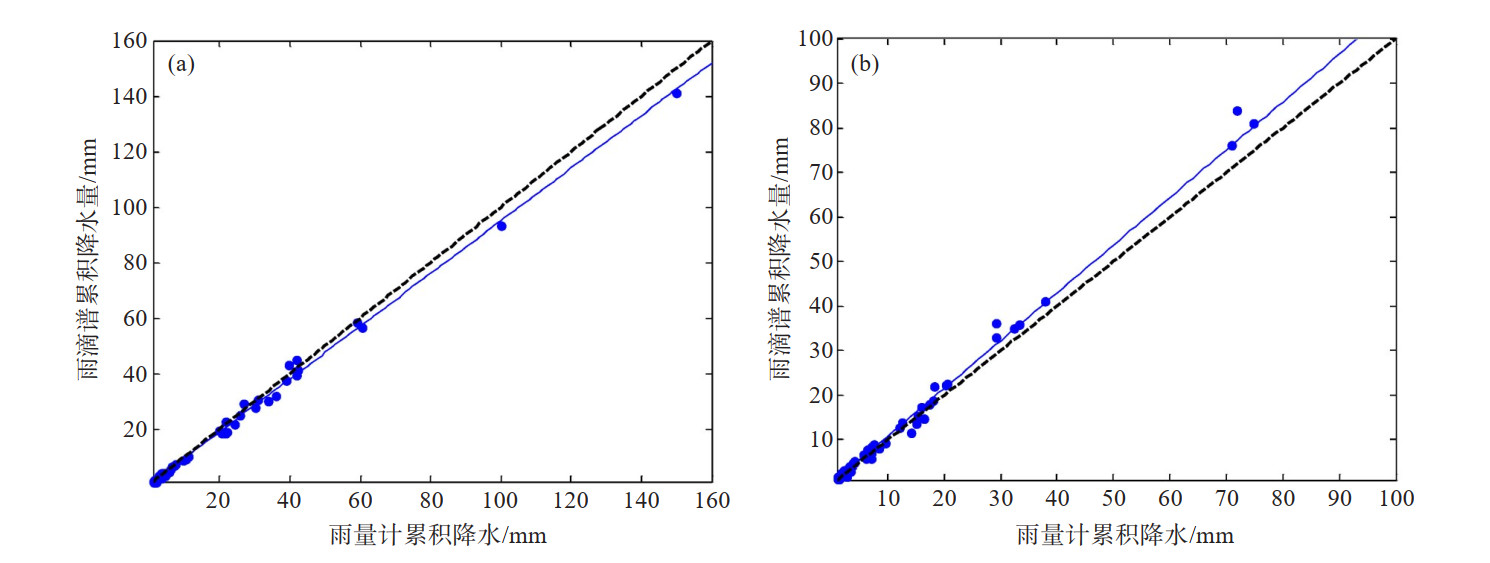
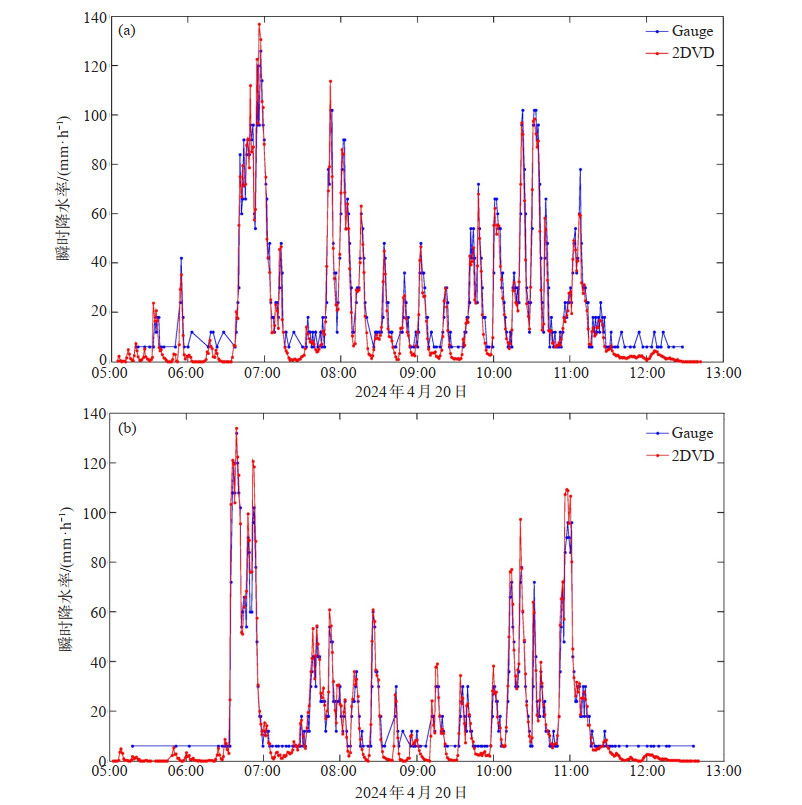
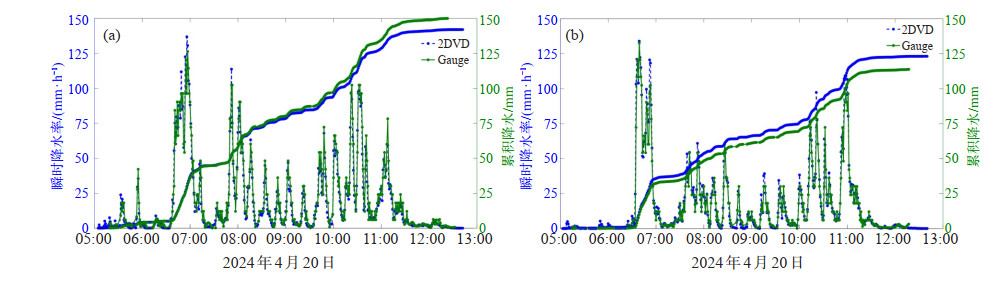
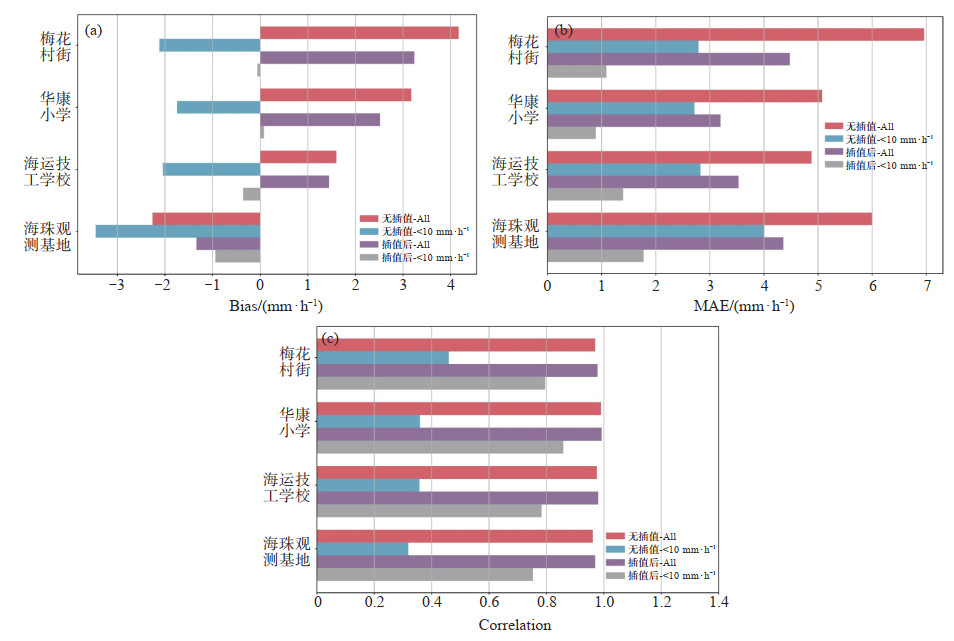
摘要: 使用2024年4—5月风云卫星华南降水检验站的4台二维雨滴谱数据和同步观测的分钟雨量计数据,通过比较雨滴谱和雨量计累积降水量以及瞬时降水率这两个特征参数,对两种设备观测降水的一致性进行了分析。4个站中有3个站的雨滴谱累积降水量大于雨量计累积降水量,总量偏大10%~13%,有1个站的雨滴谱累积降水量小于雨量计累积降水量,偏小0.5%,两种设备观测累积降水量的相关系数较高,四个站的均值达到0.99以上。在进行瞬时降水率对比时,通过三次样条插值,能够明显减少雨滴谱瞬时降水率和雨量计瞬时降水率之间的偏差和绝对偏差,尤其是对 < 10 mm·h-1的非连续观测的弱降水,相关系数由0.37提升到0.80左右,表明该插值方法合理可行,可以用于生成地面雨量计的瞬时降水率数据集。经评估,二维雨滴谱和雨量计之间具有比较好的一致性,可支撑风云卫星降水反演产品的精度检验和后续的算法改进。Abstract: Data from four two-dimensional raindrop spectrum at the Fengyun Satellite South China Precipitation Validation Station, along with co-located minute rain gauge data from Apirl to May 2024, were used. The consistency of precipitation observations between the two instruments was analyzed by comparing cumulative rainfall and instantaneous rain rates. The results indicate that at three of the four stations, the cumulative rainfall from the disdrometer exceeded that from the rain gauge by 10% to 13%. At a certain station, the disdrometer's cumulative rainfall was 0.5% lower. The correlation coefficient for cumulative rainfall was high, with an average above 0.99. When comparing instantaneous rain rate, applying a cubic spline interpolation to the rain gauge data significantly reduced the bias and mean absolute error between the the two instruments. This was particularly effective for weak precipitation (< 10 mm· h-1) with discontinuous observations, where the correlation coefficient can be increased from 0.37 to approximately 0.8. This indicates that the interpolation method is reasonable and feasible for generating high-temporal-resolution instantaneous precipitation rate datasets from conventional rain gauge. The evaluation demonstrated good consistency between the two-dimensional raindrop spectrum and the rain gauge, suggesting these datasets can support the ground validation and algorithm improvement of Fengyun satellite precipitation retrieval products.
-
Key words:
- raindrop spectrum /
- rain gauge /
- cumulative rainfall /
- instantaneous rain rate /
- ground validation
-
表 1 雨量计和雨滴谱累积降水量
站名 雨量计/mm 2DVD/mm 梅花村街 865.8 961.5 华康小学 879.1 1 007.0 海运技工学校 982.6 1 101.5 海珠观测基地 1 209.5 1 049.0  下载: 导出CSV
表 2 雨量计和雨滴谱累积降水量对比指标
站名 个数 相关系数 MAE/mm Bias/mm STD/mm 梅花村街 85 0.995 8 1.386 7 1.253 1 2.473 2 华康小学 98 0.987 5 1.768 0 1.759 1 3.470 7 海运技工学校 91 0.998 0 1.085 4 0.842 7 2.004 7 海珠观测基地 70 0.998 4 1.118 3 -0.738 0 1.810 5
下载: 导出CSV
表 3 雨量计和2DVD观测的降水信息
站名 雨量计 2DVD 开始时间 结束时间 雨量/mm 开始时间 结束时间 雨量/mm 梅花村街 05:17 12:17 96.2 05:00 12:24 117.70 华康小学 05:01 12:23 96.4 04:59 12:32 113.87 海运技工学校 05:18 12:17 112.8 05:02 12:39 123.16 海珠观测基地 05:19 12:28 148.6 05:04 12:41 142.02
下载: 导出CSV
表 4 雨量计和雨滴谱瞬时降水率对比指标
站名 瞬时降水率 Bias/(mm·h-1) MAE/(mm·h-1) 相关系数 梅花村街 All 4.165 2 6.959 0 0.969 7 < 10 mm·h-1 -2.117 0 2.789 7 0.459 5 华康小学 All 3.172 4 5.073 0 0.989 9 < 10 mm·h-1 -1.747 0 2.713 3 0.358 7 海运技工学校 All 1.597 6 4.878 9 0.975 1 < 10 mm·h-1 -2.041 5 2.826 0 0.357 6 海珠观测基地 All -2.262 4 5.992 3 0.961 1 < 10 mm·h-1 -3.454 5 3.997 6 0.318 3
下载: 导出CSV
-
[1] 谷松岩, 卢乃锰, 吴琼, 等. 风云三号气象卫星降水测量能分析与展望[J]. 海洋气象学报, 2022, 42(2): 1-10. [2] ZHANG P, GU S Y, CHEN L, et al. FY-3G satellite instruments and precipitation products: First report of China's Fengyun rainfall mission in-orbit[J]. J Remote Sens, 2023, 3: 0097. [3] 尹红刚, 商建, 吴琼, 等. 风云三号降水测量雷达技术性能分析[J]. 气象科技, 2017, 45(5): 786-804. [4] 吴琼, 仰美霖, 陈林, 等. 一种星载降水测量雷达和地基天气雷达的频率修正方法[J]. 气象学报, 2023, 81(2): 353-360. [5] 吴琼, 尹红刚, 陈林, 等. 星载雷达降水反演算法敏感性分析[J]. 气象学报, 2024, 82(2): 236-246. [6] 冯璐, 陆海琦, 李丰, 等. 广东地区一次飑线过程的地面雨滴谱特征分析[J]. 热带气象学报, 2020, 36(5): 626-637. [7] 徐睿, 吴晓燕, 鲁江伟, 等. 针对一次对流云降水反演大气垂直运动速度及雨滴谱[J]. 热带气象学报, 2024, 40(1): 127-135. [8] 陈垚, 寇蕾蕾, 蒋银丰, 等. 基于新型观测算子的双偏振雷达雨滴谱变分反演[J]. 热带气象学报, 2022, 38(6): 854-869. [9] 周嘉健, 肖辉, 潘雯菁, 等. 基于雷达反射率因子的降水性层状云中雨滴谱参数的反演方法与检验研究[J]. 热带气象学报, 2018, 34(2): 250-259. [10] 张婷, 魏凤英. 华南地区汛期极端降水的概率分布特征[J]. 气象学报, 2009, 67(3): 442-451. [11] 臧钰歆, 徐邦琪, 高迎侠. 10—20 d和30—60 d低频振荡对华南前汛期持续性暴雨的影响差异及机制研究[J]. 气象学报, 2024, 82(2): 137-154. [12] DING Y, WAN QL, YANG L, et al. Raindrop size distribution parameters retrieved from xinfeng C-band polarimetric radar observations[J]. J Trop Meteor, 2020, 26(3): 275-285. [13] WEN L, ZHAO K, ZHANG G F, et al. Statistical characteristics of raindrop size distributions observed in East China during the Asian summer monsoon season using 2-D video disdrometer and Micro Rain Radar data[J]. J Geophys Res: Atmos, 2016, 121(5): 2 265-2 282. [14] LIU X T, ZHANG T F, WAN Q L, et al. Raindrop size distribution parameters retrieved from Guangzhou S-band polarimetric radar observations[J]. Acta Meteor Sin, 2018, 32(4): 571-583. [15] LI L, GUO J, CHEN H N, et al. Microphysical characteristics of rainfall observed by a 2DVD disdrometer during different seasons in Beijing[J]. China Remote Sens, 2021, 13(12): 2303. [16] MC FARQUHAR G M, LIST R. The effect of curve fits for the disdrometer calibration on raindrop spectra, rainfall rate, and radar reflectivity[J]. J Appl Meteor, 1993, 32(4): 774-782. [17] SHEPPARD B E, JOE P I. Comparison of raindrop size distribution measurements by a Joss-Waldvogel disdrometer, a PMS 2DG spectrometer, and a POSS Doppler radar[J]. J Atmos Oceanic Technol, 1994, 11(4): 874-887. [18] TOKAY A, WOLFF D B, WOLFF K R, et al. Rain gauge and disdrometer measurements during the Keys Area Microphysics Project (KAMP)[J]. J Atmos Oceanic Technol, 2003, 20(11): 1 460-1 477. [19] HAGEN M, YUTER S. Relations between radar reflectivity, liquid water content, and rainfall rate during the MAP SOP[J]. Quart J Roy Meteor Soc, 2003, 129(588): 477-493. -

 点击查看大图

图(5) / 表(4)
计量
- 文章访问数: 88
- HTML全文浏览量: 12
- PDF下载量: 73
- 被引次数: 0
 粤公网安备 4401069904700003号