


Multiple Models Forecast Evaluation of Three Typhoon-induced Heavy Precipitation Events over Zhejiang Province
-
摘要: 中国东南沿海地区台风强降水极易引发严重灾害,造成巨大的经济损失和人员伤亡。本文基于浙江省96个国家级气象观测台站的逐小时降水资料,评估了6个区域及3个全球业务数值天气预报模式在2021—2023年三次对浙江影响最大的台风强降水过程中的预报表现。结果表明,(1)对于24 h累计降水量,小雨及以上量级预报ETS、综合评分方面区域模式略优于全球模式。而暴雨预报模式间差异较大,“烟花”和“杜苏芮”过程中ECMWF预报ETS最佳,“梅花”过程则为CMA-TRAMS9最好。(2)10 mm·(3 h)-1及以上强度降水是三次台风过程总降水的主要贡献者,3 km区域模式对该量级降水预报ETS略优于其余模式,其中CMA-MESO3对“烟花”和“杜苏芮”预报表现最好。(3)“烟花”和“杜苏芮”过程中,全球和区域模式均在浙江东部沿海台站预报出过多的降水,主要受模式中降水频率和强度高估的共同影响。各模式基本能预报出“烟花”登陆前降水的清晨峰值,但“烟花”登陆后降水日变化模式间预报差异较大,其中ECMWF、CMA-MESO3和CMA-BJ9对登陆后降水主峰值时间预报更为准确。而“杜苏芮”过程中,仅CMA-GD3对登陆后降水日变化的单峰结构和峰值时间预报最为准确,其余各模式对台风登陆前后降水日变化的预报均相对实况偏差明显。研究结果可为模式改进及台风预报服务提供参考依据。Abstract: The heavy precipitation which caused by typhoon may lead to huge societal and economic losses, especially in the coastal regions of southeastern China. Based on the hourly rainfall data from 96 national stations in Zhejiang province, the performance of six regional and three global operational numerical weather prediction models for the typhoon-induced heavy precipitation during the 2021—2023 was evaluated. (1) For 24-hour accumulated precipitation, regional models demonstrate a higher Equitable threat score (ETS) and comprehensive scores in rainfall (greater than 0.1 mm) forecast than global models. However, obvious differences exist in torrential rain forecastg. ECMWF showed the best ETS for the In-fa and Doksuri processes, while CMA-TRAMS9 performed best for the Muifa. (2) Precipitation with an intensity greater than 10 mm·(3h)-1 was the major contributor to accumulated precipitation. The ETS for 3-hour heavy precipitation showed that regional models with resolution of 3 km slightly outperform the other models, and CMA-MESO3 had the best skill during the In-fa and Doksuri. (3) Both global and regional models overforecasted precipitation on eastern coast of Zhejiang during the In-fa and Doksuri. This positive bias was contributed to by both overestimated precipitation frequency and intensity. All models reasonably reproduced the early morning peak of precipitation amount before the landfall of In-fa, but the bias of the peak hour after the landfall of In-fa varied greatly between models. Among them, ECMWF, CMA-MESO3 and CMA-BJ9 were more accurate in predicting the main peak hour after landfall. In contrast, the forecasts of the diurnal variation were generally poor for all models before and after the landfall of Doksuri, with the exception of CMA-GD3 after landfall. The results provide users with the bias features and accuracy for the precipitation forecast among operational models, which may be helpful in the improvement of model forecast skill and weather forecasting services.
-

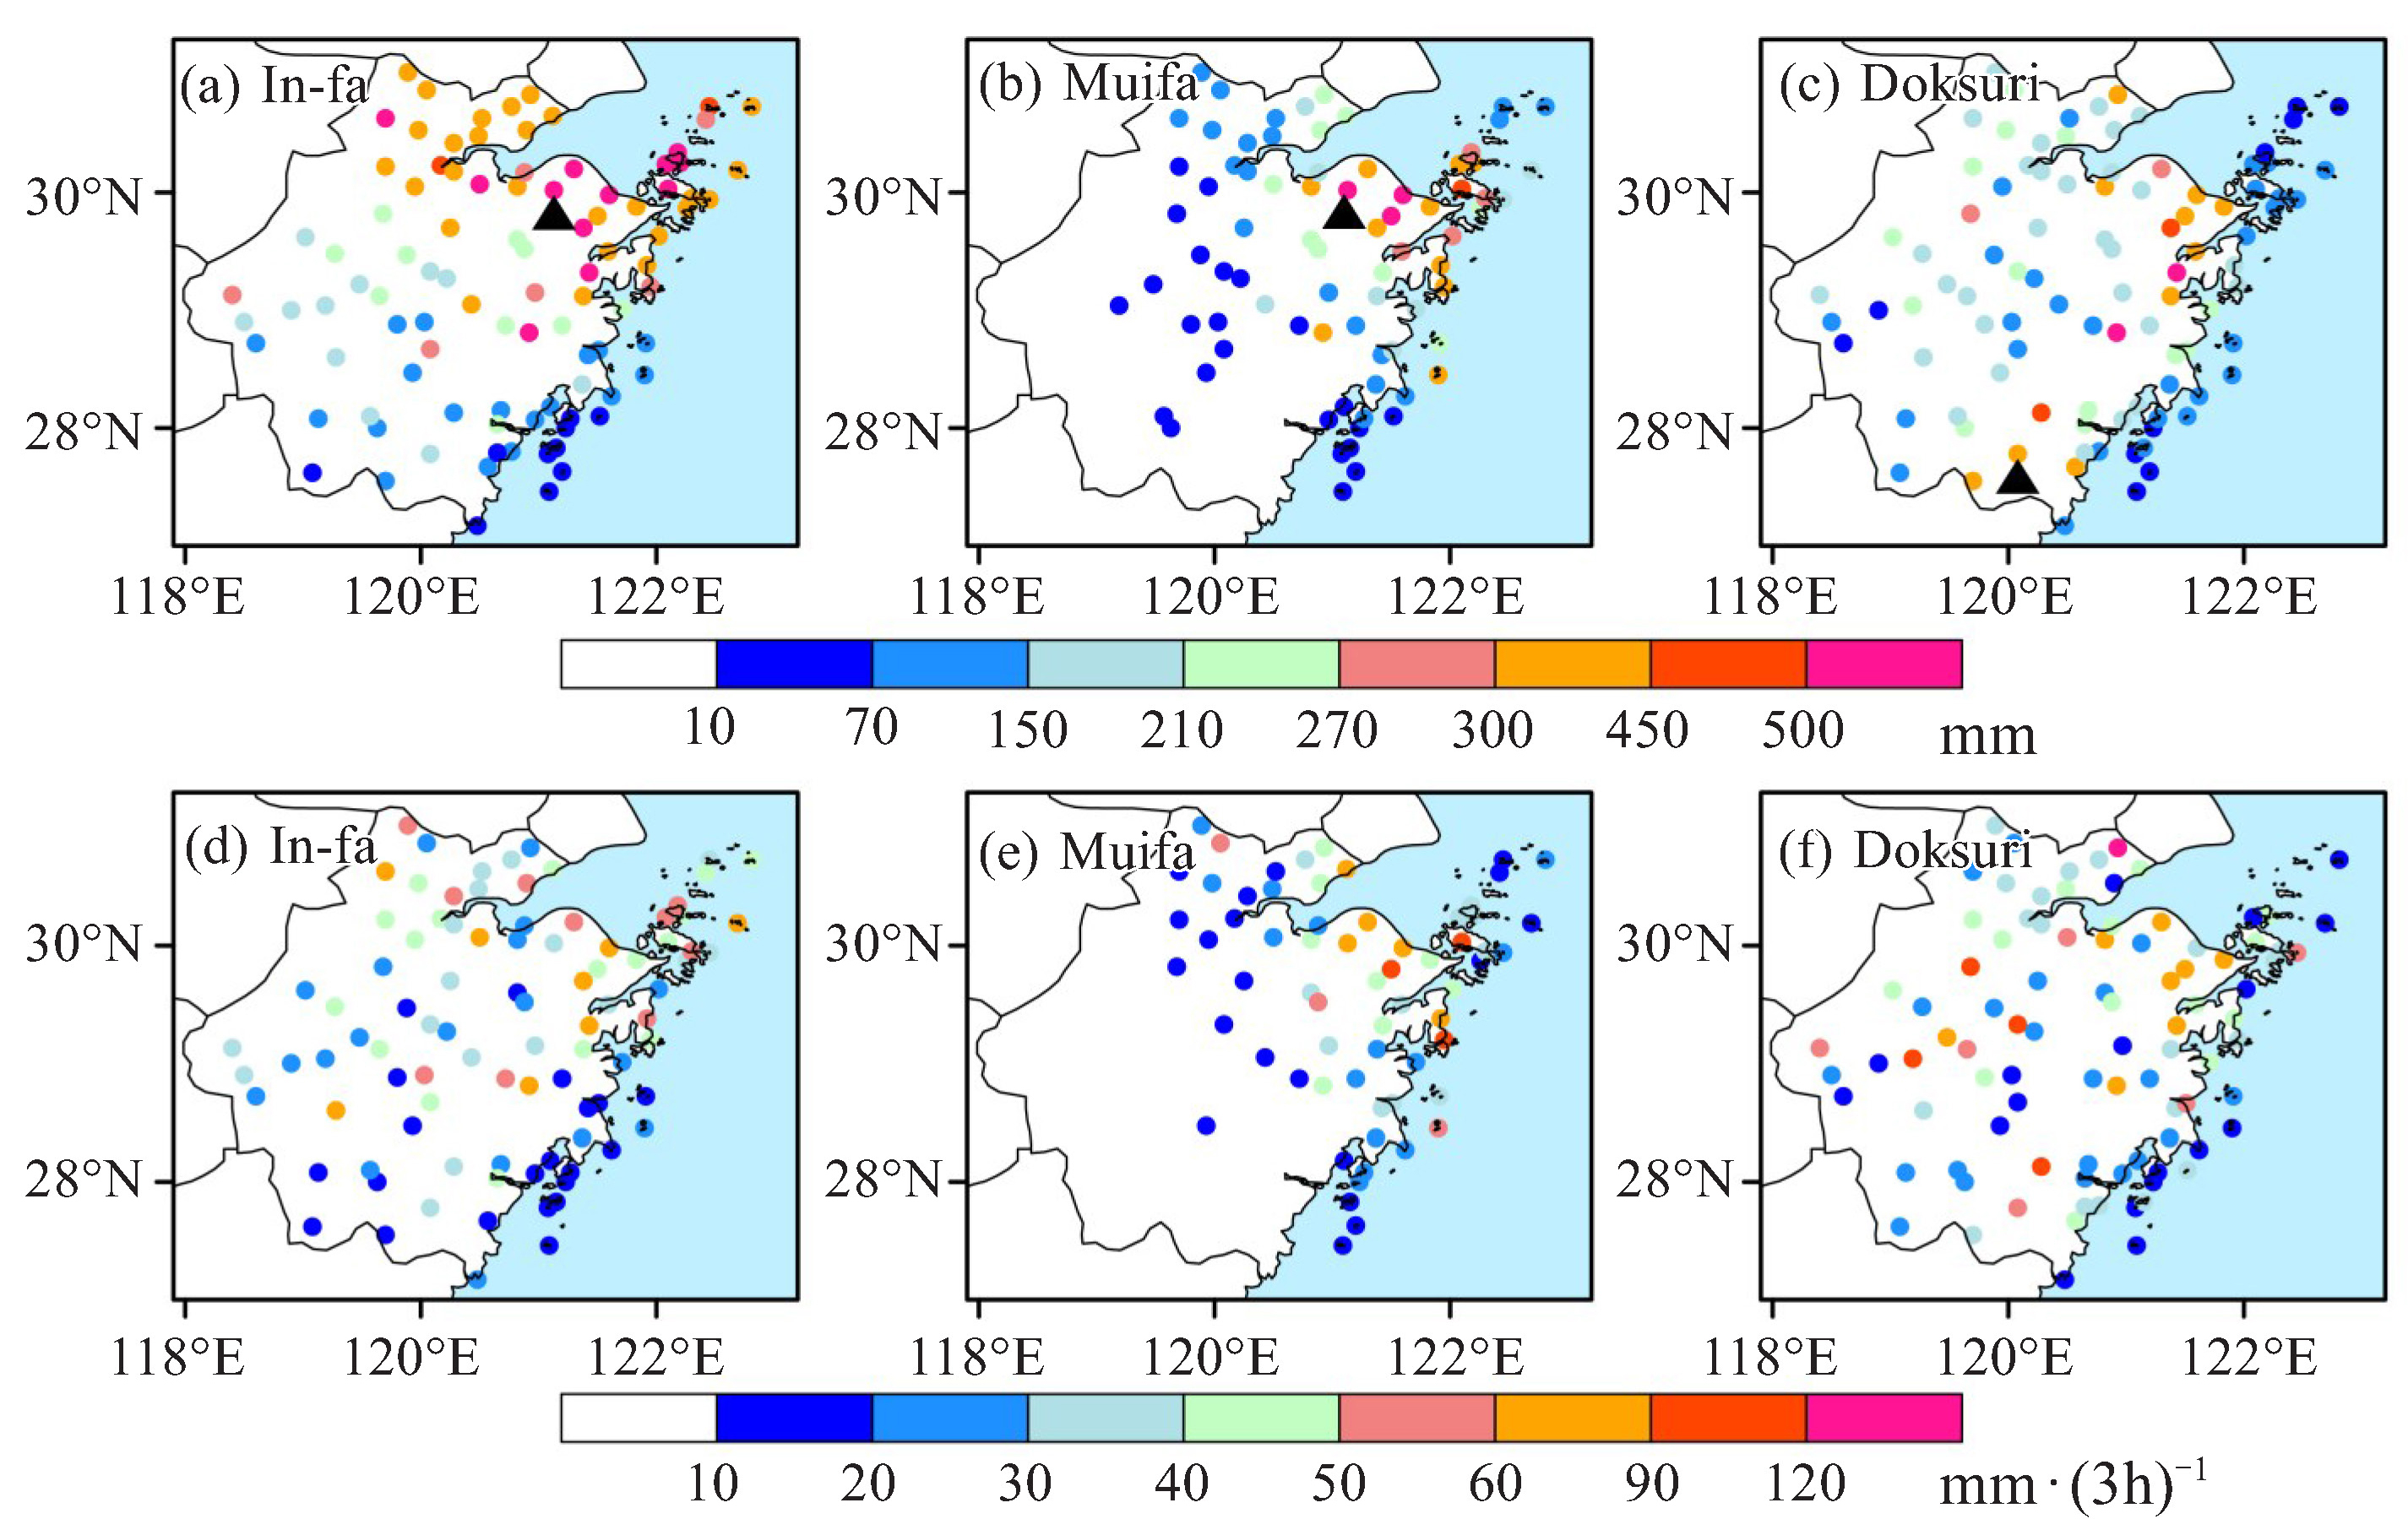
图 1 三次台风影响下浙江各台站累计降水量(a~c,mm)、最大3 h降水强度(d~f,mm·(3 h)-1)的分布
a、d为“烟花”台风降水过程;b、e为“梅花”台风降水过程;c、f为“杜苏芮”台风降水过程;a~c中黑色三角形对应表 1中最大累计降水中心台站。

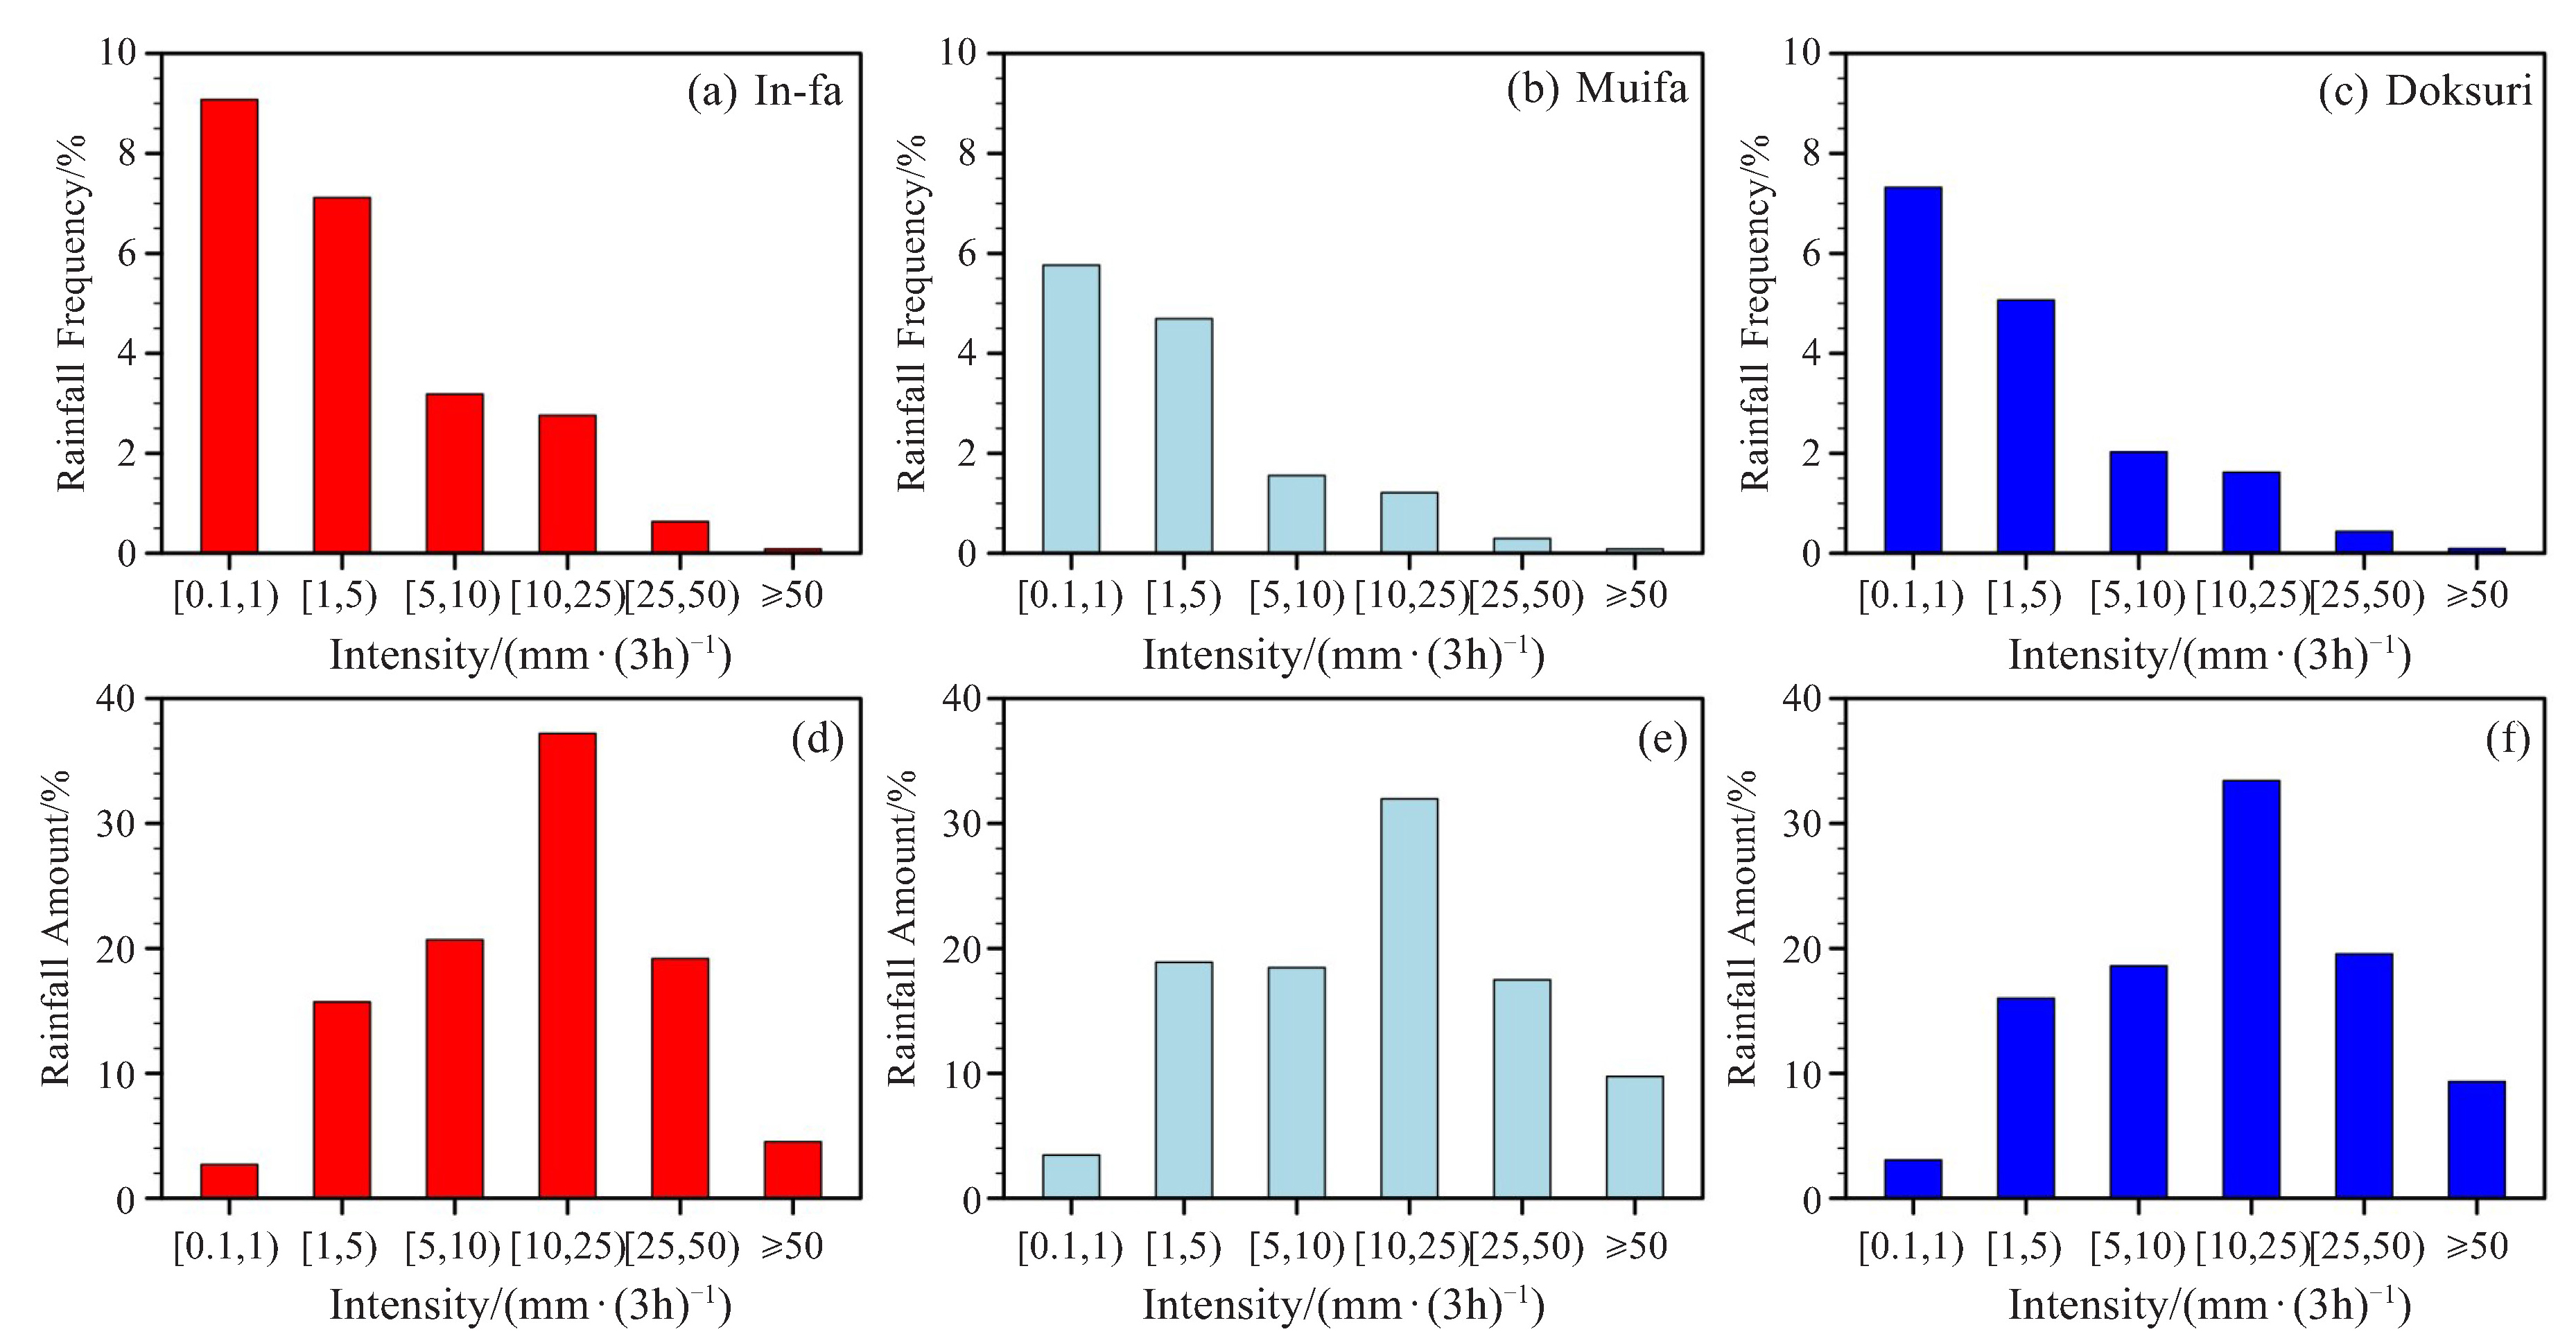
图 2 三次台风降水过程中不同强度降水的发生频率(a~c,单位:%)、降水量占比(d~f,单位:%)
a、d为“烟花”台风降水过程;b、e为“梅花”台风降水过程;c、f为“杜苏芮”台风降水过程。

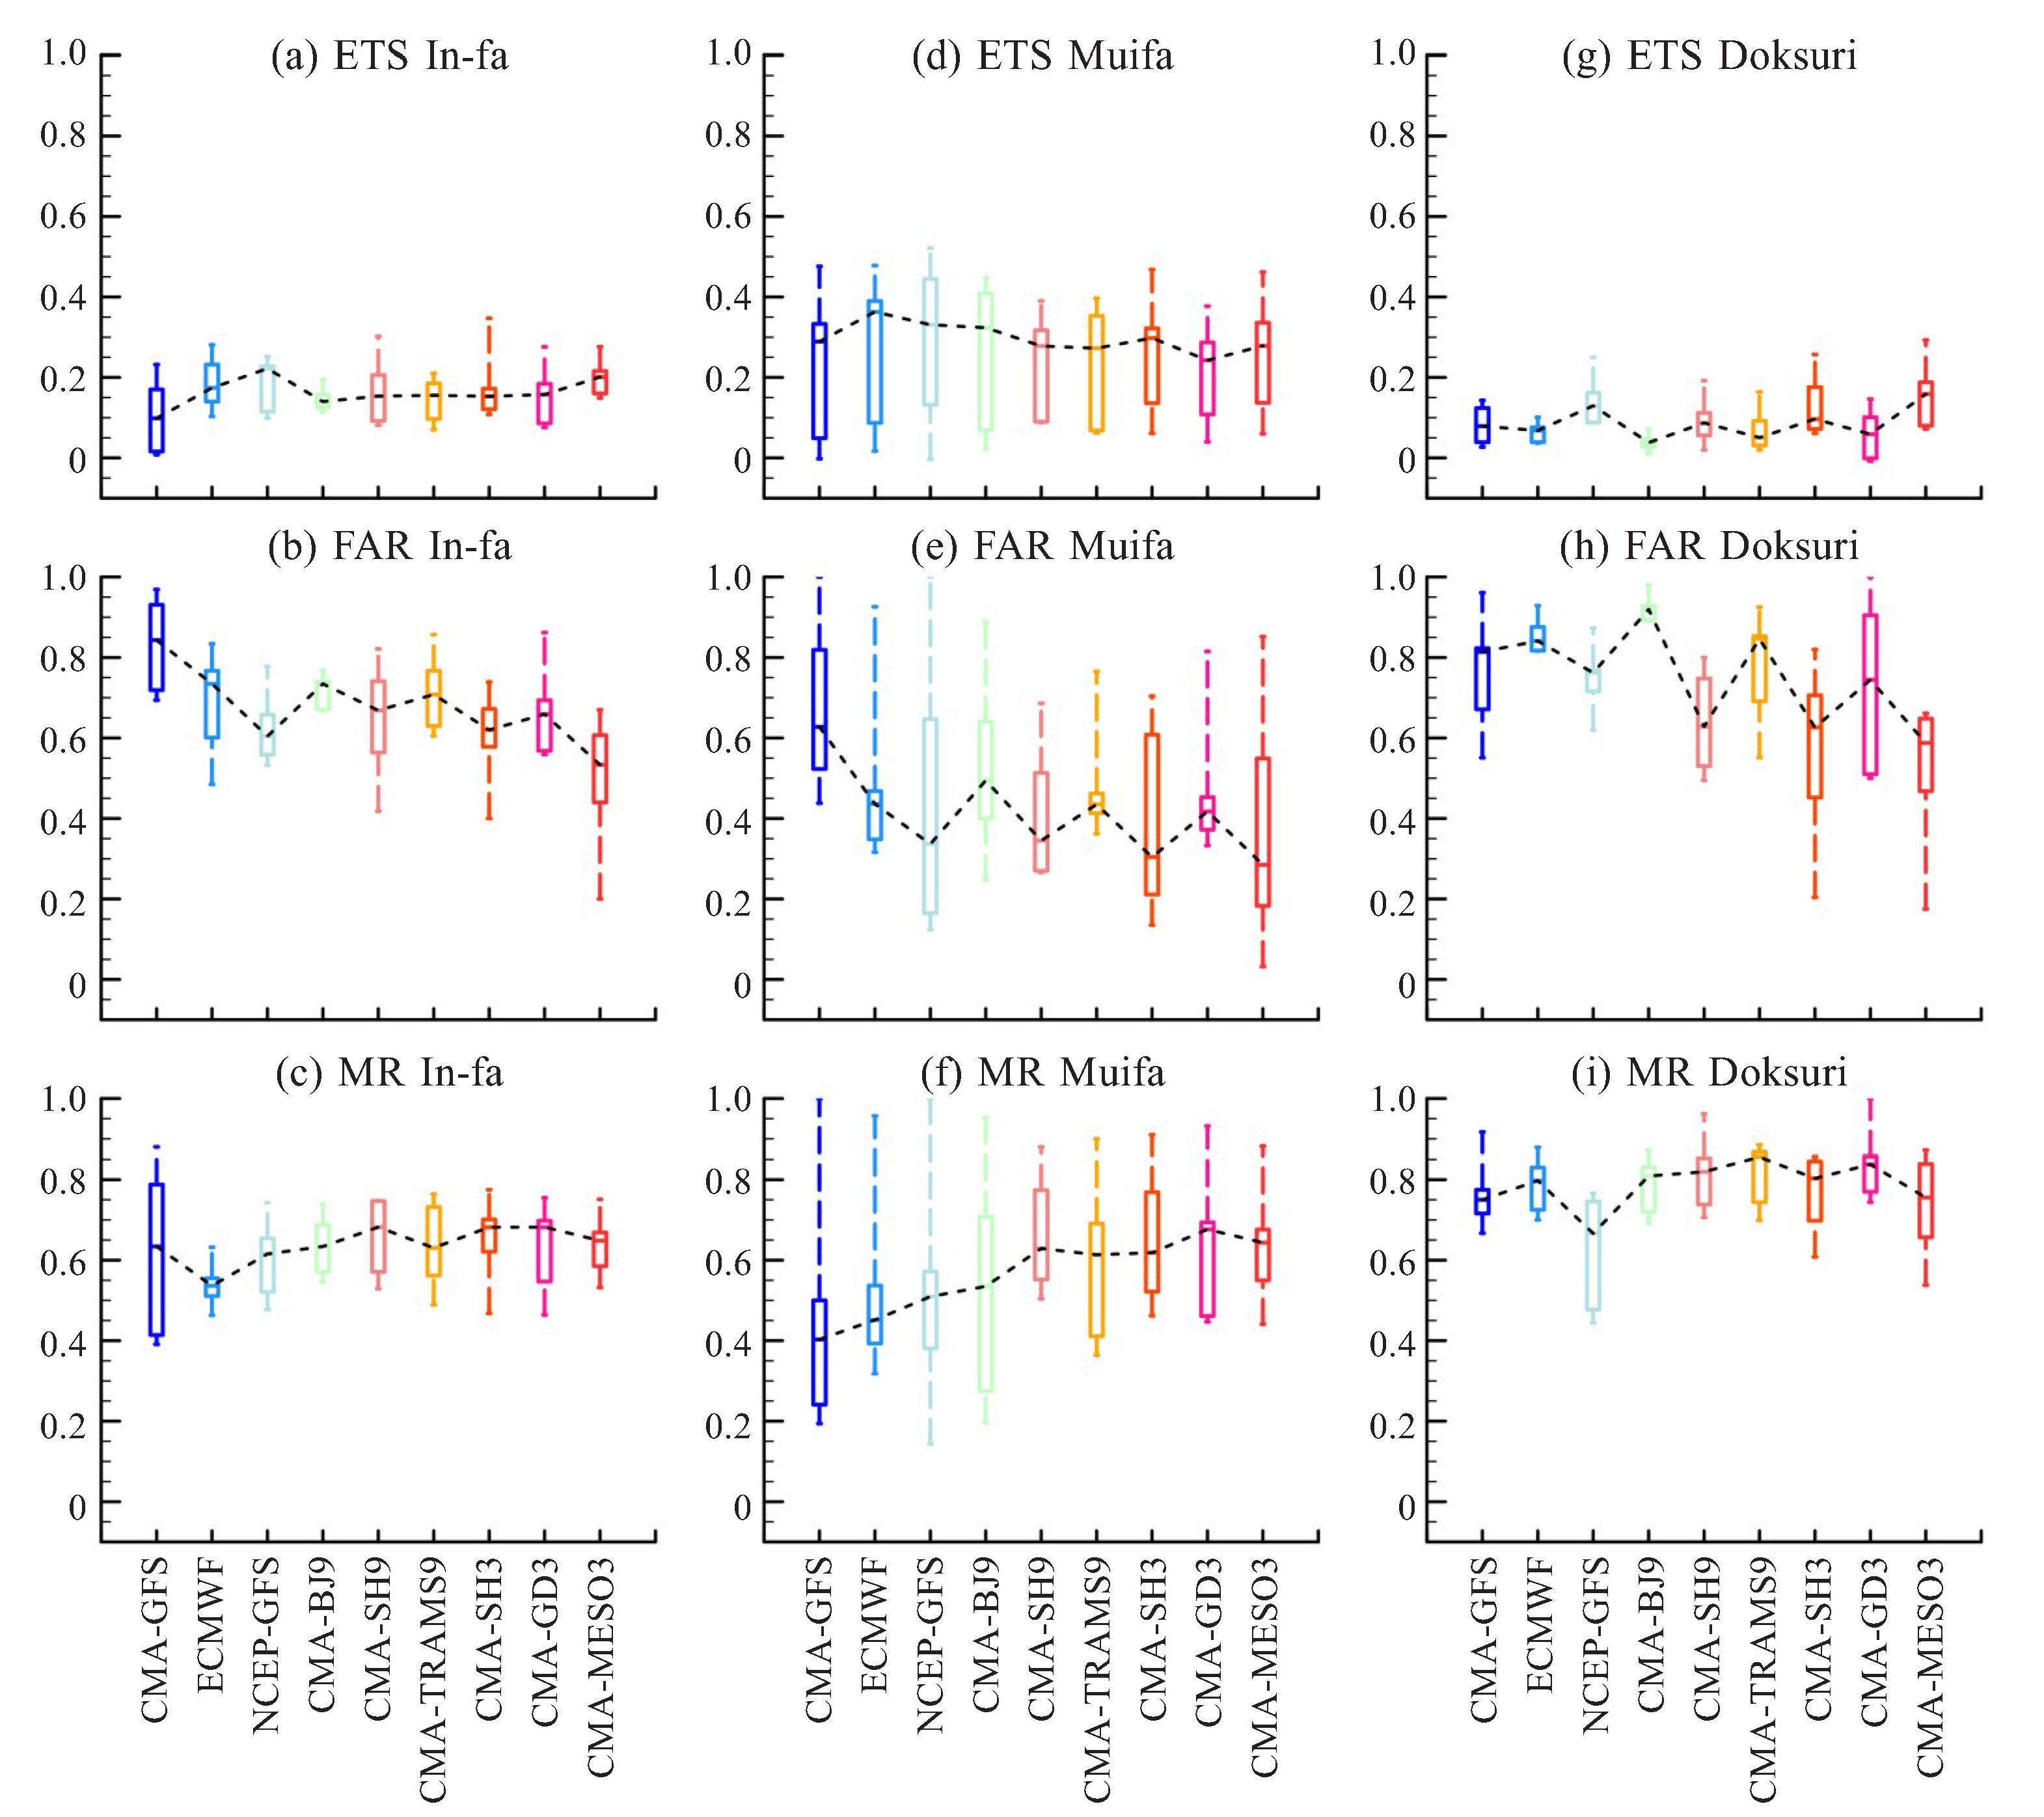
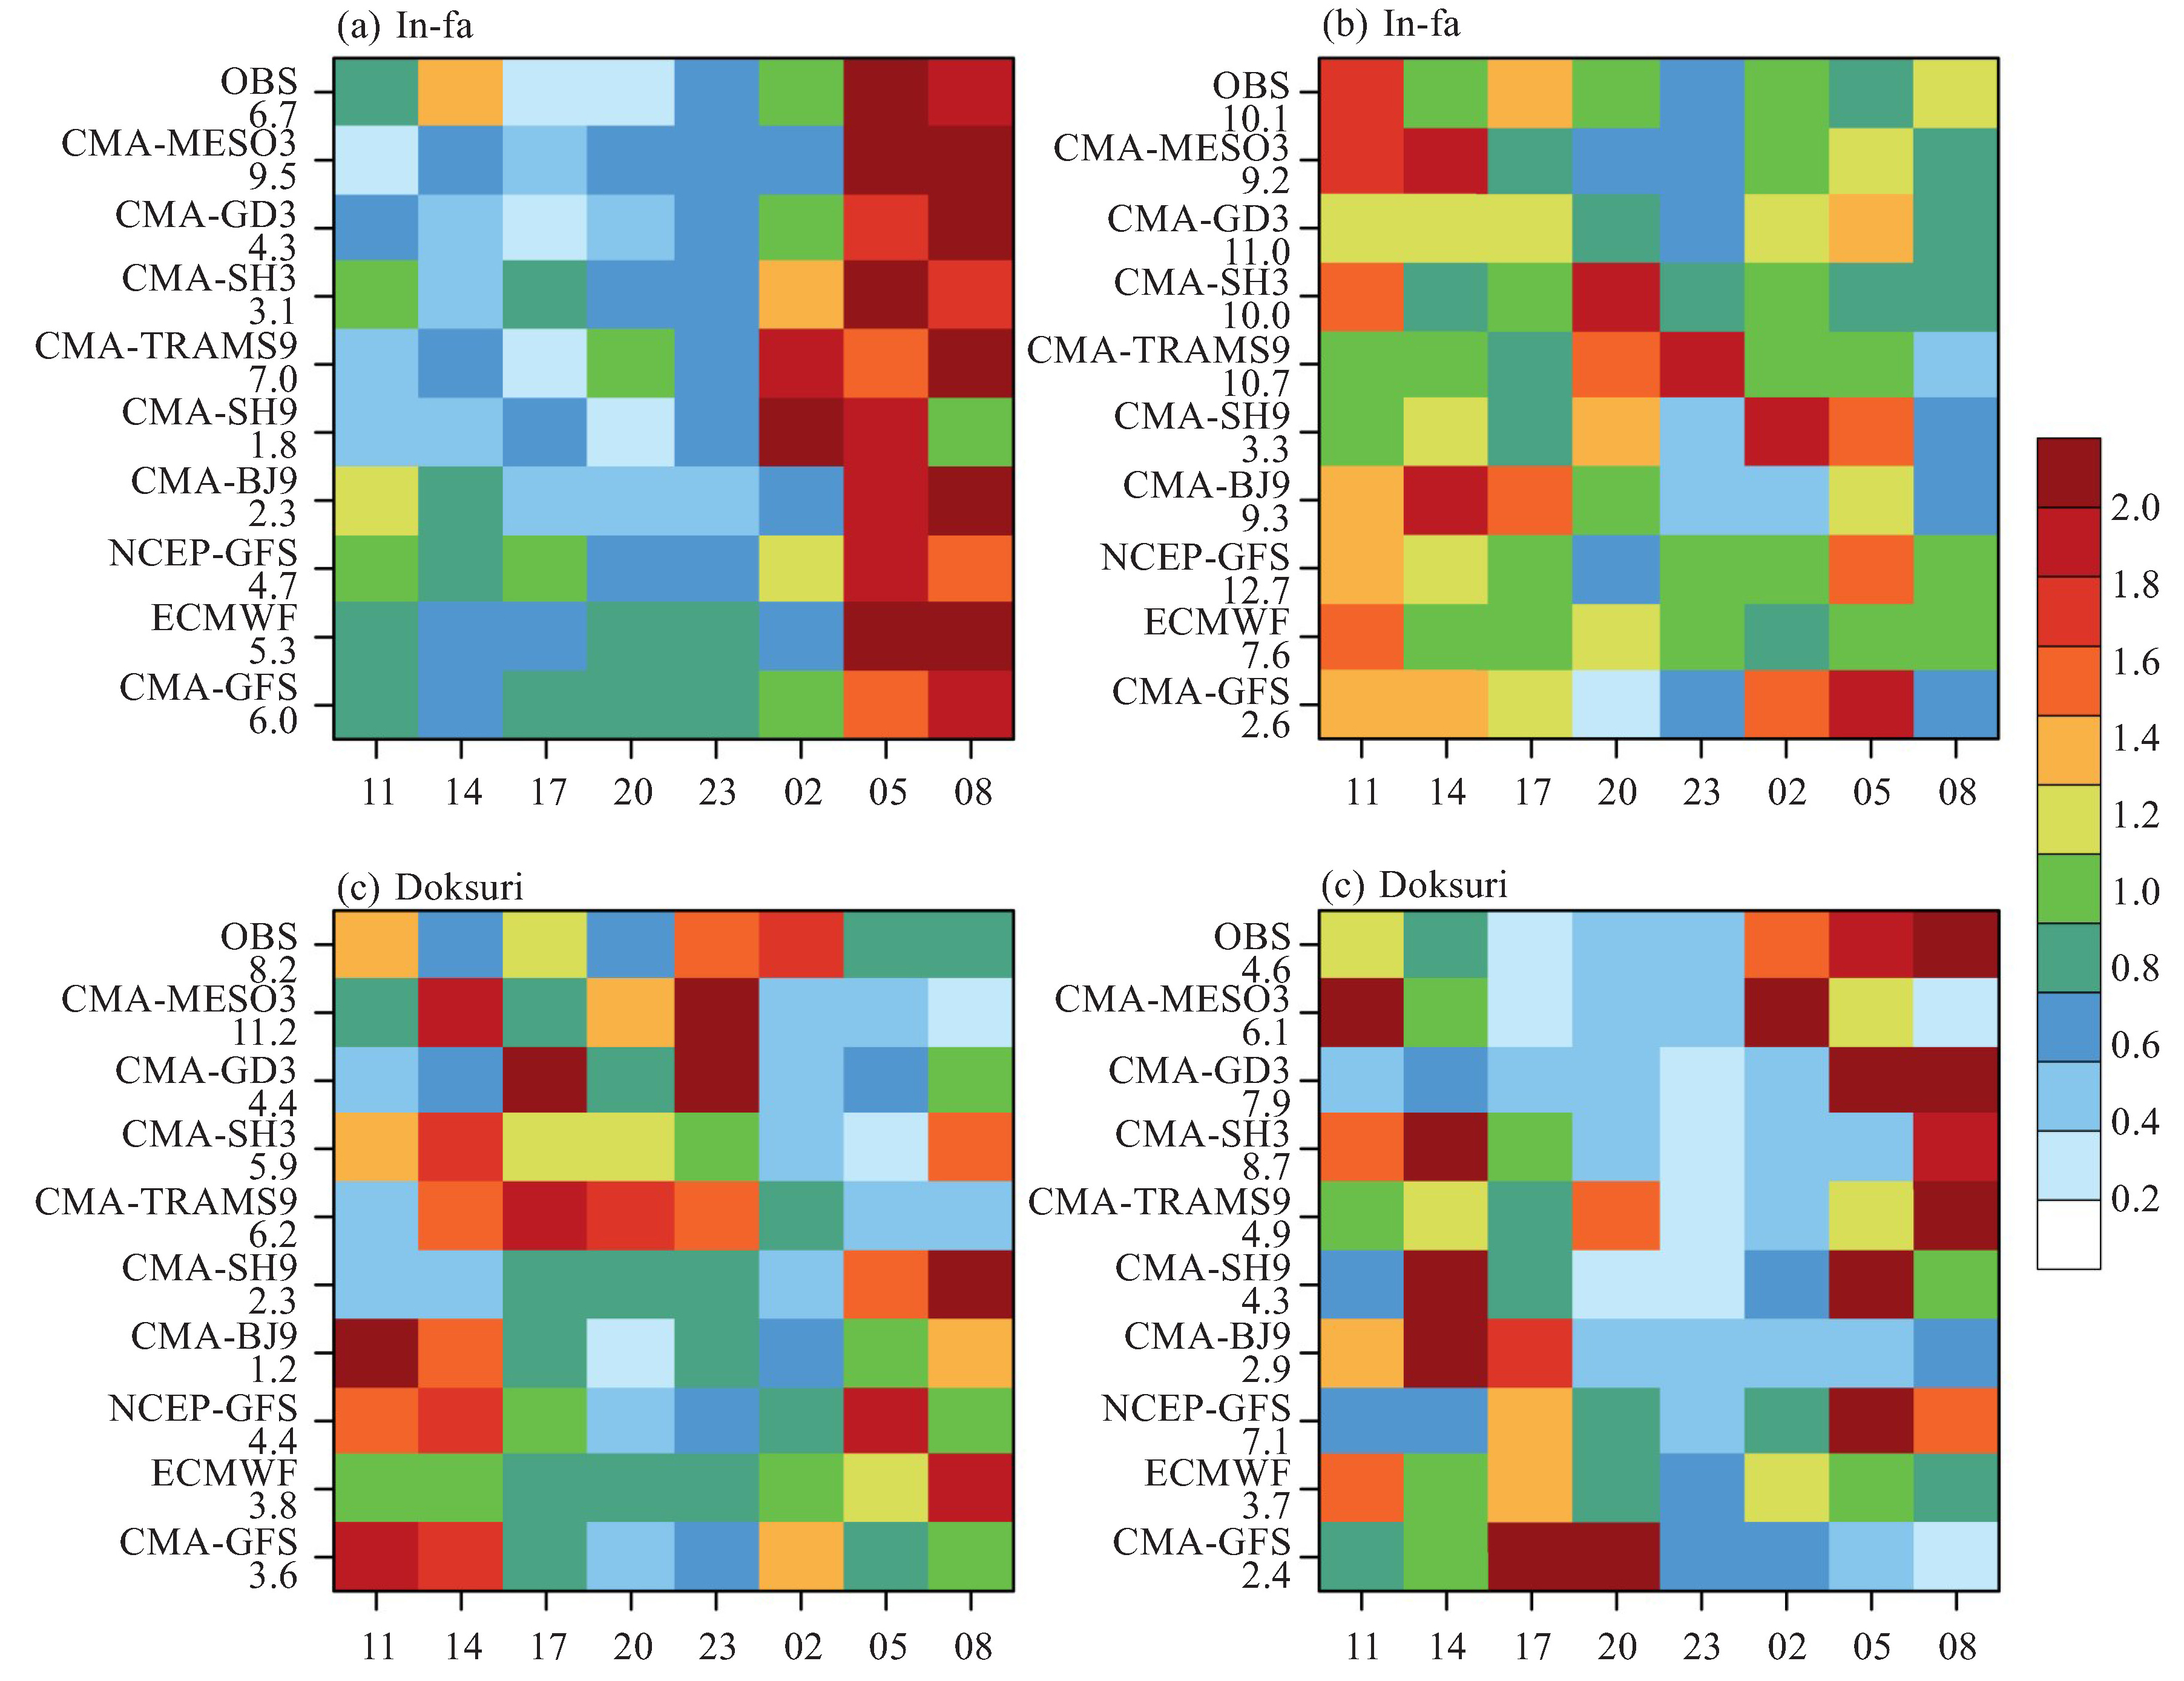
图 5 “烟花”台风过程中10 mm·(3 h)-1及其以上强度降水在24 h预报时效内逐3 h预报ETS(a)、FAR(b)、MR(c)评分的箱线图;(d~f)、(g~i)分别对应“梅花”、“杜苏芮”过程预报降水,虚线代表中位数连线

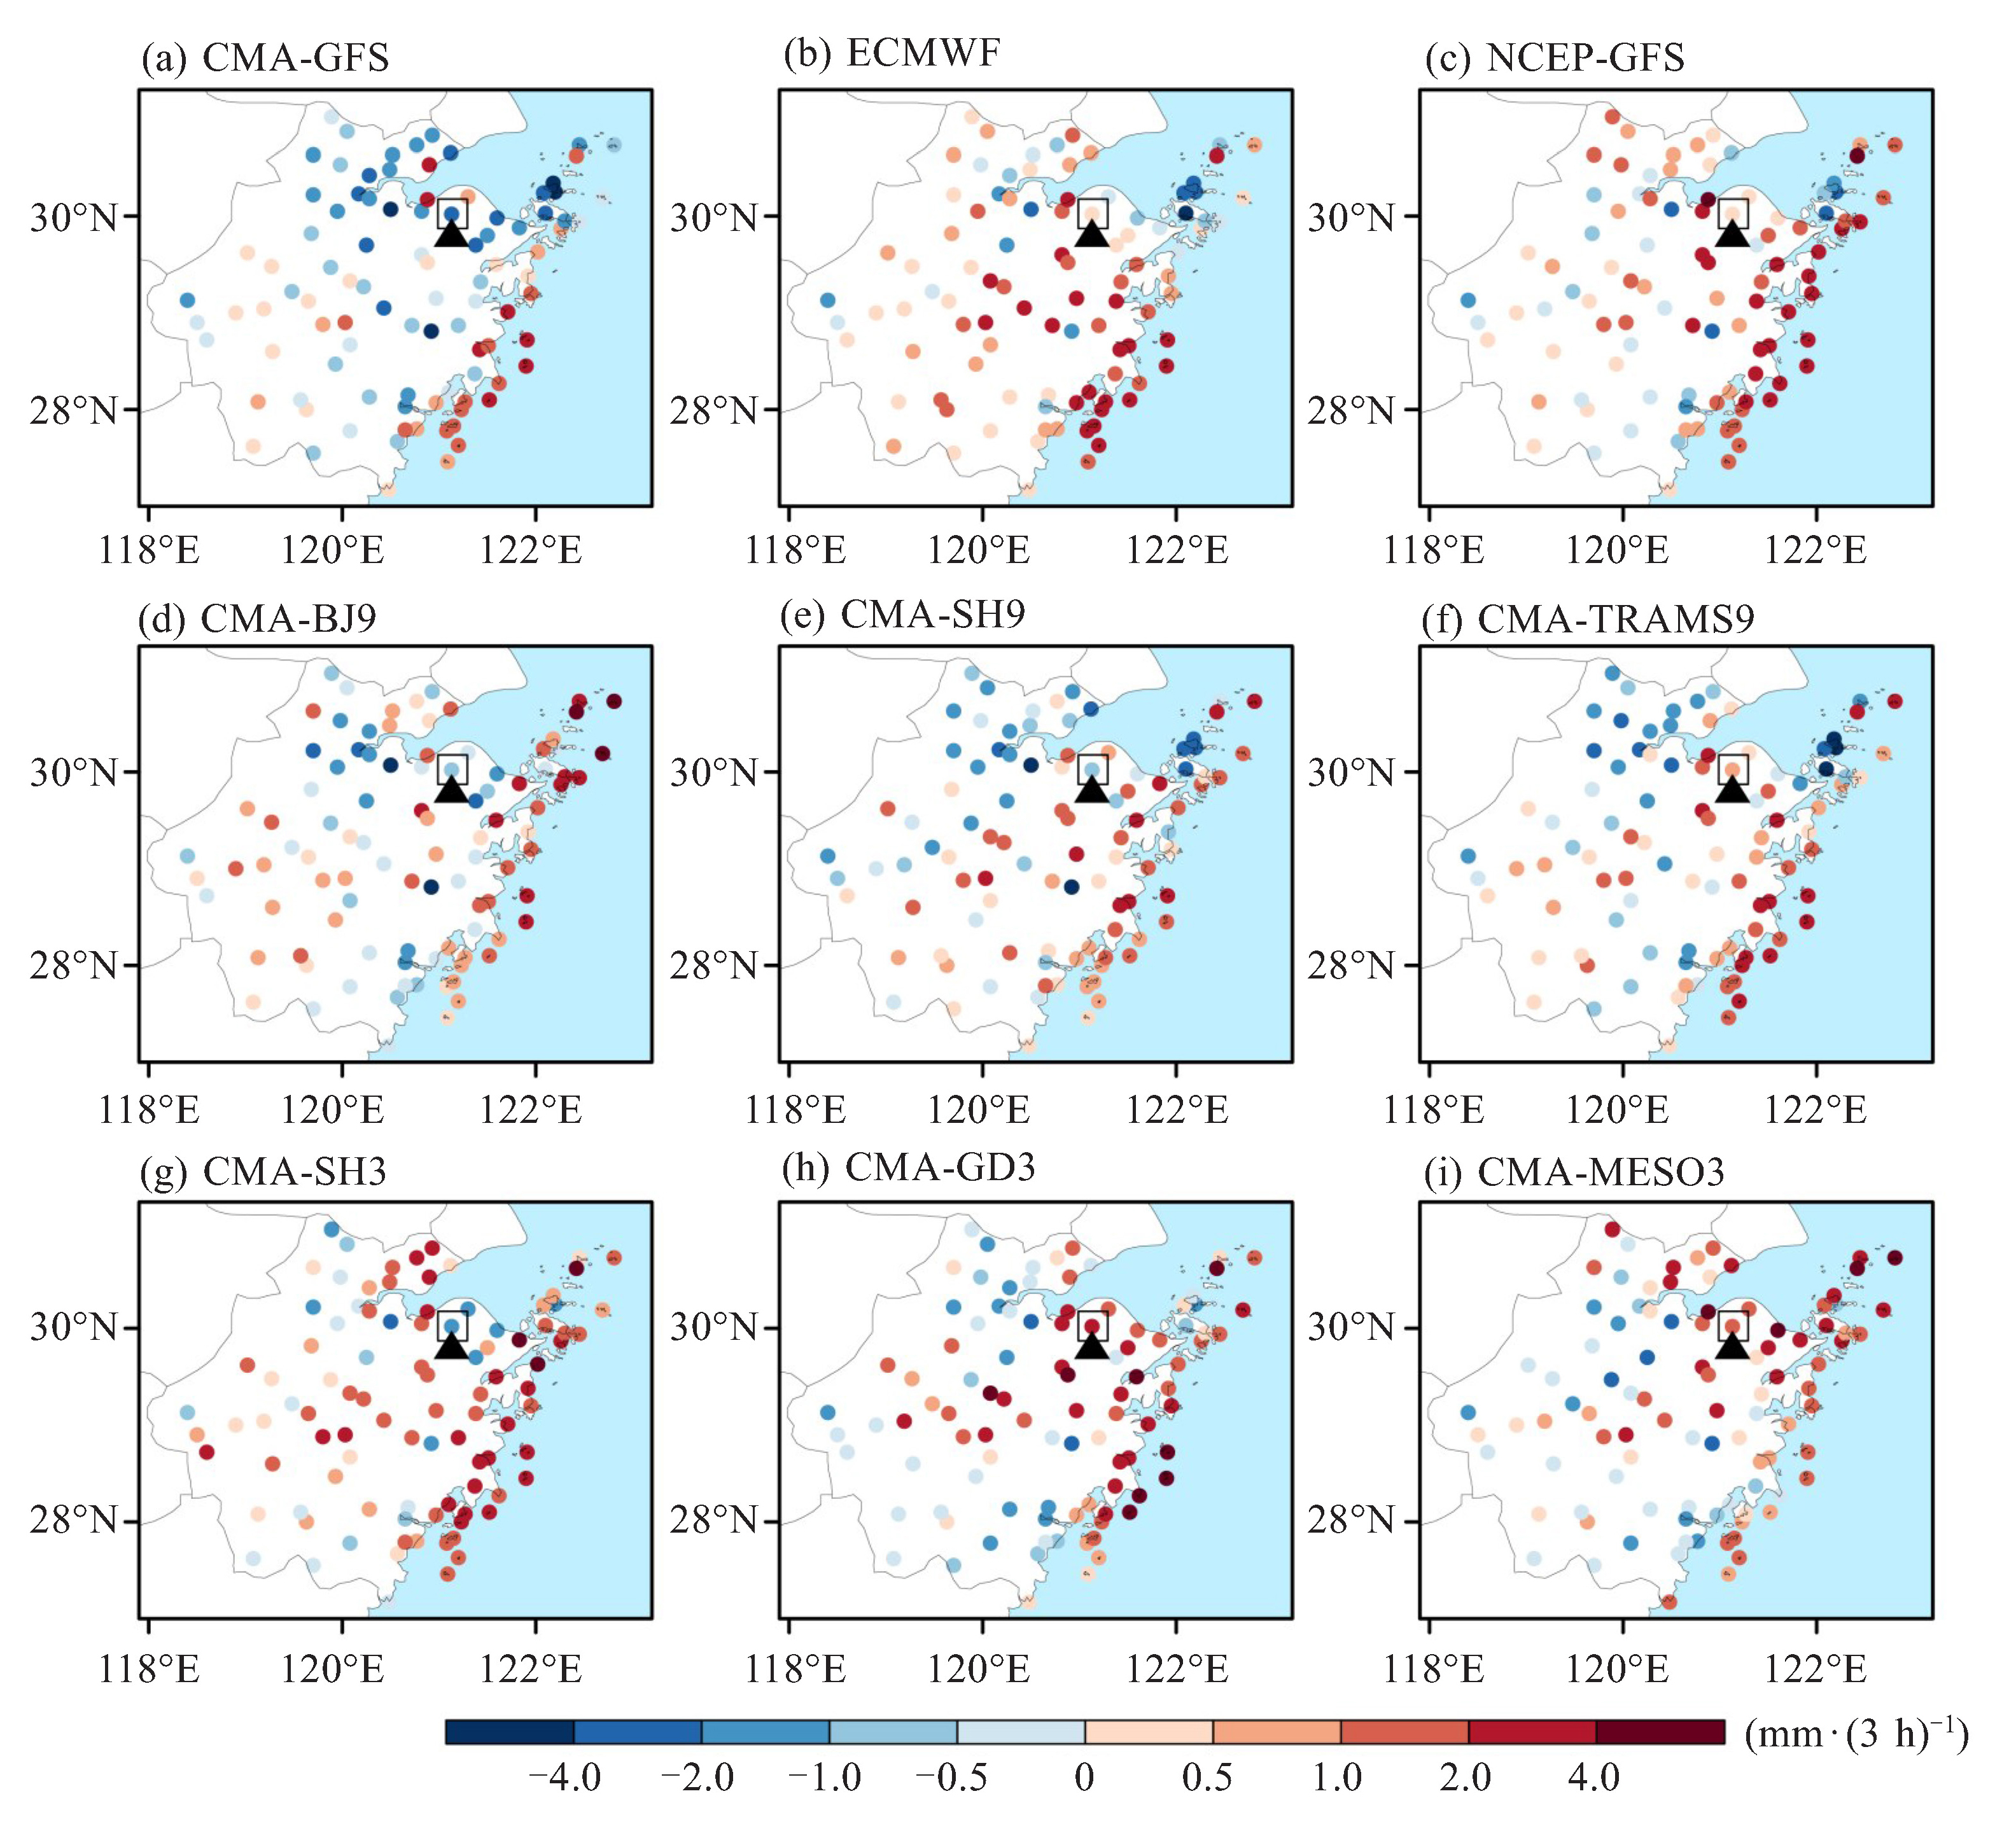
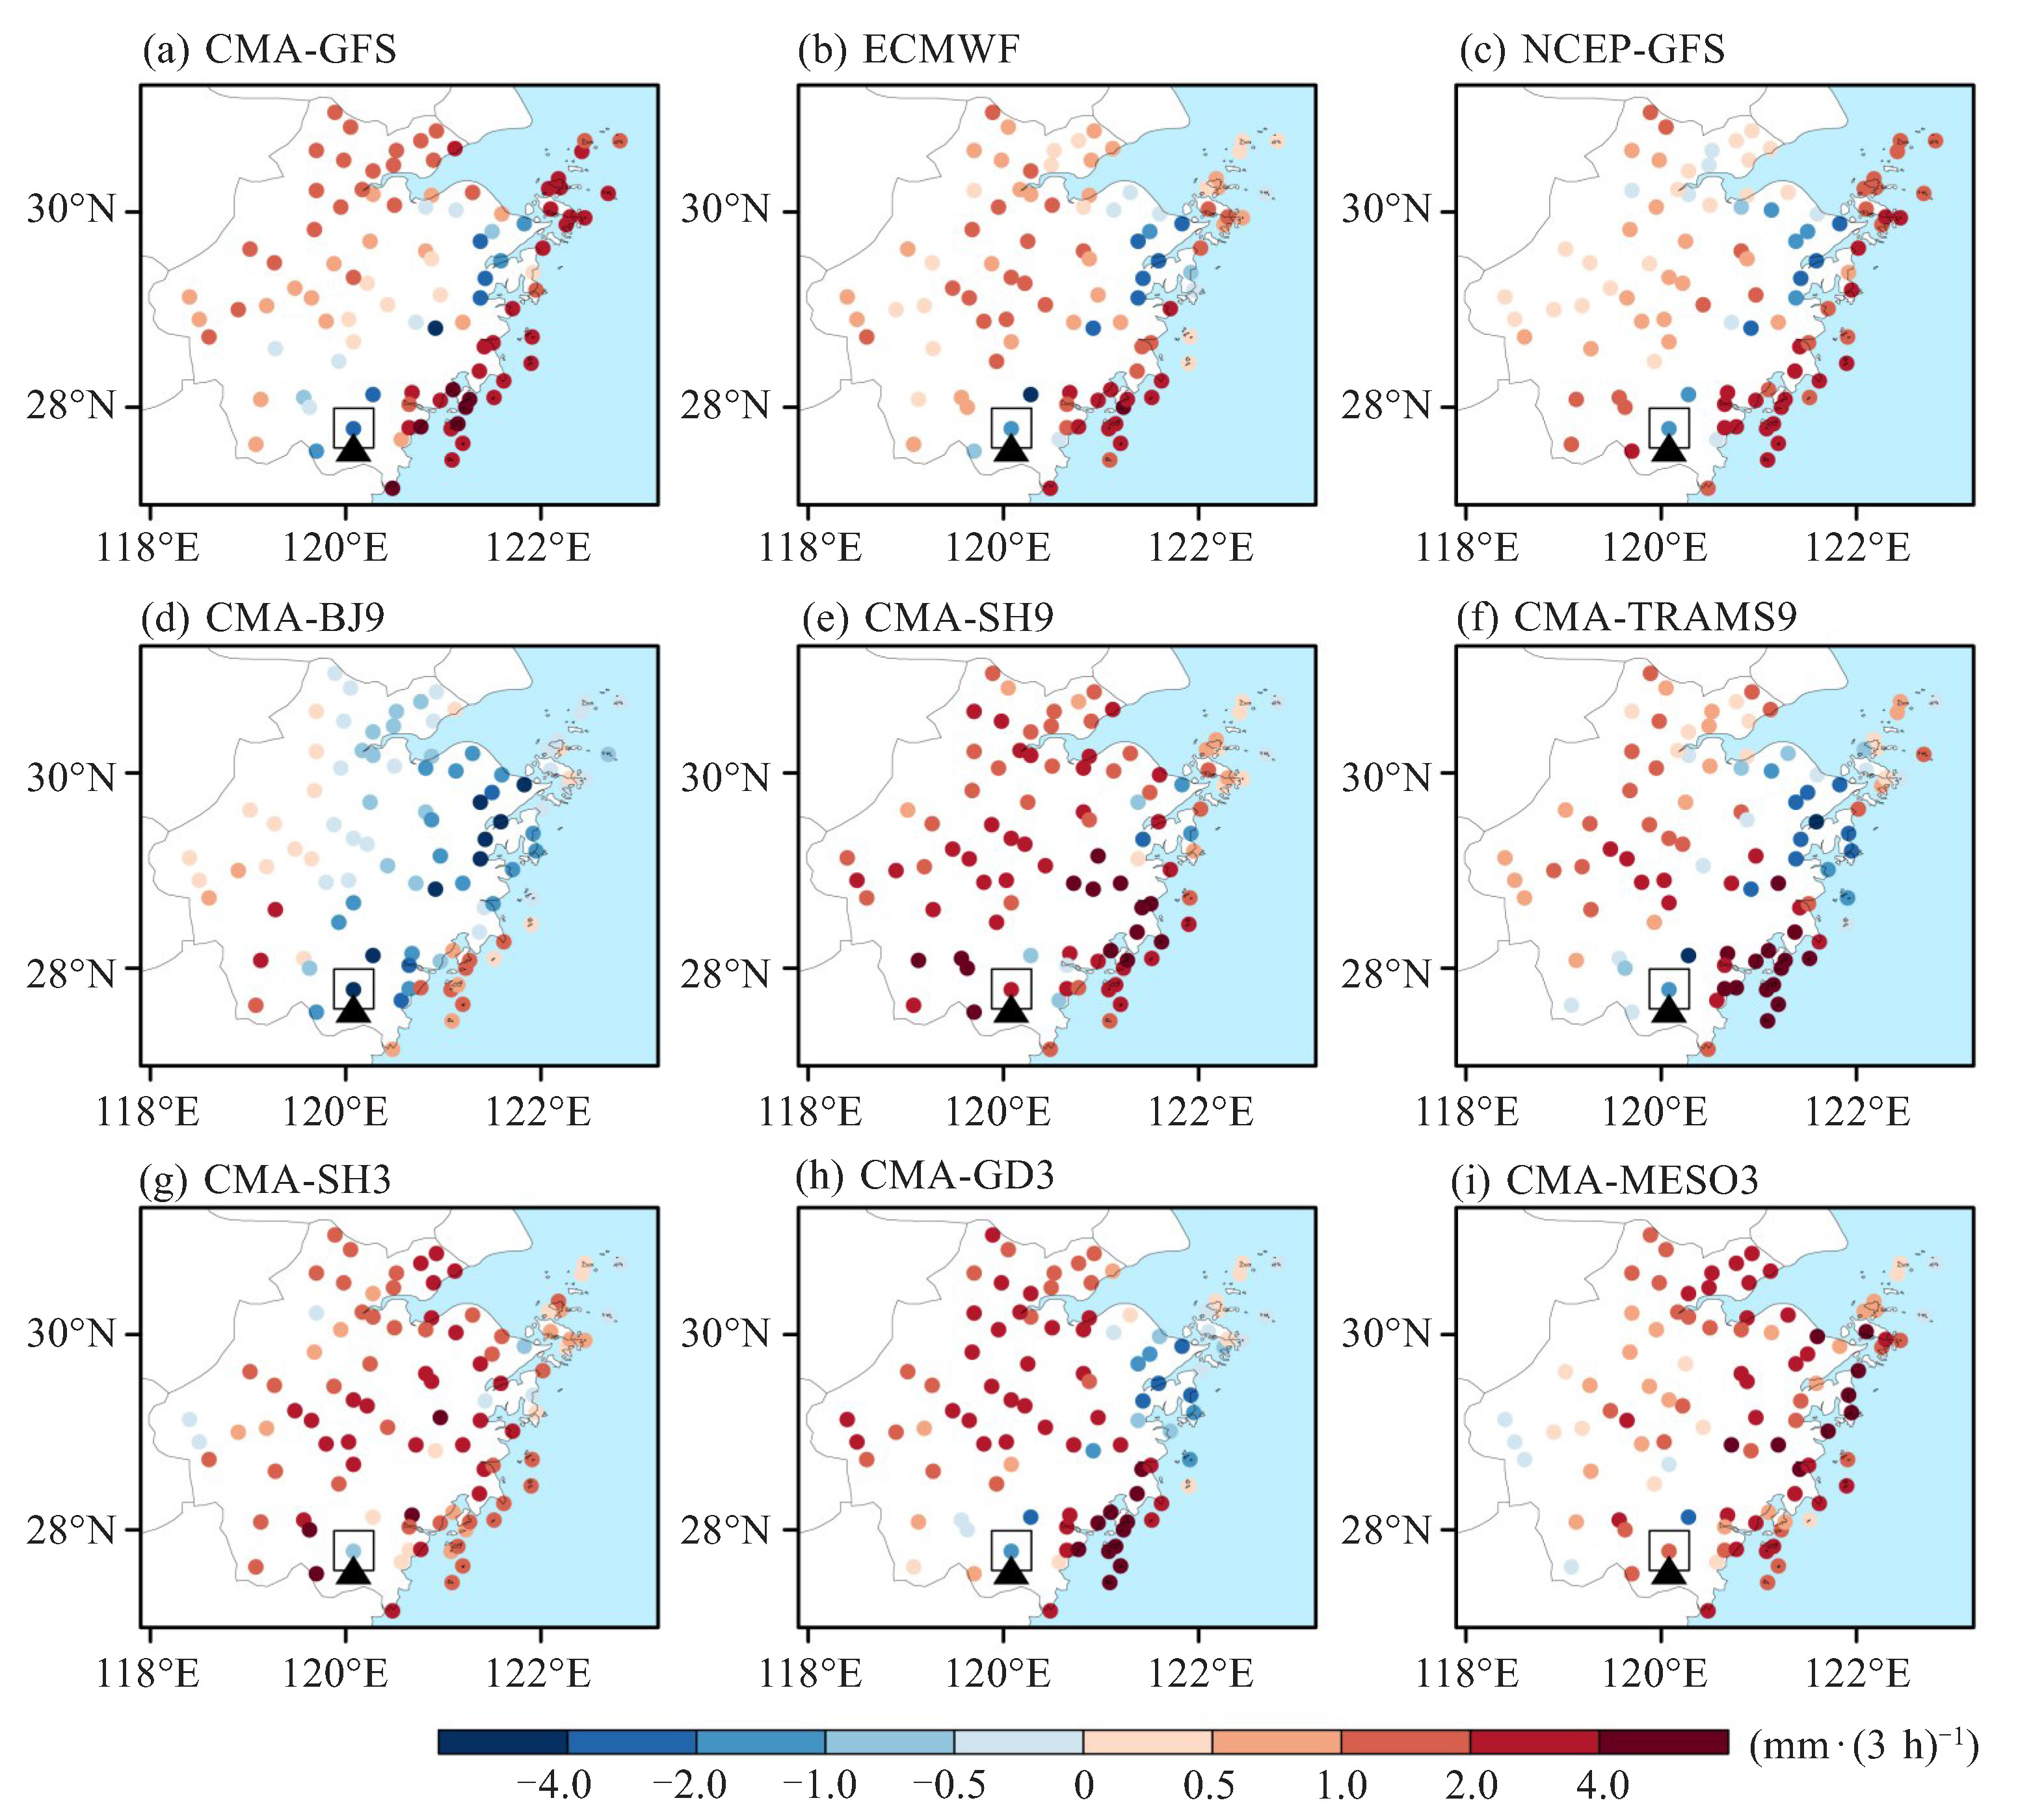
图 6 烟花过程中模式与观测平均3 h降水之差(mm·(3 h)-1,模式结果减去观测值)
黑色三角形为表 1中对应最大累计降水中心台站,正方形框区中心台站为后续日变化分析中选取的累计降水中心代表站。

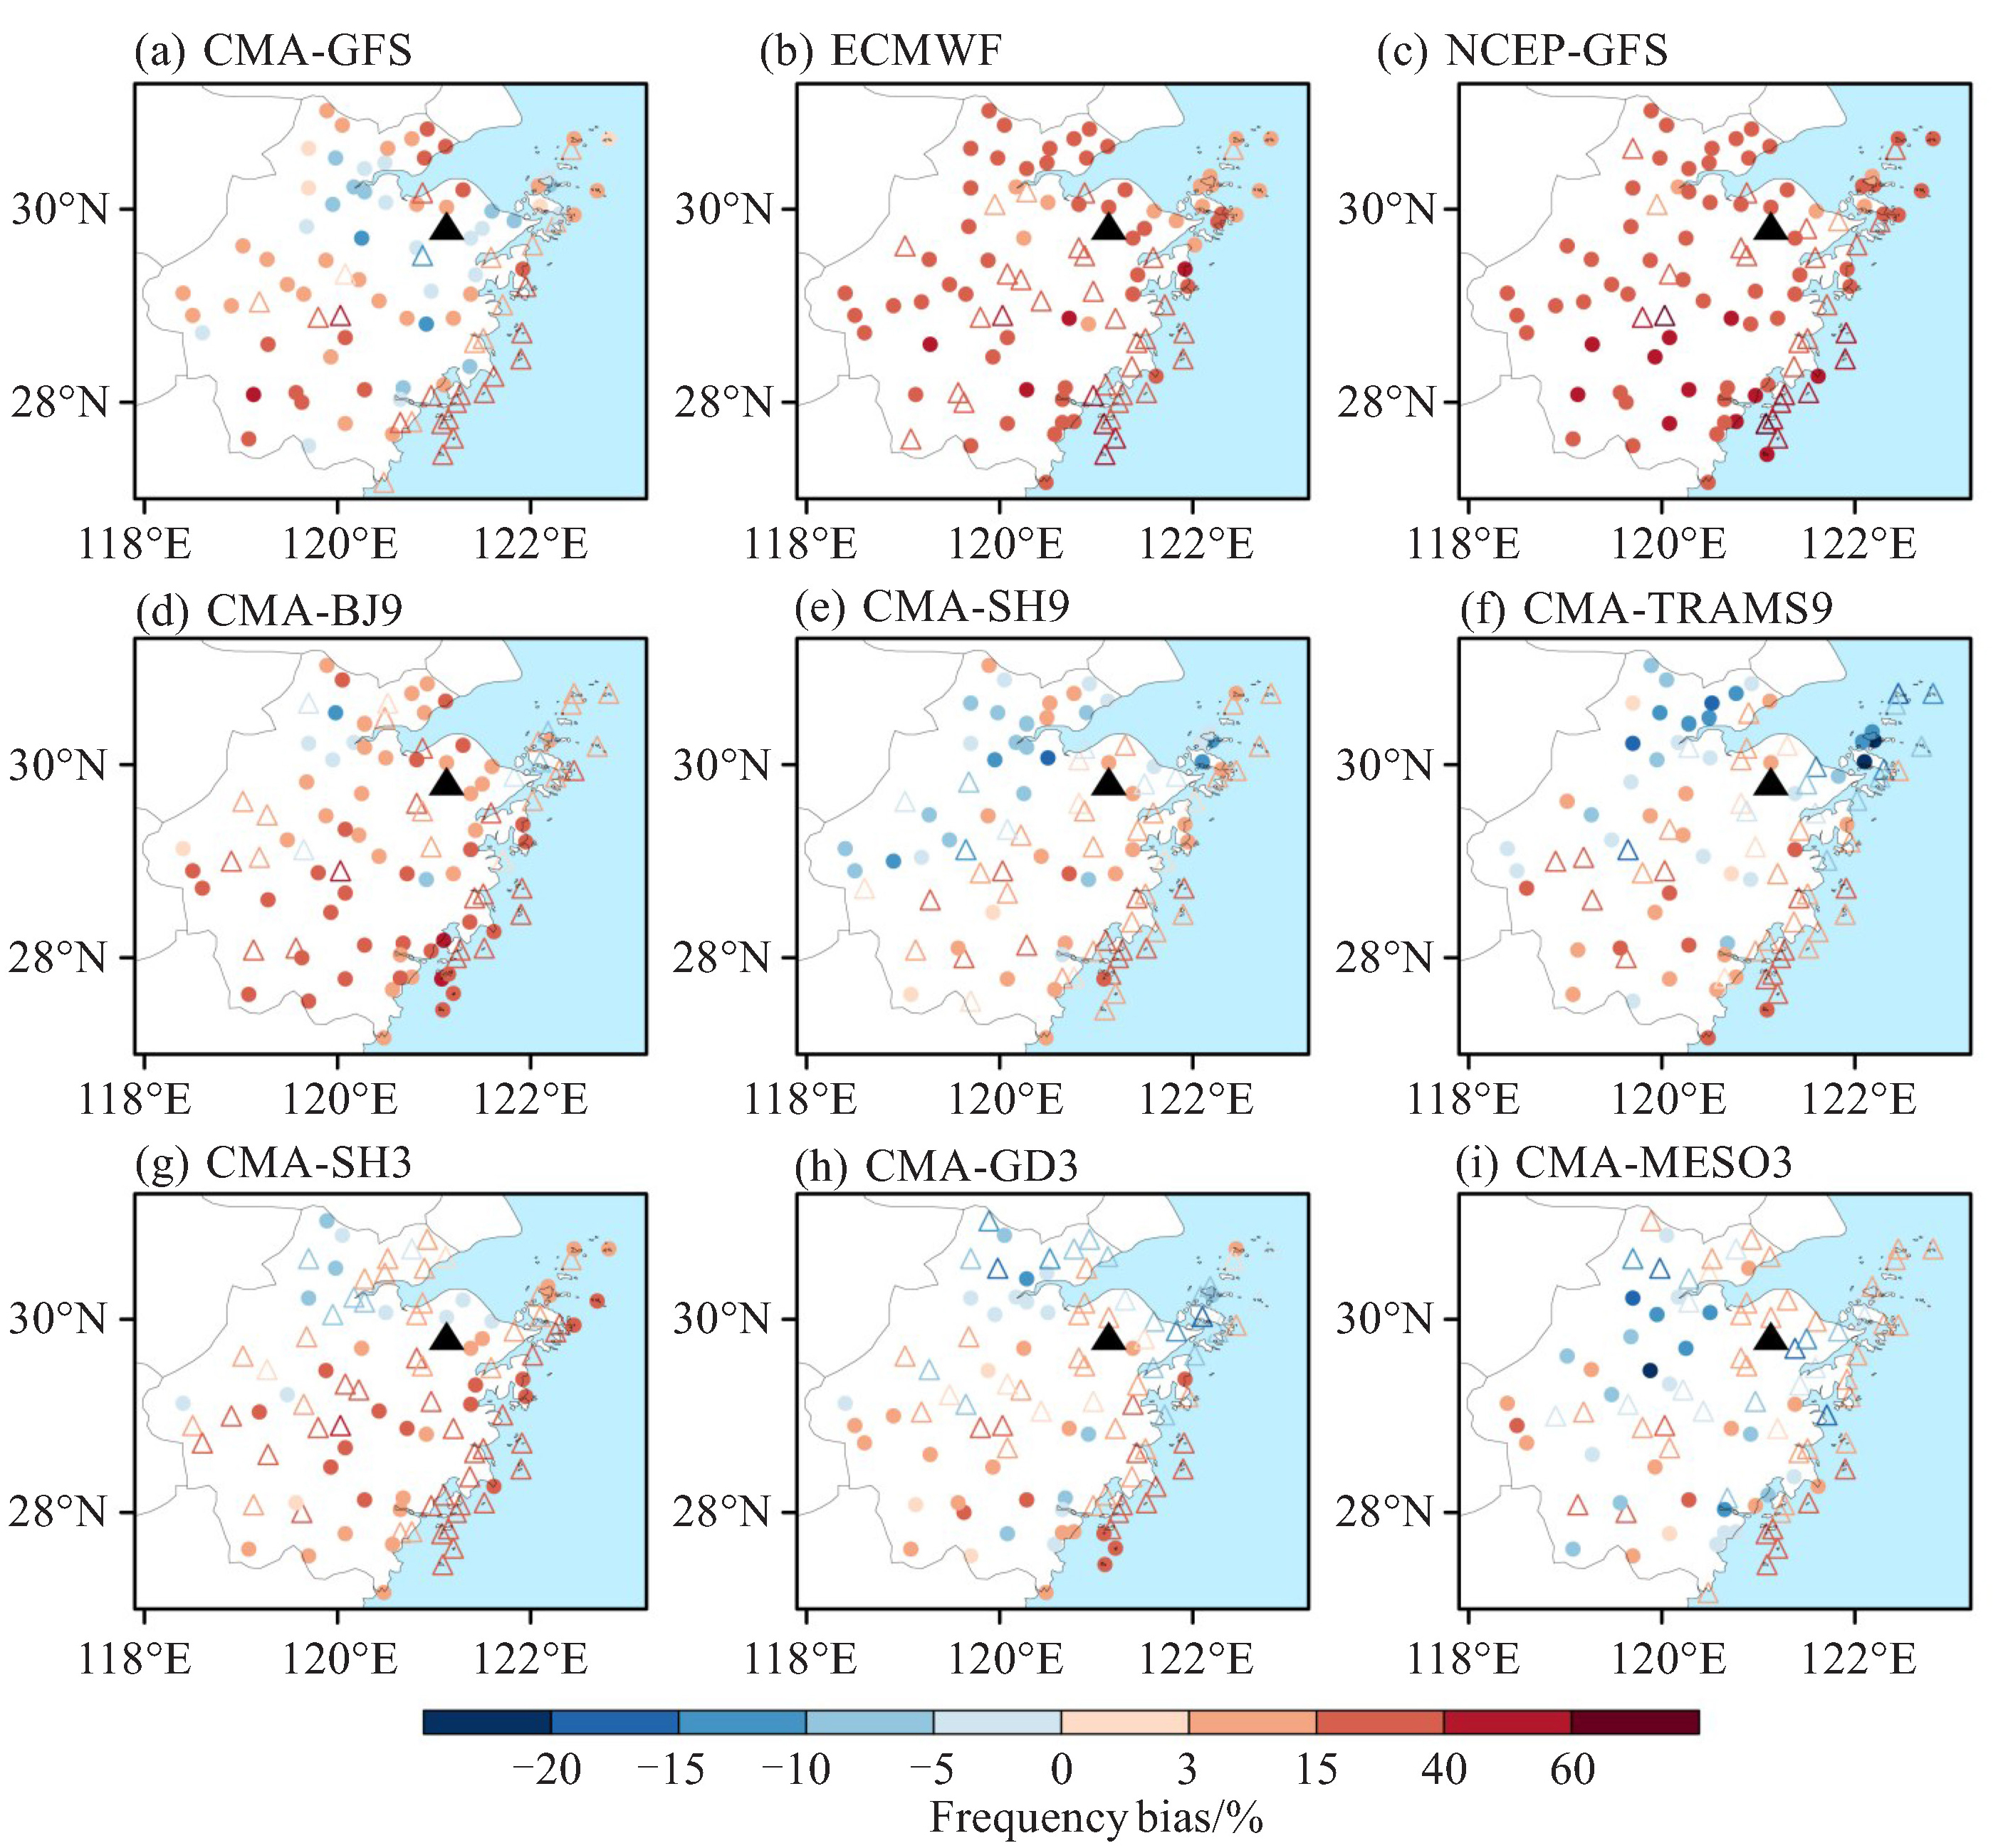
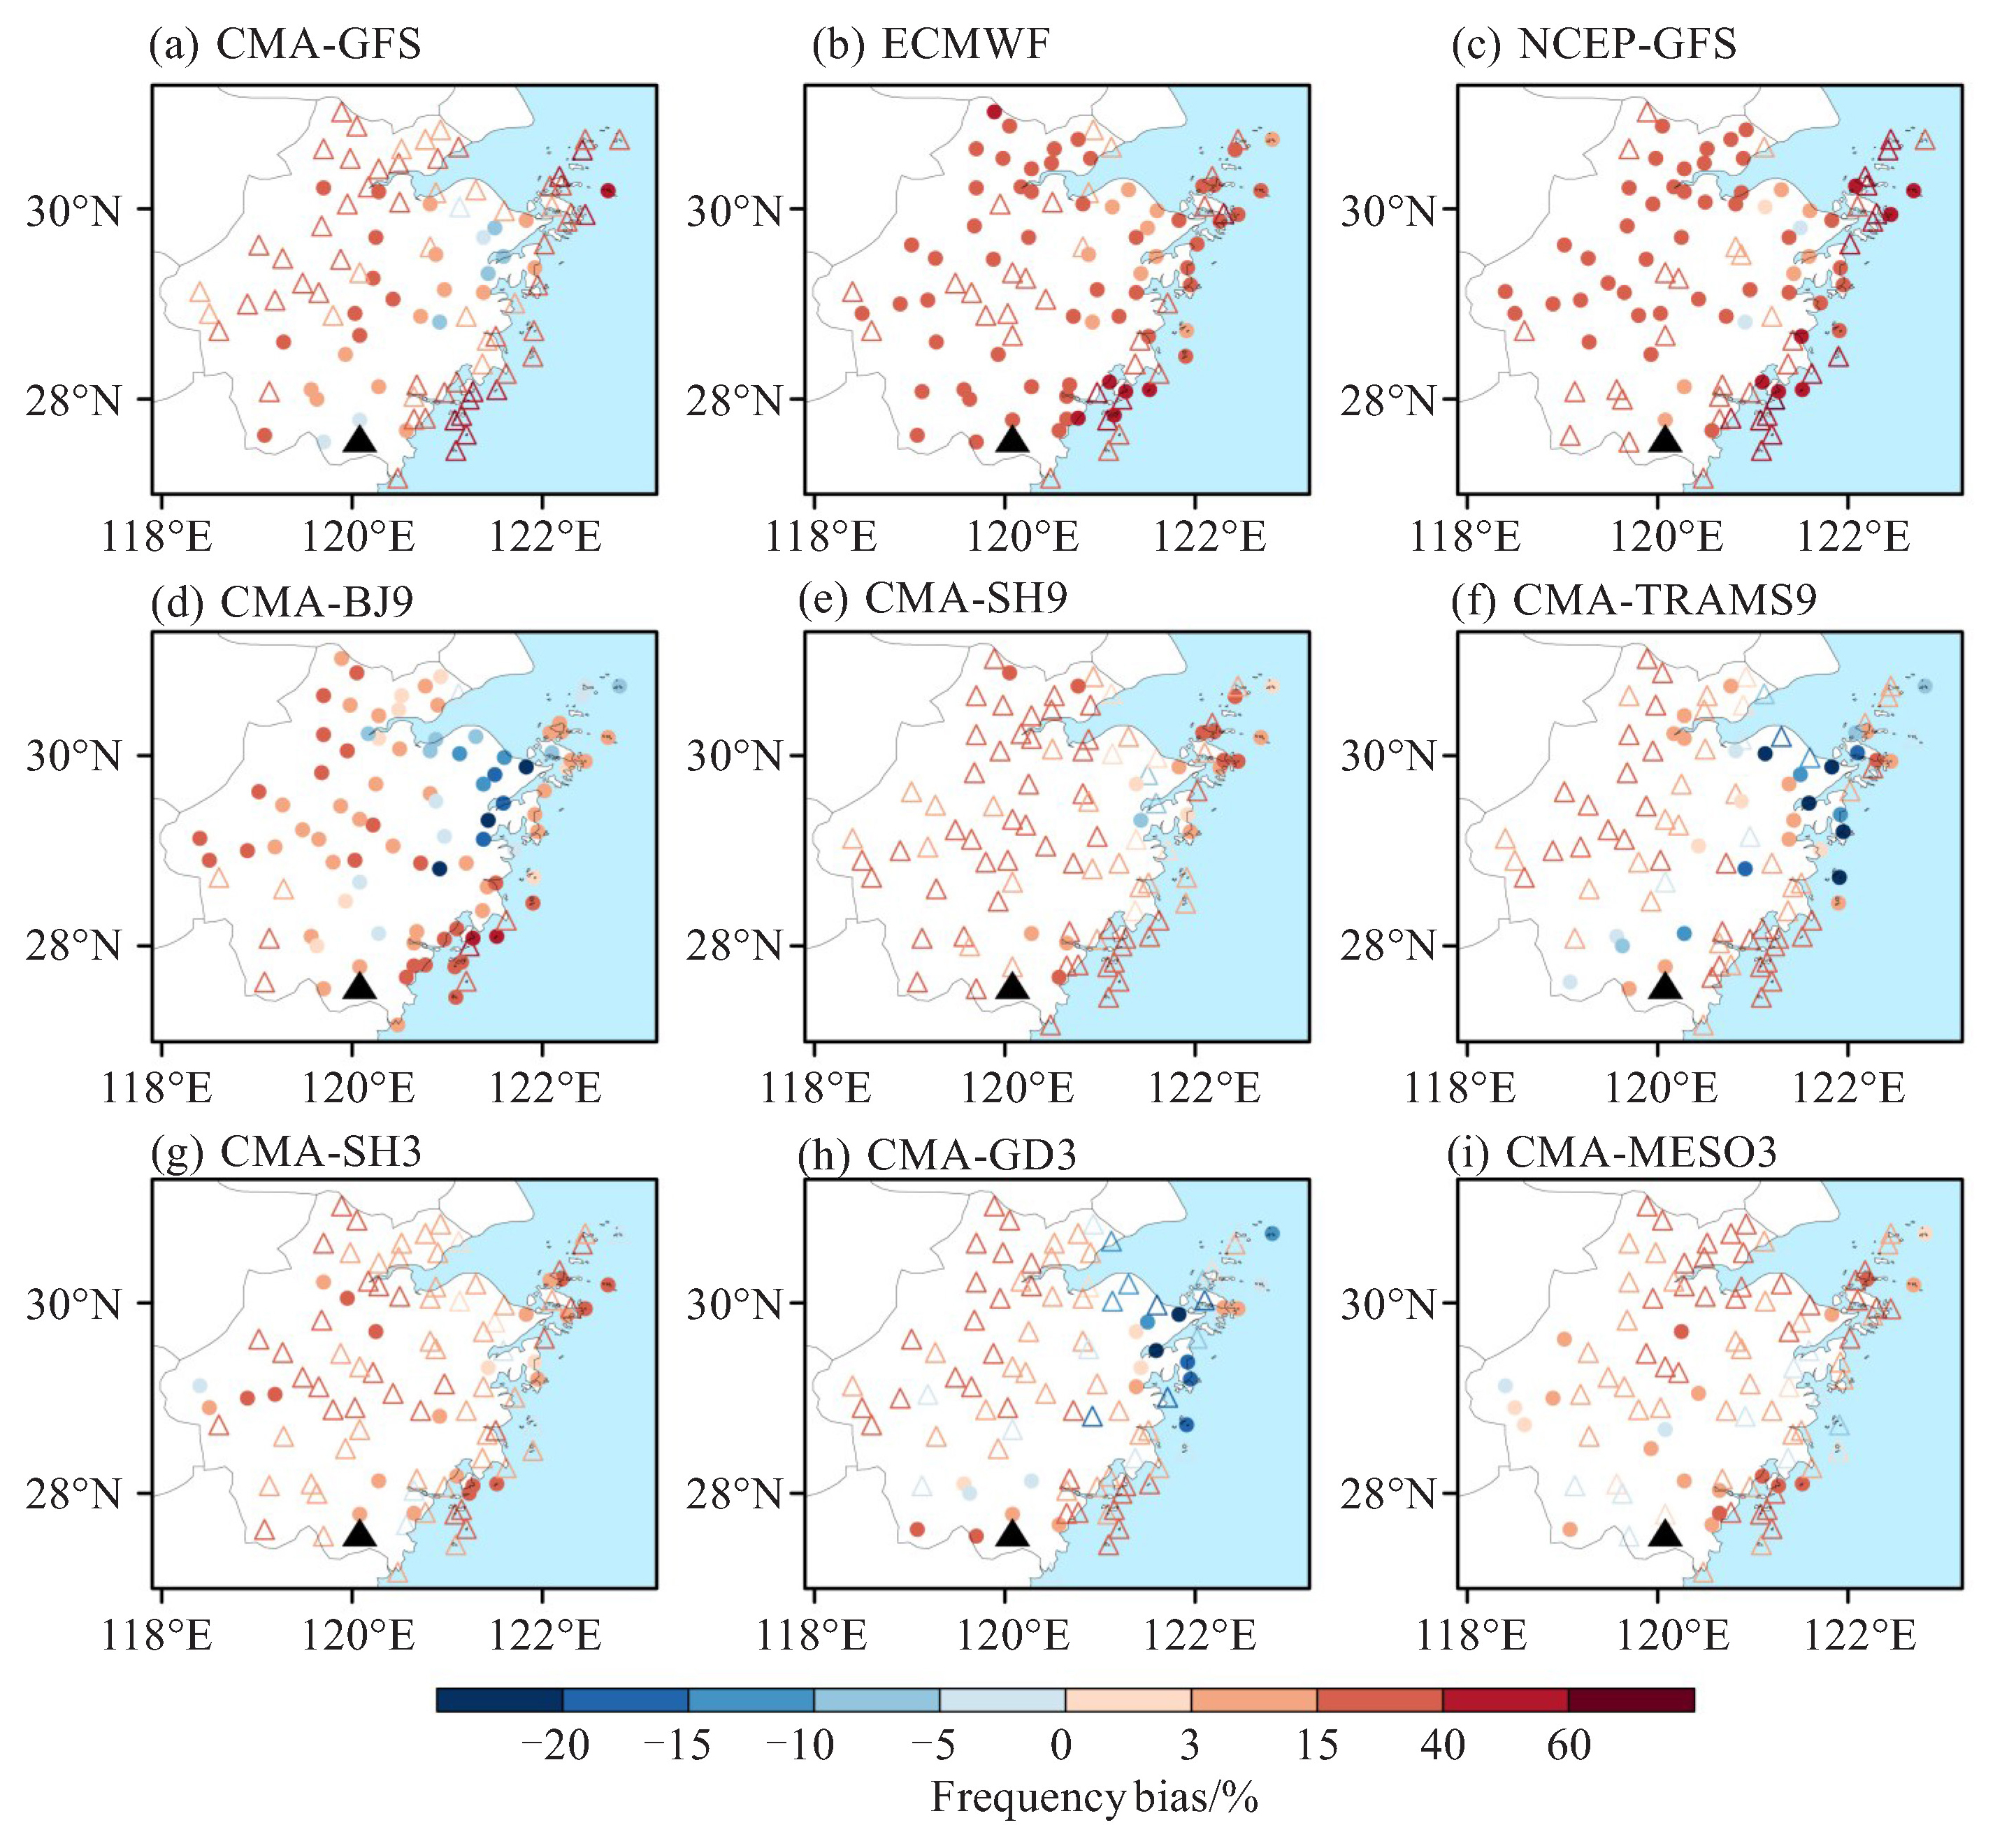
图 8 烟花”影响下模式各台站的降水频次和强度预报偏差分布(模式结果减去观测值)
其中填色代表降水频次偏差,三角形和圆点分别代表降水强度正偏差、负偏差;黑色三角形为表 1中对应最大累计降水中心台站。

表 1 三次台风概况
台风(编号) 起止时间 登陆情况 评估时段 最大过程累积降水站点 烟花(2106) 2021-07-16T12:00—07-31T00:00 2021-07-25T04:30在浙江省舟山市普陀区登陆(42 m·s -1,960 hPa),2021-07-26T01:50在浙江省平湖市第二次登陆(42 m·s -1,960 hPa) 2021-07-22T00:00—07-28T00:00 余姚市大岚镇丁家畈1 034 mm 梅花(2212) 2022-09-06T06:00—09-16T21:00 2022-09-14T12:30在浙江省舟山市普陀区登陆(42 m·s -1,960 hPa),2022-09-14T16:30在上海市奉贤区第二次登陆 2022-09-11T00:00—09-16T00:00 余姚市大岚镇夏家岭707 mm 杜苏芮(2305) 2023-07-20T12:00—07-31T00:00 2023-07-28T01:55在福建省晋江市沿海登陆(50 m·s-1,945 hPa) 2023-07-25T00:00—07-31T00:00 文成县桂山乡三垟889 mm  下载: 导出CSV
表 2 模式名称及其空间分辨率、预报范围
模式 水平分辨率 模式区域覆盖范围 CMA-MESO3 3 km 70~145 °E,10~60.10 °N, CMA-SH3 3 km 106.61~136.03 °E,17.38-43.41°N CMA-GD3 3 km 93.64~126.34 °E,16.60~42.88 °N CMA-BJ9 9 km 60.59~149.40 °E,13.51~57.74 °N, CMA-SH9 9 km 52.79~157.19 °E,7.3-59.8 °N CMA-TRAMS9 9 km 70~160 °E,0.8~54.8 °N, ECMWF 12.5 km 全球 CMA-GFS 25 km(2023年5月22日后为12.5 km) 全球 NCEP-GFS 25 km 全球
下载: 导出CSV
表 3 模式和观测的过程累计降水空间相关系数
模式 “烟花”过程 “杜苏芮”过程 CMA-GFS 0.61** 0.49** ECMWF 0.76** 0.31** NCEP-GFS 0.78** 0.57** CMA-BJ9 0.71** 0.75** CMA-SH9 0.73** 0.22** CMA-TRAMS9 0.69** 0.34** CMA-SH3 0.78** 0.09 CMA-GD3 0.72** 0.61** CNA-MESO3 0.83** 0.70** 注:**代表通过0.01水平的显著性检验。
下载: 导出CSV
-
[1] CHEN Y, EBERT E E, DAVIDSON N E, et al. Application of Contiguous Rain Area (CRA) Methods to Tropical Cyclone Rainfall Forecast Verification[J]. Earth Space Sci, 2018, 5(11): 736-752. [2] LUO Y, SUN J, LI Y, et al. Science and prediction of heavy rainfall over China: Research progress since the reform and opening-up of new China[J]. J Meteorol Res, 2020, 34: 427-459. [3] LIU K S, CHAN J C. Growing threat of rapidly-intensifying tropical cyclones in East Asia[J]. Adv Atmos Sci, 2022 39(2): 222-234. [4] 陈联寿, 端义宏, 宋丽莉, 等. 台风预报及其灾害[M]. 北京: 气象出版社, 2012. [5] YU Z, CHEN Y J, EBERT B, et al. Benchmark rainfall verification of landfall tropical cyclone forecasts by operational ACCESS‐TC over China[J]. Meteorol Appl, 2020, 27(1): e1842. [6] UTSUMI N, KIM, H. Observed influence of anthropogenic climate change on tropical cyclone heavy rainfall[J]. Nat Clim Change, 2022, 12 (5): 436-440. [7] LIU L, YANG B, JIANG X, et al. Changes in tropical cyclone-induced extreme hourly precipitation over China during 1975-2018[J]. J Climate, 2022, 35(22): 7 339-7 352. [8] 端义宏, 方娟, 程正泉, 等. 热带气旋研究和业务预报进展——第九届世界气象组织热带气旋国际研讨会(IWTC-9)综述[J]. 气象学报, 2020, 78(3): 537-550. [9] 陈敏, 王迎春, 仲跻芹, 等. 北京地区中尺度数值业务预报的客观检验[J]. 应用气象学报, 2003, 14(5): 522-532. [10] BRILL K F, MESINGER F. Applying a general analytic method for assessing bias sensitivity to bias-adjusted threat and equitable threat scores[J]. Wea Forecasting, 2009, 24(6): 1 748-1 754. [11] 唐文苑, 周庆亮, 刘鑫华, 等. 国家级强对流天气分类预报检验分析[J]. 气象, 2017, 43(1): 67-76. [12] 俞碧玉, 朱科锋. 多种空间检验方法在不同分辨率模式降水预报评估中的应用[J]. 气象科学, 2022, 42(3): 341-355. [13] 汪瑛, 胡胜, 涂静, 等. 2016—2020年广东省定量降水预报检验评估[J]. 热带气象学报, 2021, 37(2): 154-165. [14] 刘段灵, 陈超. 最优TS评分方法在逐时降水订正中的初步应用及评估[J]. 热带气象学报, 2022, 38(4): 611-620. [15] WEUSTHOFF T, AMENT F, ARPAGAUS M, et al. Assessing the benefits of convection-permitting models by neighborhood verification: Examples from MAP D-PHASE[J]. Mon Wea Rev, 2010, 138(9): 3 418-3 433. [16] BUSCHOW S, FRIEDERICHS P. Using wavelets to verify the scale structure of precipitation forecasts[J]. Adv Stat Climate Meteor Oceanogr, 2020, 6(1): 13-30. [17] DAVIS C, BROWN B, BULLOCK R. Object-based verification of precipitation forecasts. Part Ⅰ: Methodology and application to mesoscale rain areas[J]. Mon Wea Rev, 2006, 134(7): 1 772-1 784. [18] 陈昊明, 李普曦, 赵妍. 千米尺度模式降水的检验评估进展及展望[J]. 气象科技进展, 2021, 11(3): 155-164. [19] YU Z, CHEN Y J, EBERT B, et al. Benchmark rainfall verification of landfall tropical cyclone forecasts by operational ACCESS‐TC over China[J]. Meteorol Appl, 2020, 27(1): e1842. [20] HE B, YU Z, TAN Y, et al. Rainfall forecast errors in different landfall stages of Super Typhoon Lekima[J]. Front Earth Sci, 2019, 16(1): 34-51. [21] 何斌, 喻自凤, 王海平. 2019年影响中国台风的降水预报误差及其来源研究[J]. 气象, 2023, 49(11): 1 299-1 314. [22] 吴俊杰, 段晶晶, 辛欣, 等. 台风"黑格比"造成浙东北滞后型暴雨成因分析及多模式预报检验[J]. 热带气象学报, 2023, 39(6): 857-871. [23] DING C C, REN F, LIU Y, et al. Improvement in the forecasting of heavy rainfall over South China in the DSAEF_LTP model by introducing the intensity of the tropical cyclone[J]. Wea Forecasting, 2020, 35(5): 1 967-1 980. [24] WANG C C, PAUL S, HUANG S Y, et al. Typhoon quantitative precipitation forecastsby the 2.5 km CReSS Model inTaiwan: Examples and role of topography[J]. Atmosphere, 2022, 13: 623. [25] LIU H, HUANG X, FEI J, et al. Characteristics and preliminary causes of extremely persistent heavy rainfall generated by landfalling tropical cyclones over China[J]. Earth Space Sci, 2022, 9(4), e2022EA002238. [26] 张强, 赵煜飞, 范邵华. 中国国家级气象台站小时降水数据集研制[J]. 暴雨灾害, 2016, 35(2): 182-186. [27] 许晨璐, 王建捷, 黄丽萍. 千米尺度分辨率下GRAPES-Meso4.0模式定量降水预报性能评估[J]. 气象学报, 2017, 75(6): 851-876. -

 点击查看大图
计量
- 文章访问数: 64
- HTML全文浏览量: 12
- PDF下载量: 12
- 被引次数: 0
 粤公网安备 4401069904700003号