



Response of Tropical Extreme Convective Activity to Global Warming Based on NICAM
-
摘要: 热带地区是全球对流活动最旺盛的地区,频繁的对流活动能够对全球能量循环、水循环及气候系统产生深远影响。随着全球变暖加剧,极端对流天气的未来演变趋势受到广泛关注。本研究基于一个水平分辨率为14 km的全球大气模式(NICAM)的模拟结果,结合TRMM卫星观测资料对热带地区极端对流系统的气候特征及其对全球变暖的响应进行了研究。结果表明:NICAM模式对热带地区的大气环境与对流活动有很好的模拟能力,其模拟的近地面层温度和湿度与ERA5再分析资料的空间分布相关系数分别达到0.65和0.89,模拟的极端深对流系统在空间和时间上与卫星观测结果的相关系数分别达到0.53和0.77。对比NICAM模拟的历史时期(1979—2008年)与未来时期(2075—2104年)各30年极端对流特征发现,随着全球变暖,热带地区整体比湿呈增加趋势,但陆地上的相对湿度却呈减小趋势,说明热带陆地区域的大气未来将会变得更加干燥。此外,不同类型的极端对流系统整体上均呈增加的趋势,尤其热带海洋上的极端对流增加趋势相比热带陆地更为明显。Abstract: The tropics represent the most dynamically active region for deep convection globally, exerting a profound influence on the Earth's global energy cycle, hydrological cycle, and climate system. With global warming, increasing attention is being focused on how extreme convective weather will change in the future. This study examines the climatology of tropical extreme convective systems and their future projections using simulations from a global atmospheric model (NICAM) with a 14 km horizontal resolution against TRMM satellite observations. The results demonstrate that the NICAM model effectively reproduces the ambient atmospheric environment and convective activity in tropical regions, exhibiting correlation coefficients of 0.65 (near-surface temperature) and 0.89 (specific humidity) against ERA-5 reanalysis, respectively. The spatial and temporal correlations for extreme deep convective systems reach 0.53 and 0.77 with satellite observations, respectively. A comparison of 30-year historical (1979-2008) and future (2075-2104) extreme convection simulations reveals that while tropospheric specific humidity increases substantially under warming, but relative humidity over tropical land declines significantly, suggesting a robust trend toward drier tropical continental atmosphere in the future. Consequently, the frequency three distinct categories of extreme convective systems is projected to increase overall, with a markedly stronger enhancement over tropical oceans than over tropical landmasses.
-
Key words:
- tropics /
- extreme convective systems /
- NICAM /
- TRMM satellite /
- global warming
-

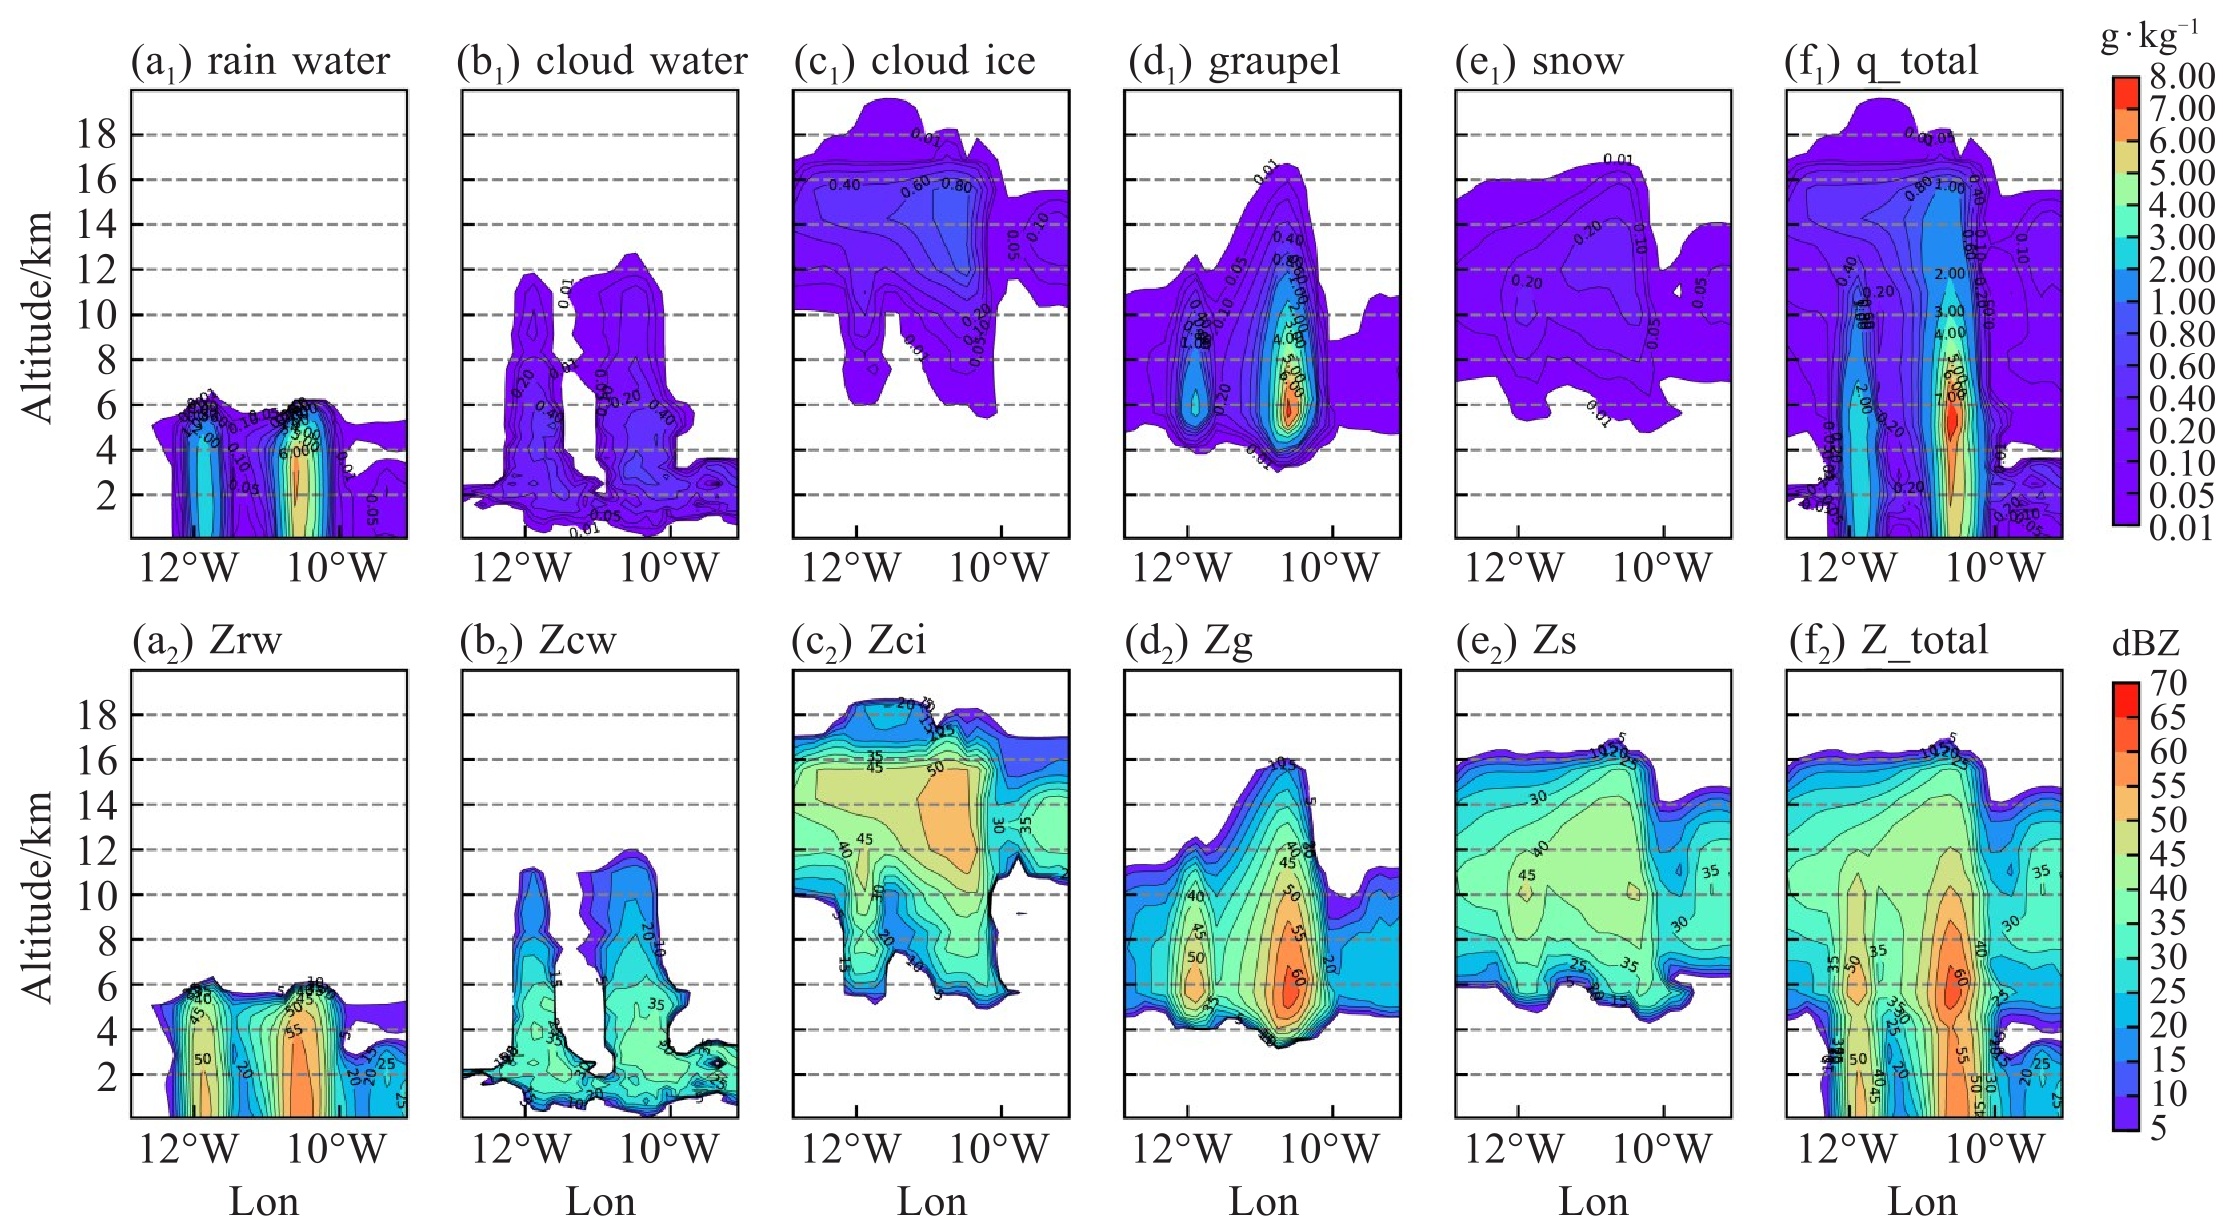
图 1 NICAM模拟的1998年2月25日对流个例的水成物粒子含量(a1~f1)和对应的雷达回波(a2~f2)垂直分布
a.雨水;b.云水;c. 云冰;d. 冰雹;e. 雪;f.总水成物粒子。

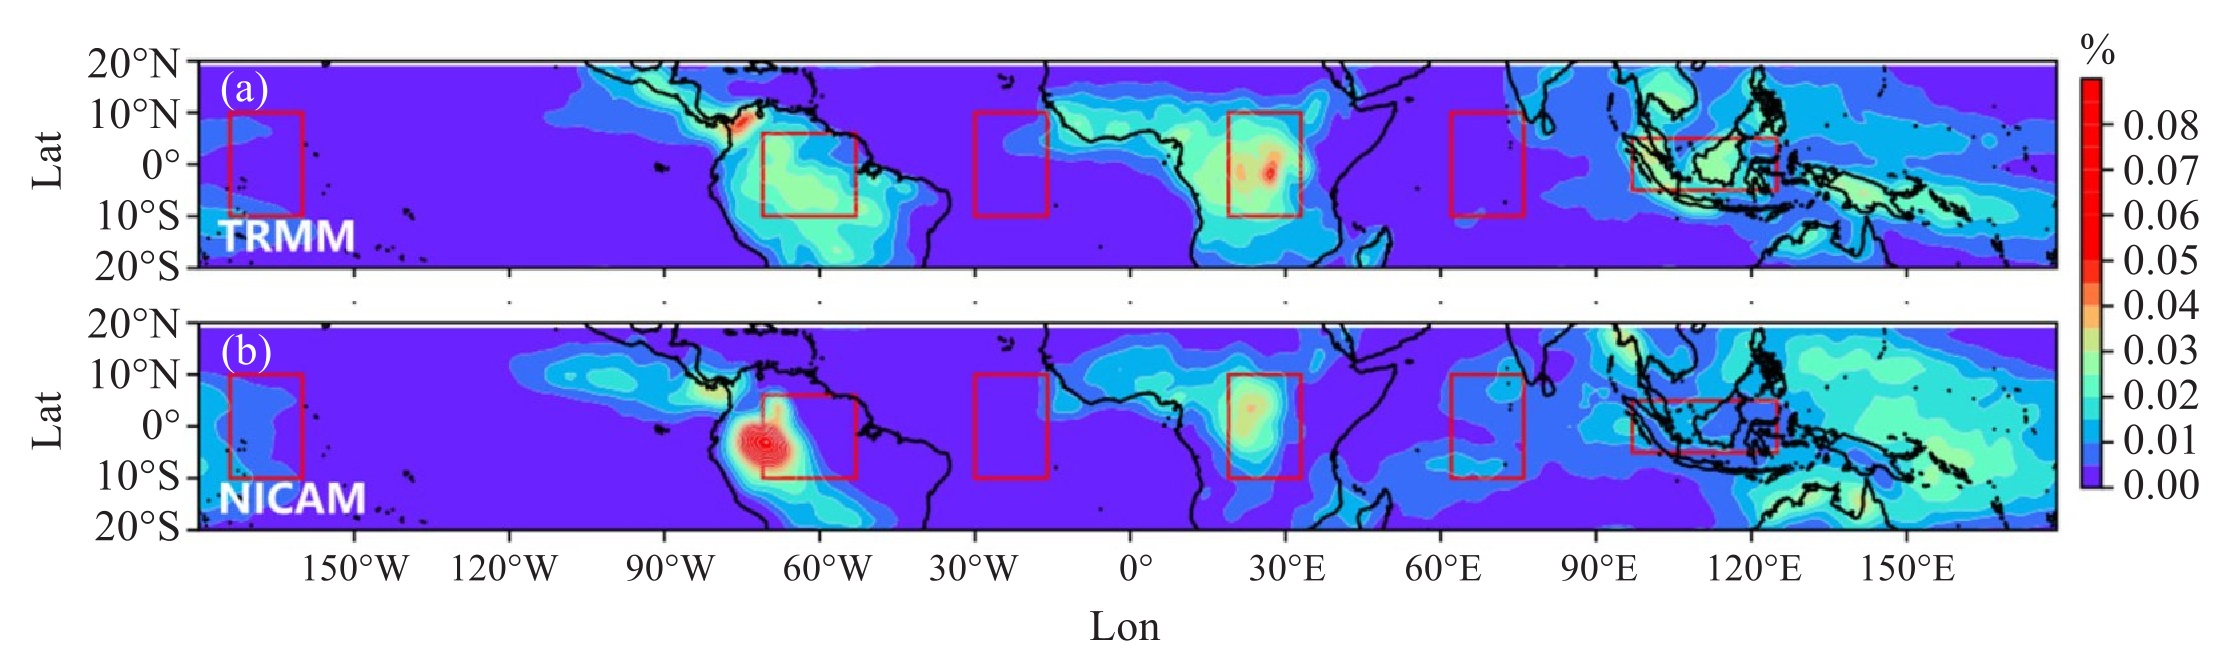
图 2 热带地区NICAM模拟(a)和TRMM观测(b)的极端深对流频率空间分布对比
研究范围内六个子区域从西到东分别为太平洋中部、热带南美洲、大西洋中部、热带非洲、印度洋中部以及海洋性大陆。

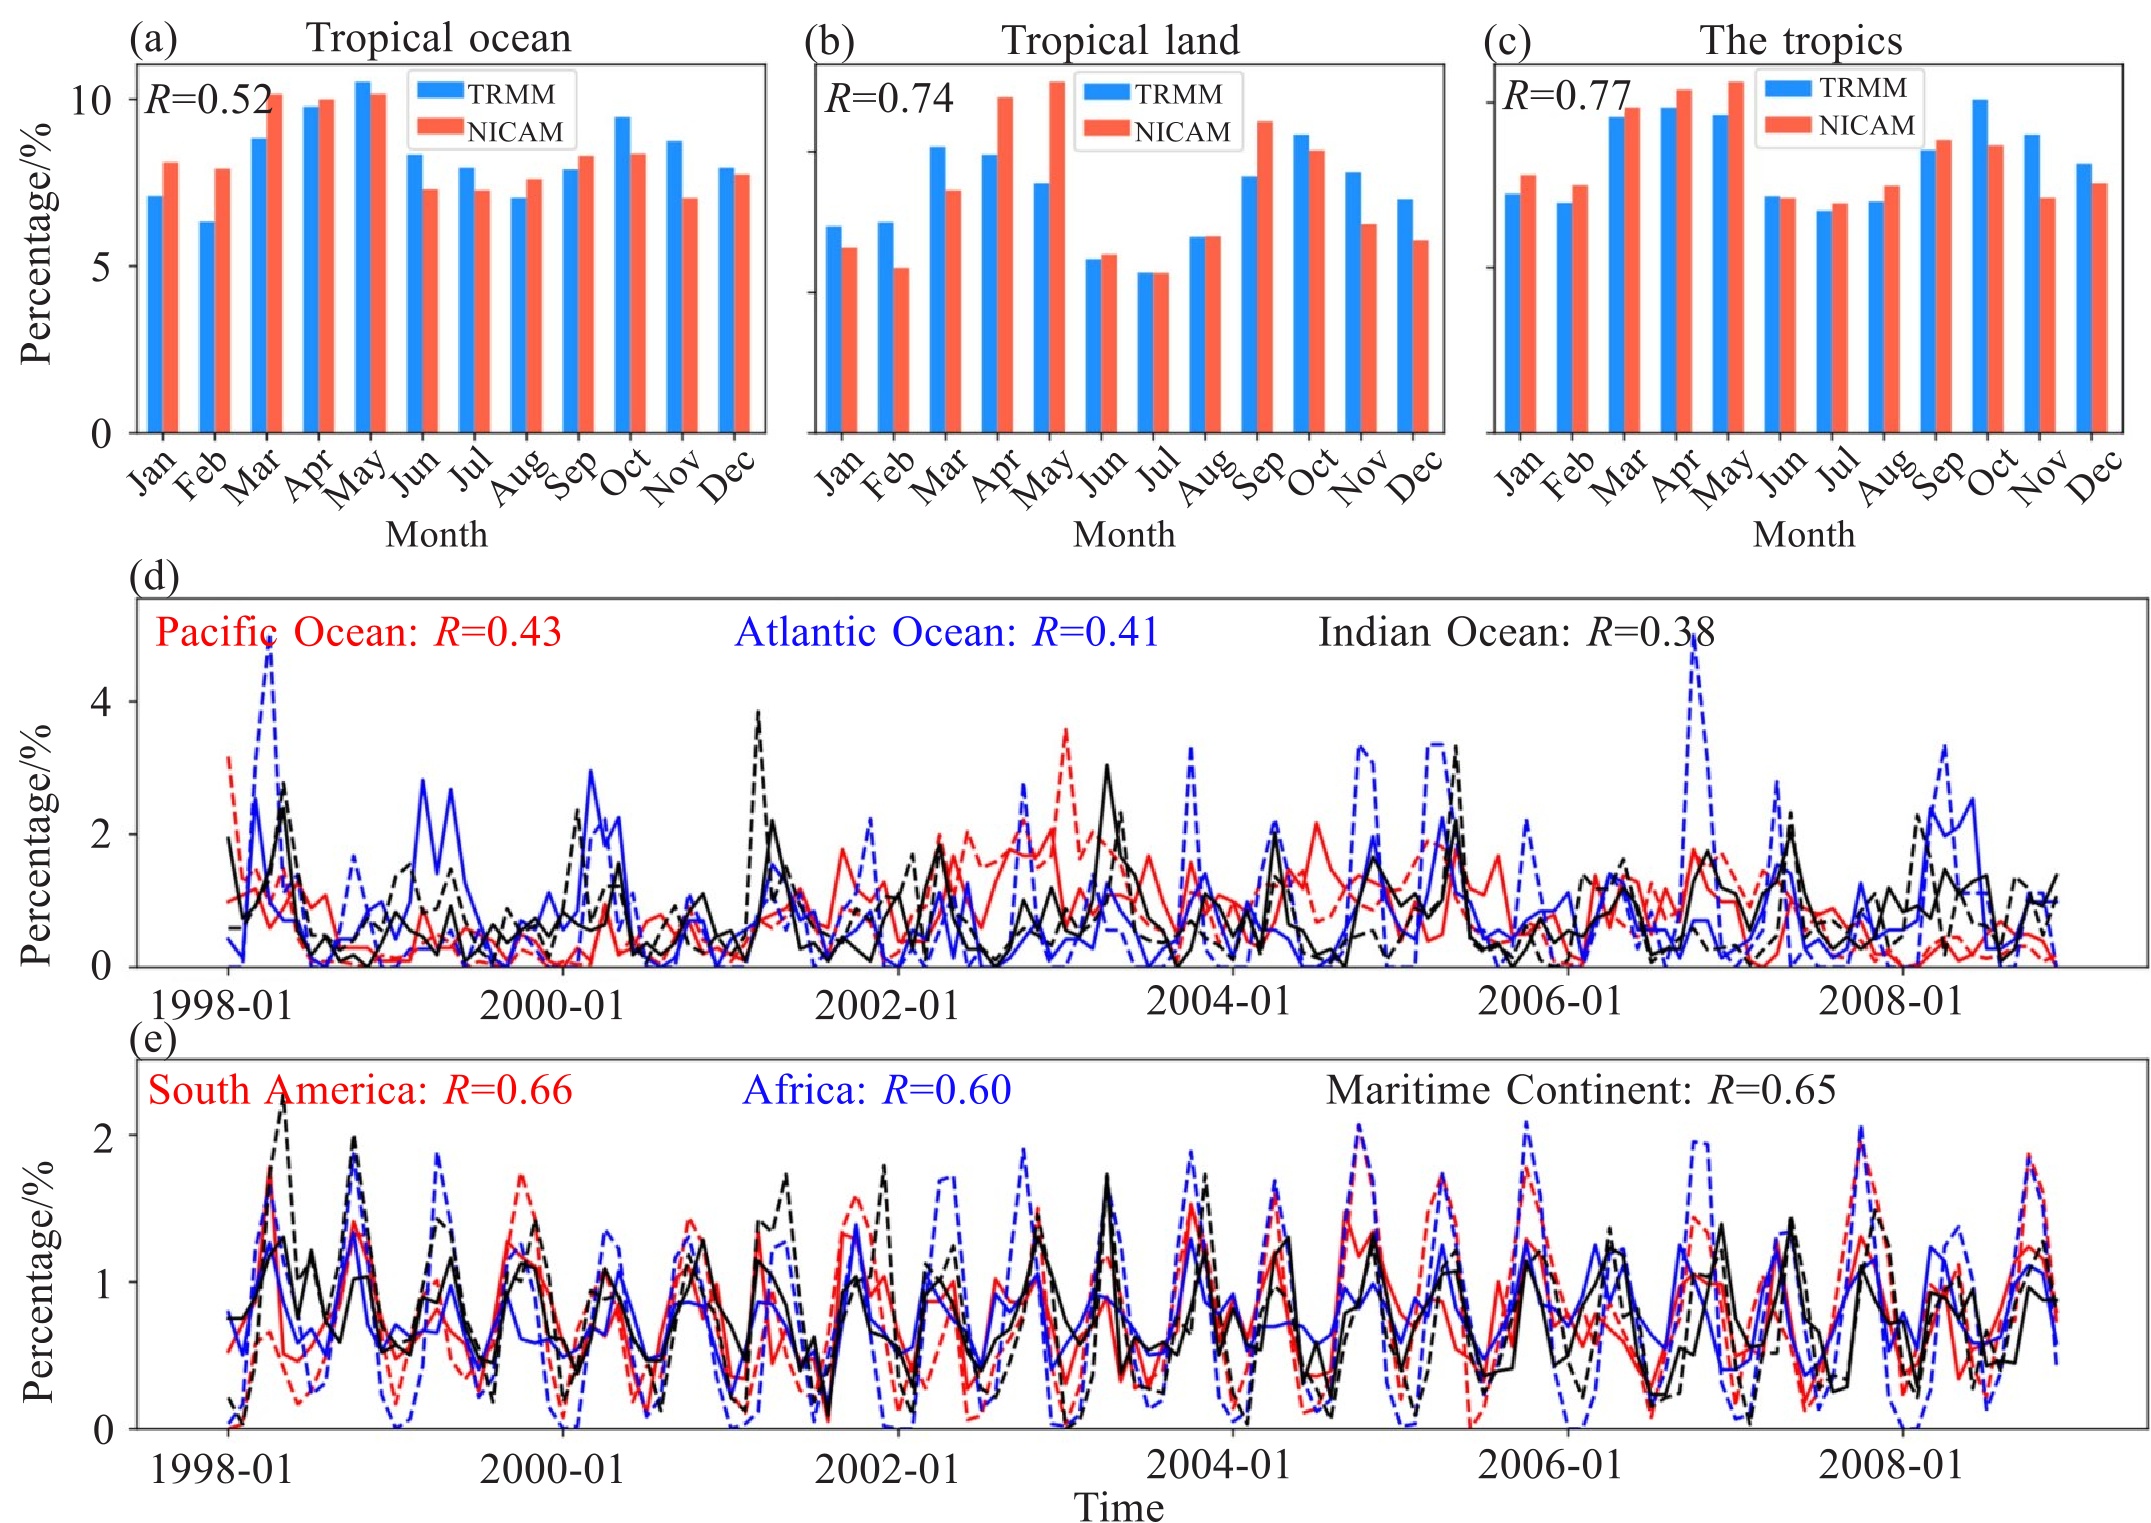
图 3 极端深对流频率的季节和区域时间变化
a~c.热带海洋、热带陆地和热带地区极端深对流频率TRMM观测数据(蓝色)和NICAM模拟结果(红色)的季节分布。d~e.六个热带子区域极端深对流频率的逐月时间分布,实线为观测数据,虚线为模拟结果(1998—2008年)。

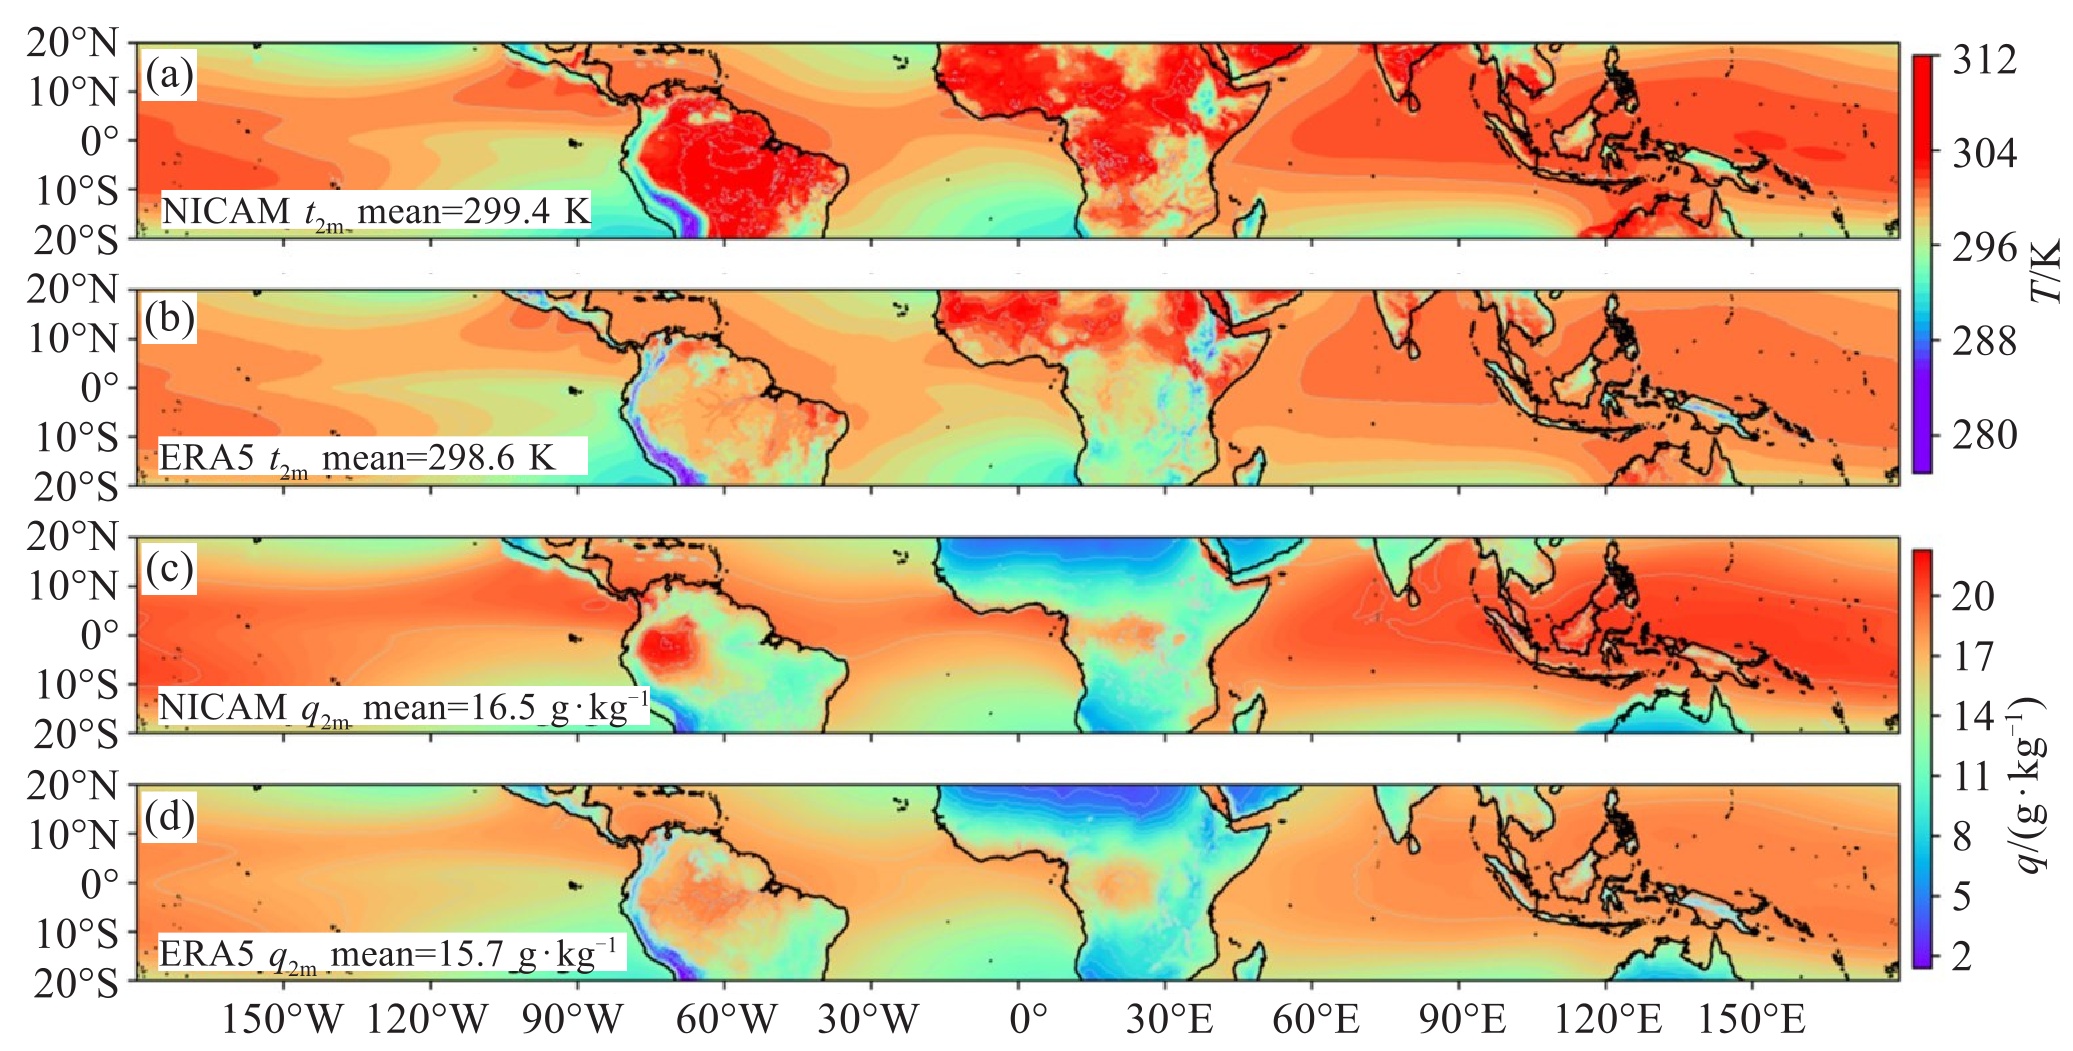
图 4 1979—2008年热带地区NICAM和ERA-5再现的温度场(t2m,单位:K)和湿度场(q2m,单位:g·kg-1)空间分布
a和c为NICAM模拟的温度场和比湿场;b和d为ERA-5数据的温度场和比湿场分布。

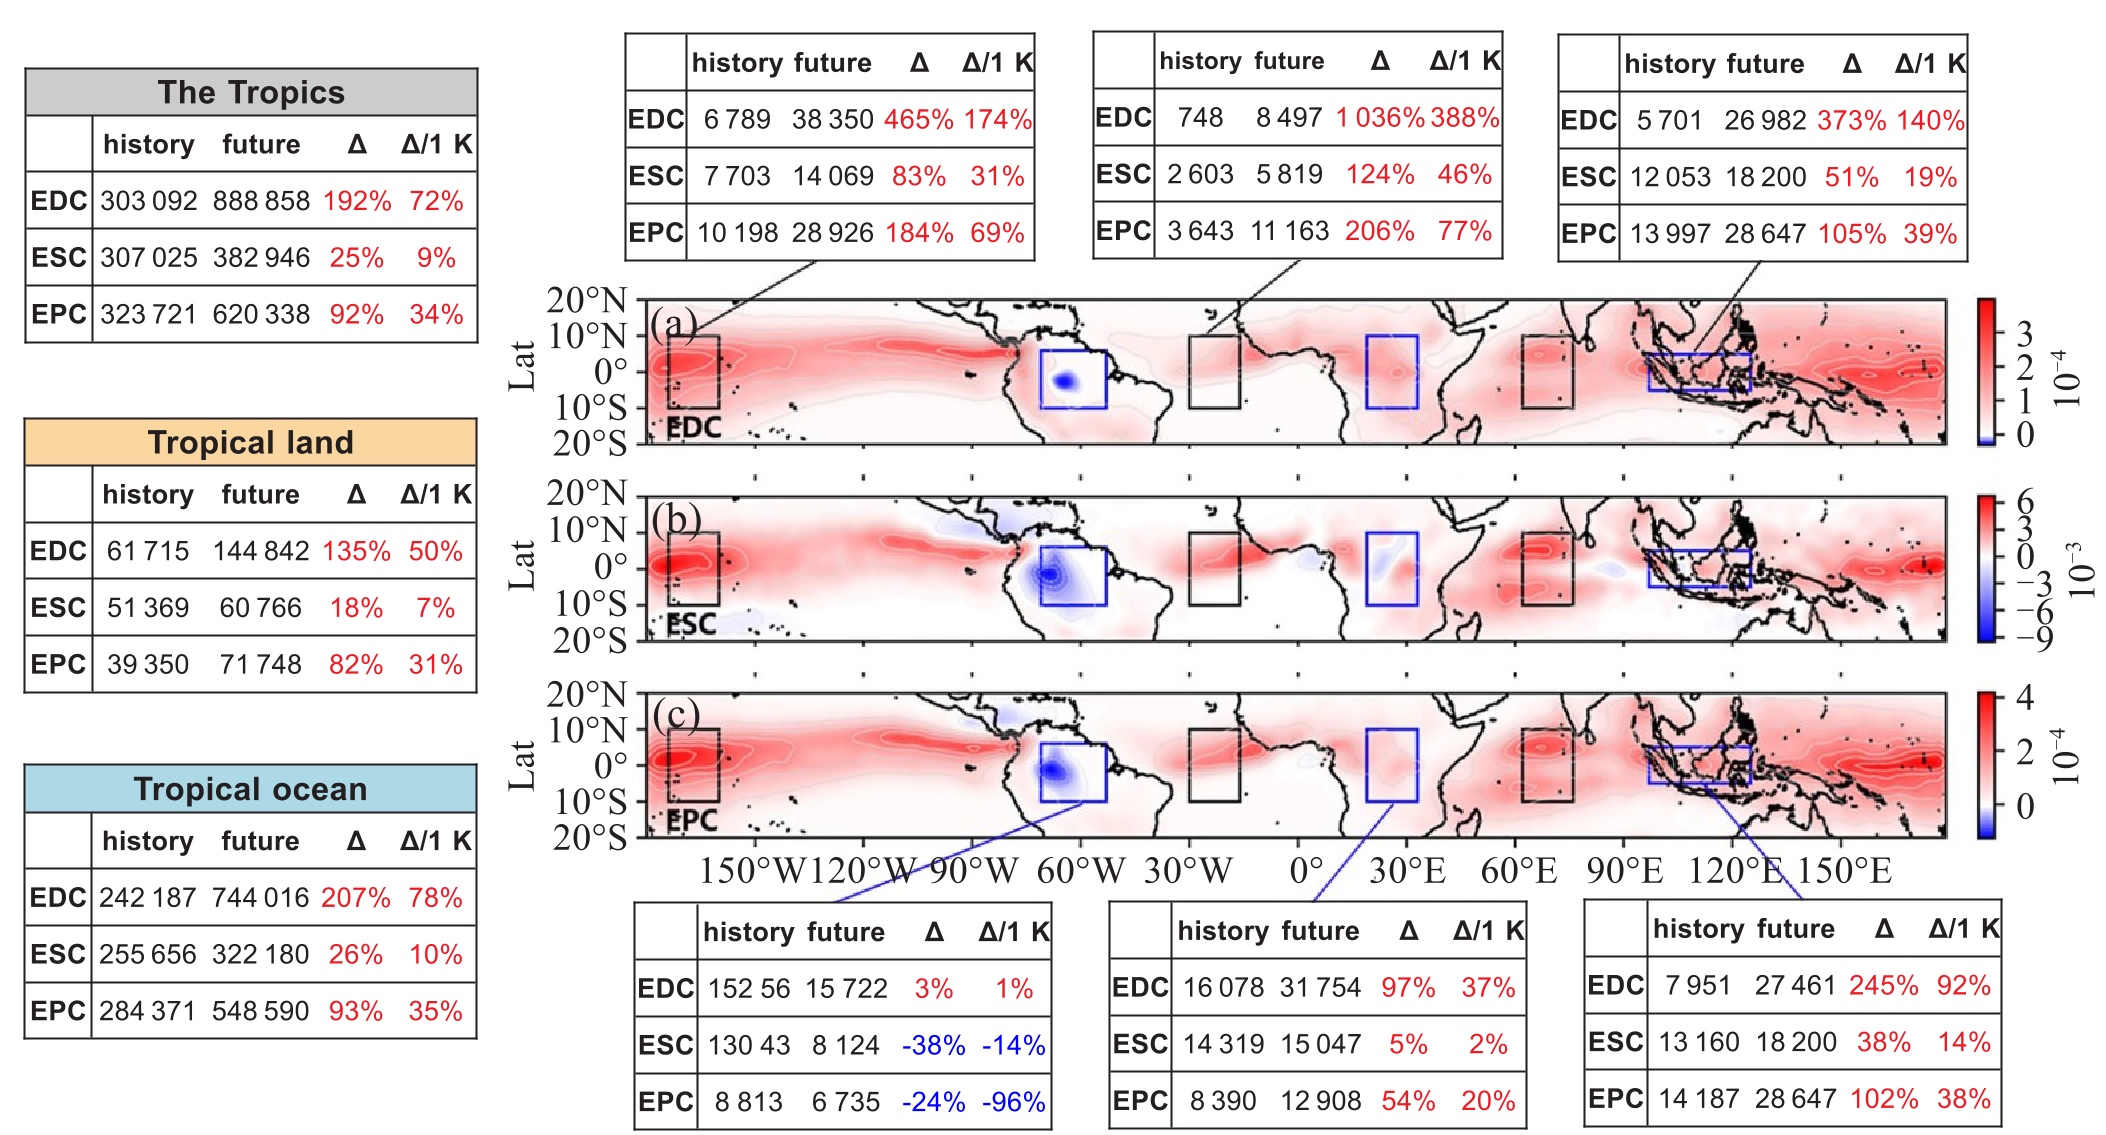
图 6 未来时期相比历史时期热带极端对流分布变化趋势空间分布
填色图为极端深对流(a)、极端强对流(b)以及极端降水对流(c)的空间分布变化,红色表示极端对流发生频率增加,蓝色表示极端对流发生频率减少;表格为热带地区、热带陆地和热带海洋以及六个子区域的三种极端对流的频数统计及其变化。表格中第一和第二列分别表示历史时期和未来时期,第三列为对流频数相对变化率,第四列表示全球温度平均每升高1 K对流频数的相对变化率。

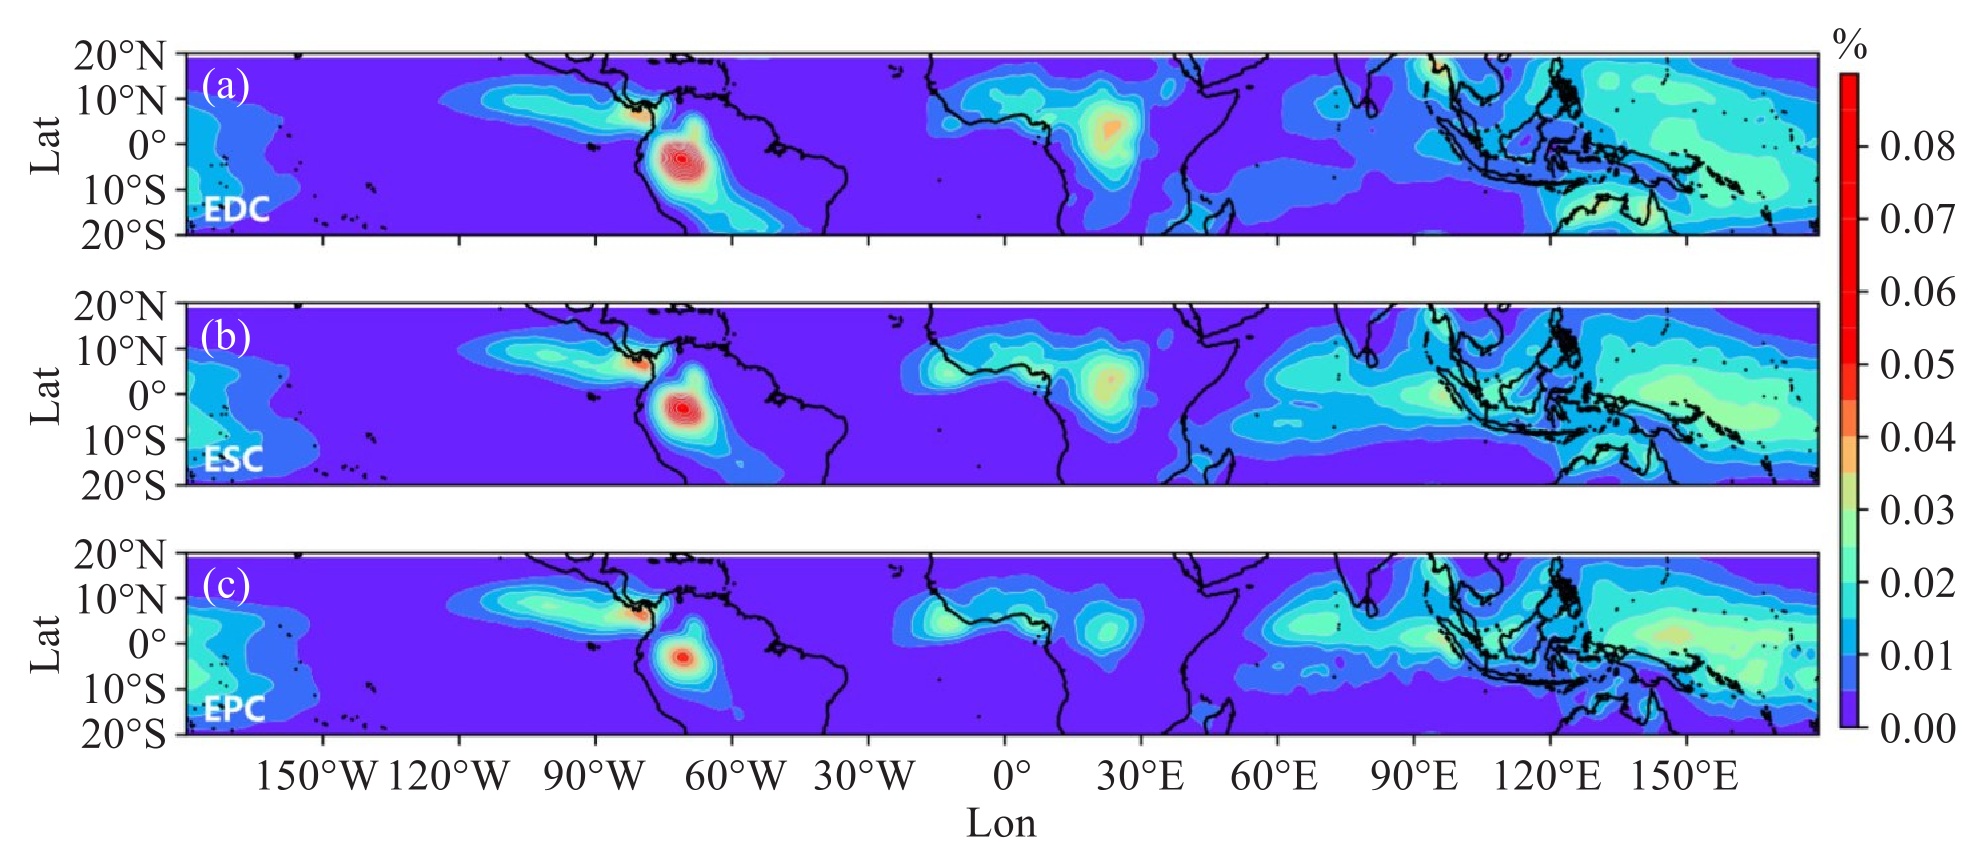
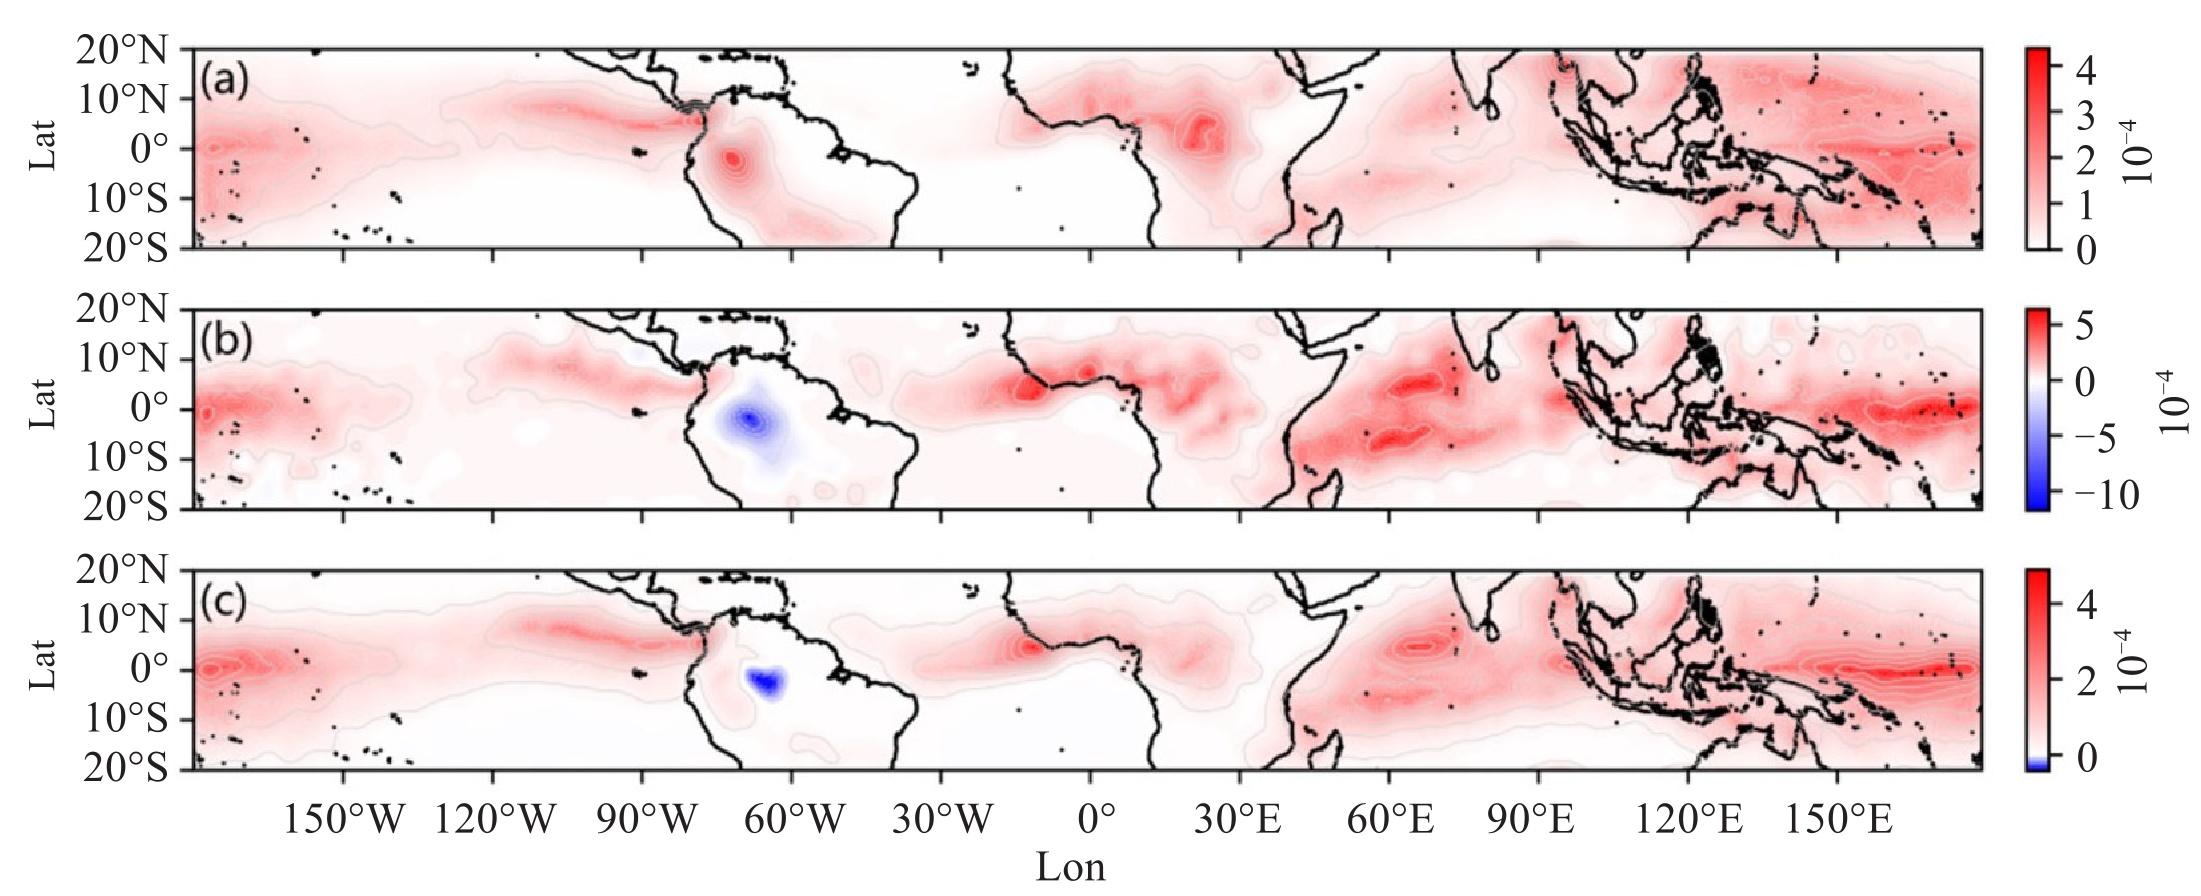
图 7 未来时期相比历史时期前0.5%的热带极端对流频率变化趋势空间分布
a.前0.5%的深对流;b.前0.5%的强对流;c.前0.5%的降水对流。填色部分红色表示发生频率增加,蓝色部分表示发生频率减少。
表 1 极端深对流(EDC)、极端强对流(ESC)和极端降水对流(EPC)对应特征参量阈值
极端对流类型 对流特征参量范围 极端深对流 maxht20 ≥ 14.3 km 极端强对流 maxZ ≥ 67.6 dBZ 极端降水对流 max_sfc_rain_rate ≥ 133.1 mm·h-1  下载: 导出CSV
表 2 热带地区NICAM和ERA-5近地面环境场(t2m和q2m)空间分布的相关系数(1979—2008年)
研究区域 t2m q2m 研究区域 t2m q2m 热带海洋 0.71 0.85 热带陆地 0.55 0.88 太平洋 0.96 0.69 热带南美洲 0.60 0.36 大西洋 0.85 0.94 热带非洲 0.79 0.79 印度洋 0.92 0.68 海洋性大陆 0.80 0.56 注:所有相关系数均已通过99%的显著性检验。
下载: 导出CSV
表 3 未来时期相比历史时期对流特征量的变化
对流特征参量 百分位数 历史时期 未来时期 maxht20 前4.4% 14.3 km 15.8 km 前0.5% 15.6 km 17.3 km maxZ 前4.4% 67.6 dBZ 68.2 dBZ 前0.5% 70.6 dBZ 71.2 dBZ max_sfc_rain_rate 前4.4% 133.1 mm·h-1 155.2 mm·h-1 前0.5% 179.4 mm·h-1 207.7 mm·h-1
下载: 导出CSV
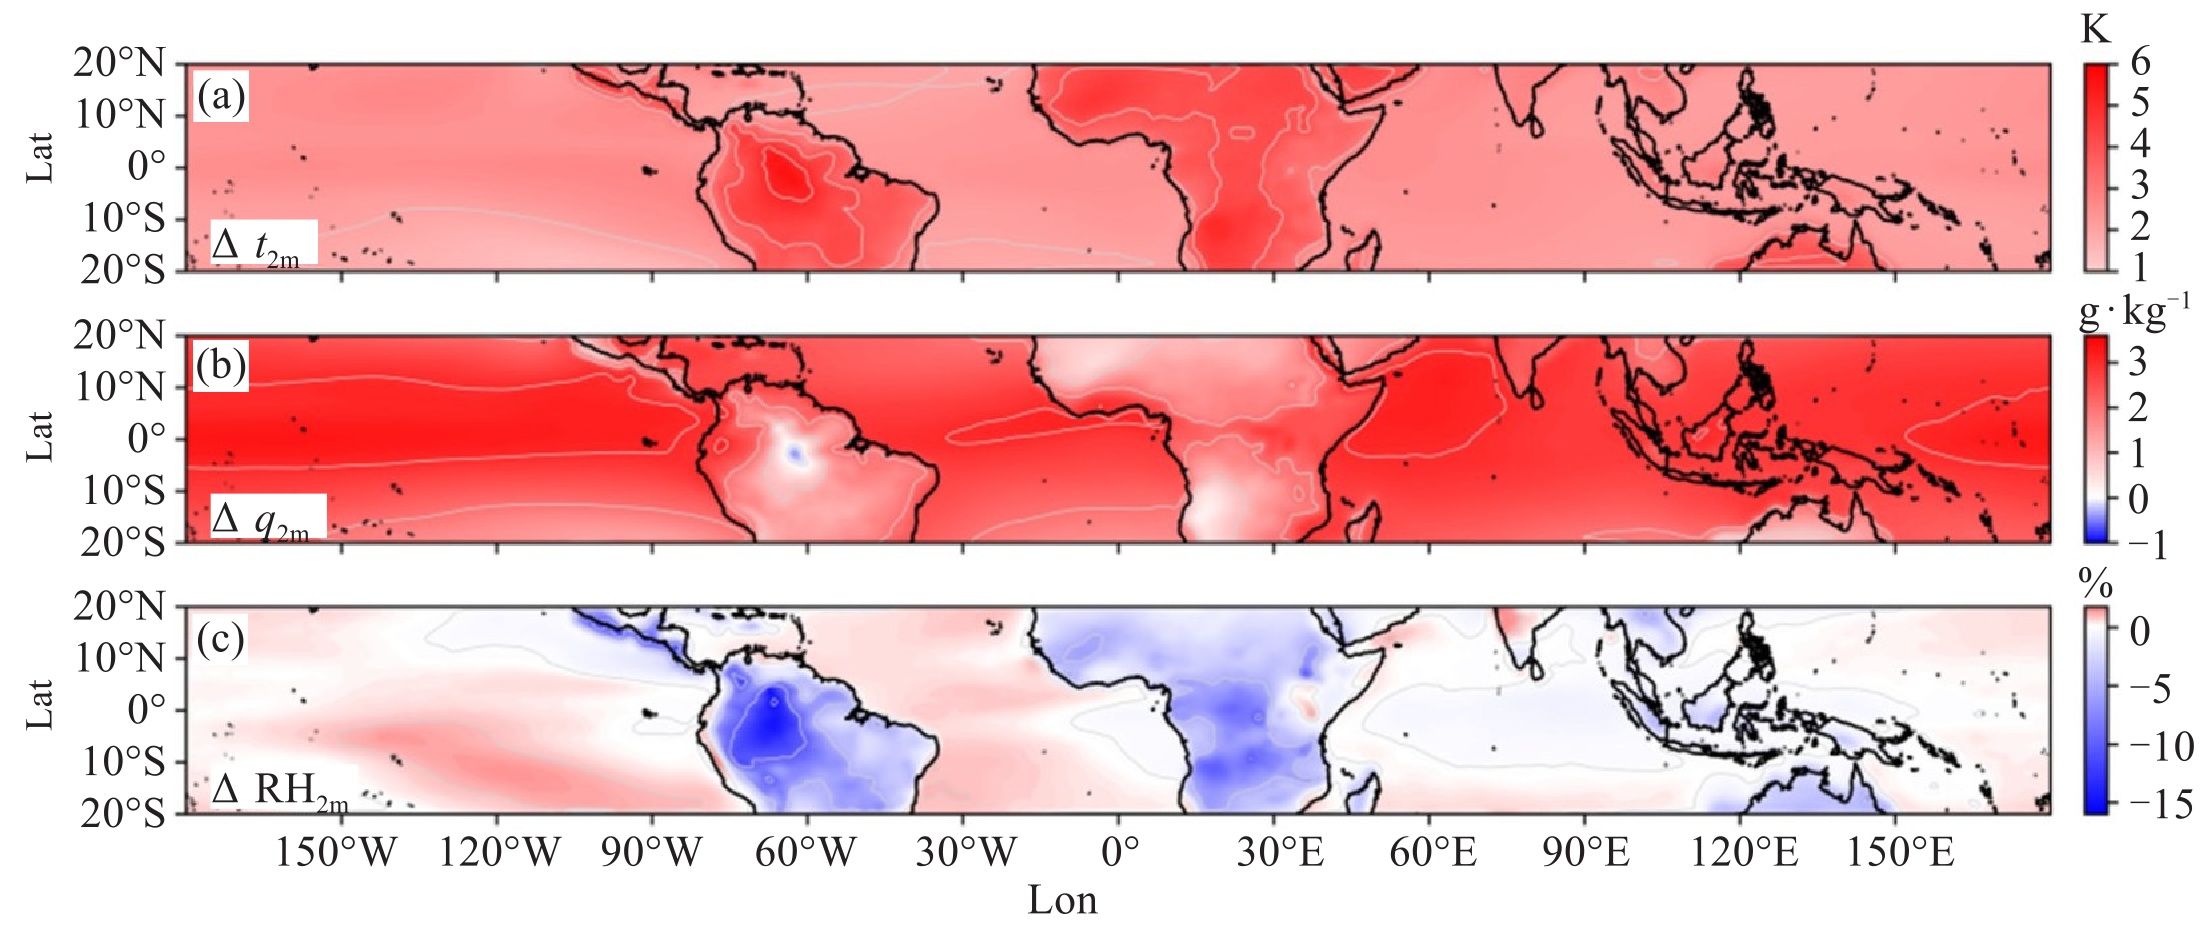
表 4 未来时期相比历史时期热带地区、热带海洋以及热带陆地的2 m处环境场(t2m、q2m和RH2m)的变化
热带地区 热带海洋 热带陆地 历史 未来 未来-历史 历史 未来 未来-历史 历史 未来 未来-历史 t2m/K 299.4 302.0 2.6 298.9 301.2 2.3 300.7 304.3 3.7 q2m/(g·kg-1) 16.5 18.9 2.4 17.7 20.3 2.6 12.7 14.5 1.8 RH2m/% 77.3 76.5 -0.8 83.8 84 0.2 56.2 52.4 -3.8
下载: 导出CSV
-
[1] Fu Q, Hu Y X, Yang Q. Identifying the top of the tropical tropopause layer from vertical mass flux analysis and CALIPSO lidar cloud observations[J]. Geophysical Research Letters, 2007, 34(14): L14813 [2] Bergman J W, Jensen E J, Pfister L, et al. Seasonal differences of vertical-transport efficiency in the tropical tropopause layer: On the interplay between tropical deep convection, large-scale vertical ascent, and horizontal circulations[J]. Journal of Geophysical Research: Atmospheres, 2012, 117(D5): 2011JD016992. [3] Wu X K, Fu Q, Kodama C. Response of tropical overshooting deep convection to global warming based on global cloud-resolving model simulations[J]. Geophysical Research Letters, 2023, 50(14): e2023GL104210. [4] Fischer E M, Sippel S, Knutti R. Increasing probability of record-shattering climate extremes[J]. Nature Climate Change, 2021, 11(8): 689-695. [5] Lau W K M, Kim K M, Chern J D, et al. Structural changes and variability of the ITCZ induced by radiation-cloud-convection-circulation interactions: inferences from the Goddard Multi-scale Modeling Framework (GMMF) experiments[J]. Climate Dynamics, 2020, 54(1): 211-229. [6] Liu C T, Zipser E J. The global distribution of largest, deepest, and most intense precipitation systems[J]. Geophysical Research Letters, 2015, 42(9): 3591-3595. [7] Zipser E J, Cecil D J, Liu C T, et al. Where are the most intense thunderstorms on earth? [J]. Bulletin of the American Meteorological Society, 2006, 87(8): 1057-1072. [8] Zipser E J. Deep cumulonimbus cloud systems in the tropics with and without lightning[J]. Monthly Weather Review, 1994, 122(8): 1837-1851. [9] Fu Y X, Wu Q Y. Recent trends in convective and stratiform rain rate under tropical cyclones and non-tropical cyclones conditions using satellite remote sensing data[C]//International Conference on Remote Sensing, Mapping, and Image Processing (RSMIP 2024). Xiamen, China. 2024: 19. [10] Wehner M, Lee J, Risser M, et al. Evaluation of extreme sub-daily precipitation in high-resolution global climate model simulations[J]. Philosophical Transactions of the Royal Society A: Mathematical, Physical and Engineering Sciences, 2021, 379(2195): 20190545. [LinkOut] [11] Glazer R H, Torres-Alavez J A, Coppola E, et al. Projected changes to severe thunderstorm environments as a result of twenty-first century warming from RegCM CORDEX-CORE simulations[J]. Climate Dynamics, 2021, 57(5): 1595-1613. [12] Charn A B, Parishani H. Predictive proxies of present and future lightning in a superparameterized model[J]. Journal of Geophysical Research: Atmospheres, 2021, 126(17): e2021JD035461. [13] Ban N, Schmidli J, Schär C. Evaluation of the convection-resolving regional climate modeling approach in decade-long simulations[J]. Journal of Geophysical Research: Atmospheres, 2014, 119(13): 7889-7907. [14] Xie S P, Deser C, Vecchi G A, et al. Towards predictive understanding of regional climate change[J]. Nature Climate Change, 2015, 5(10): 921-930. [15] Yang B, Qian Y, Lin G, et al. Uncertainty quantification and parameter tuning in the CAM5 Zhang-McFarlane convection scheme and impact of improved convection on the global circulation and climate[J]. Journal of Geophysical Research: Atmospheres, 2013, 118(2): 395-415. [16] Satoh M, Matsuno T, Tomita H, et al. Nonhydrostatic icosahedral atmospheric model (NICAM) for global cloud resolving simulations[J]. Journal of Computational Physics, 2008, 227(7): 3486-3514. [17] Miura H, Satoh M, Nasuno T, et al. A madden-Julian oscillation event realistically simulated by a global cloud-resolving model[J]. Science, 2007, 318(5857): 1763-1765. [18] Na Y, Fu Q, Kodama C. Precipitation probability and its future changes from a global cloud-resolving model and CMIP6 simulations[J]. Journal of Geophysical Research: Atmospheres, 2020, 125(5): e2019JD031926. [19] Yamada Y, Oouchi K, Satoh M, et al. Projection of changes in tropical cyclone activity and cloud height due to greenhouse warming: global cloud-system-resolving approach[J]. Geophysical Research Letters, 2010, 37(7): L07709. [20] Kajikawa Y, Miyamoto Y, Yoshida R, et al. Resolution dependence of deep convections in a global simulation from over 10-kilometer to sub-kilometer grid spacing[J]. Progress in Earth and Planetary Science, 2016, 3(1): 16. [21] Liu C T, Zipser E J, Cecil D J, et al. A cloud and precipitation feature database from nine years of TRMM observations[J]. Journal of Applied Meteorology and Climatology, 2008, 47(10): 2712-2728. [22] Nesbitt S W, Zipser E J, Cecil D J. A census of precipitation features in the tropics using TRMM: Radar, ice scattering, and lightning observations[J]. Journal of Climate, 2000, 13(23): 4087-4106. [23] Wu X K, Qie X S, Yuan T, et al. Meteorological regimes of the most intense convective systems along the southern Himalayan front[J]. Journal of Climate, 2016, 29(12): 4383-4398. [24] Dauhut T, Chaboureau J P, Escobar J, et al. Large-eddy simulations of Hector the convector making the stratosphere wetter[J]. Atmospheric Science Letters, 2015, 16(2): 135-140. [25] TONG M, XUE M. Simultaneous retrieval of microphysical parameters and atmospheric state variables with radar data and ensemble Kalman filter method[C]. School of Meteorology and Center for Analysis and Prediction of Storms, University of Oklahoma, Norman, Oklahoma, 73019. [26] Fueglistaler S, Dessler A E, Dunkerton T J, et al. Tropical tropopause layer[J]. Reviews of Geophysics, 2009, 47: 2008RG000267. [27] Byrne M P, O' Gorman P A. Trends in continental temperature and humidity directly linked to ocean warming[J]. Proceedings of the National Academy of Sciences of the United States of America, 2018, 115(19): 4863-4868. [28] Pietschnig M, Lambert F H, Saint-Lu M, et al. The presence of Africa and limited soil moisture contribute to future drying of south America [J]. Geophysical Research Letters, 2019, 46(21): 12445-12453. [29] Emori S, Brown S J. Dynamic and thermodynamic changes in mean and extreme precipitation under changed climate[J]. Geophysical Research Letters, 2005, 32(17): 1-5. -

 点击查看大图
计量
- 文章访问数: 422
- HTML全文浏览量: 10
- PDF下载量: 166
- 被引次数: 0
 粤公网安备 4401069904700003号