



Real-time Typhoon Intensity Forecasting Based on TimeSformer
-
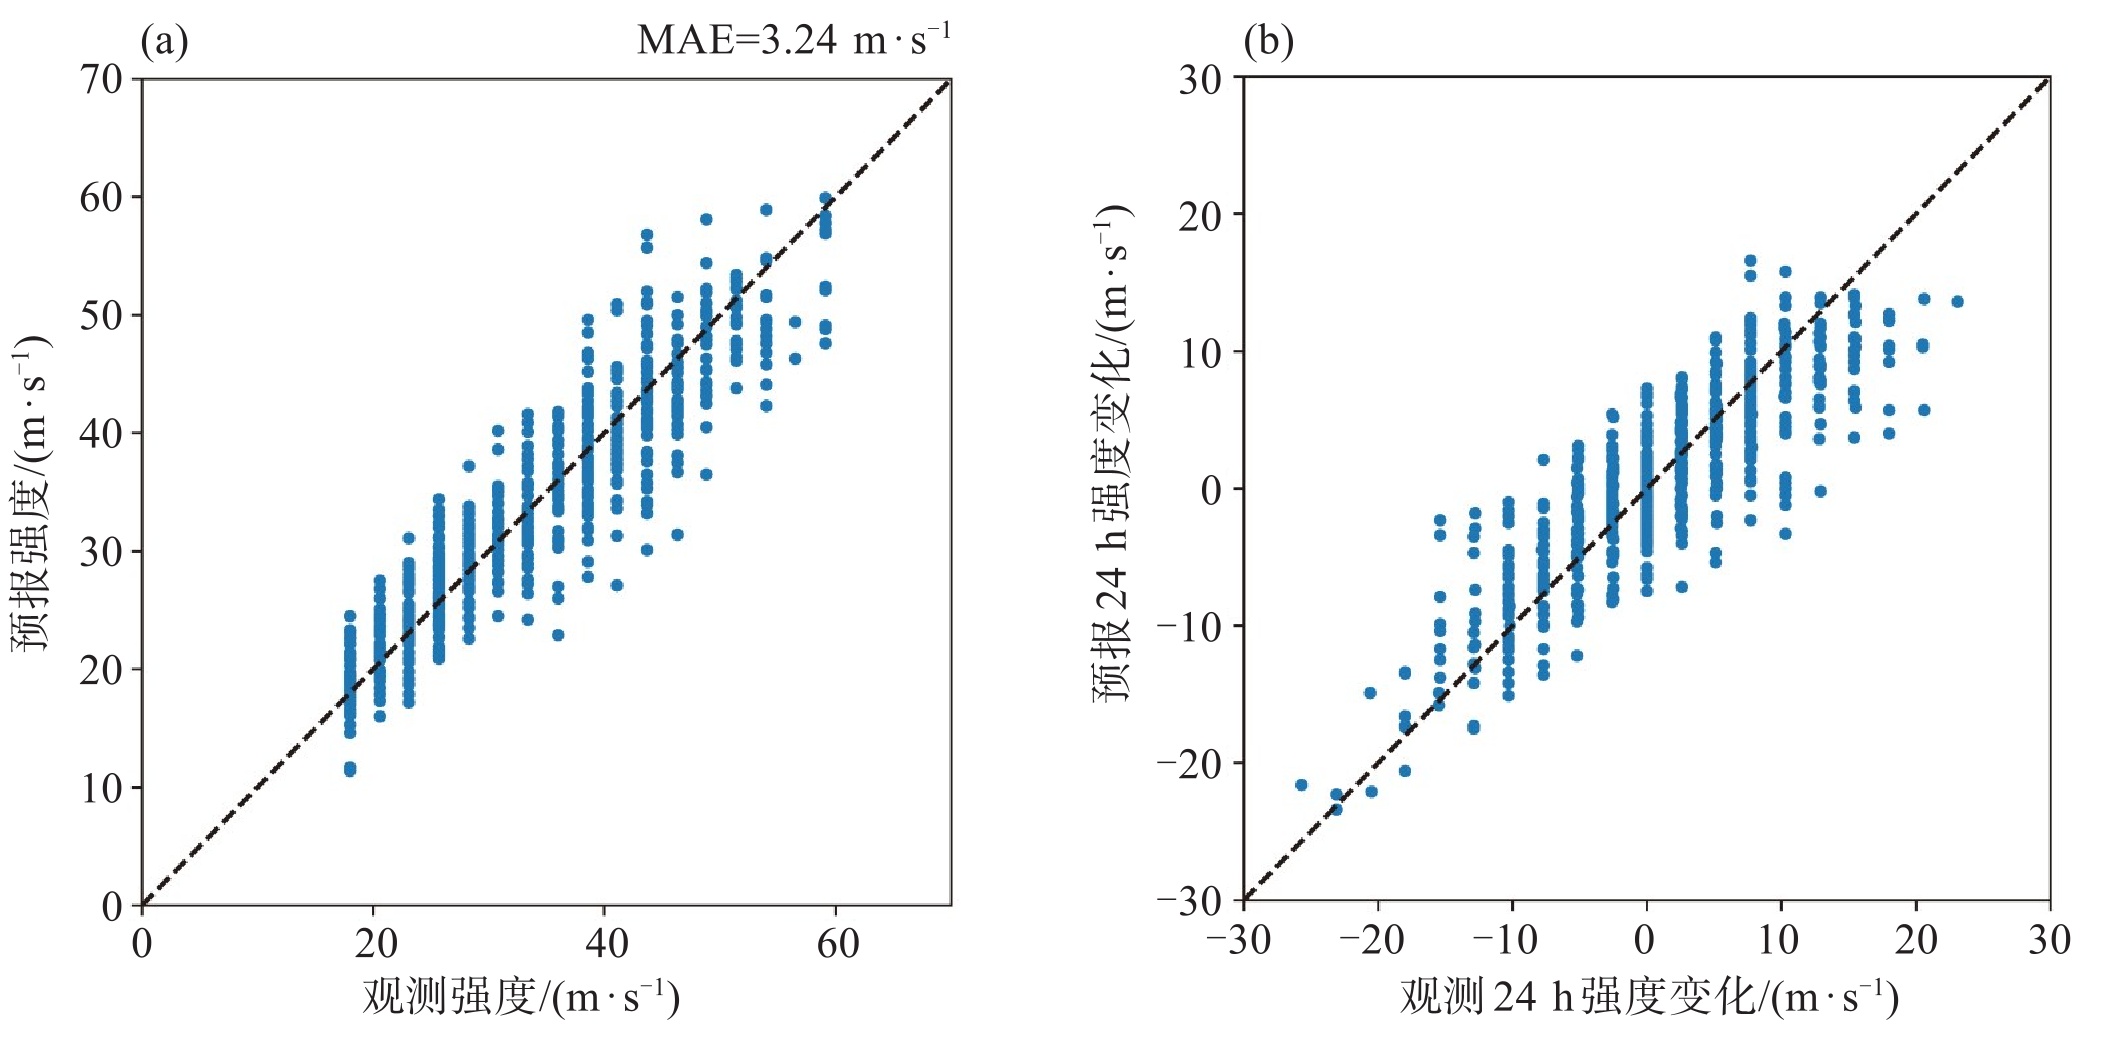
摘要: 本研究以能够有效提取时空特征的TimeSformer模型作为基础架构,使用1990—2021年的ERA5数据训练了台风24 h强度预报模型,并使用ECMWF预报数据实现了实时预报。为提升模型性能,我们在模型输入数据中加入了移动路径表征层,使得测试集均方差相比控制试验降低了1.84 m2·s-2;此外,通过高空要素等压面的敏感性试验,我们发现在仅使用200 hPa、500 hPa、700 hPa、850 hPa、950 hPa等压面时,测试集均方差最小,2022—2023年ERA5测试集623个样本预报的平均绝对误差(Mean Absolute Error,MAE)为3.24 m·s-1。在基于ECMWF预报数据的实时预报中,模型对2022—2023年共260个测试样本的MAE为3.56 m·s-1,较直接使用ERA5数据略有升高(同样本检验MAE增加了0.36 m·s-1,下同),但仍显著低于两大主流模式NCEP和ECMWF(MAE分别为4.52 m·s-1和8.11 m·s-1)。模型方便易用,可为台风强度的实时预报提供参考。
-
关键词:
- 台风强度预报 /
- 实时预报 /
- 深度学习 /
- TimeSformer
Abstract: This study proposes a real-time 24-hour typhoon intensity forecasting model based on the TimeSformer architecture, which is capable of effectively extracting spatiotemporal features from meteorological fields. The model was trained on ERA5 reanalysis data (1990-2021) and validated using both ERS5 test data and real-time ECMWF forecast data. To enhance model performance, a track representation layer was incorporated into the input data, which reduced the Mean Square Error (MSE) on the test set by 1.84 m2·s-2 compared to the control experiment. Additionally, sensitivity experiments on upper-level isobaric elements reveals that optimal performance was achieved using only the five pressure levels (200 hPa, 500 hPa, 700 hPa, 850 hPa, and 950 hPa), with a mean absolute error (MAE) of 3.24 m·s-1 on 623 ERA5 test samples from 2022-2023. When applied to real-time ECMWF forecast data (260 test samples during 2022-2023), the model achieved an MAE of 3.56 m·s-1, a slight increase compared to direct ERA5-based validation (with an MAE increase of 0.32 m·s-1), but still substantially lower than those errors from the two mainstream operational NCEP (4.52 m·s-1) and ECMWF (8.11 m·s-1) models, respectively. These results demonstrate that the proposed model offers a robust and reliable tool for operational typhoon intensity forecasting.-
Key words:
- typhoon intensity forecasting /
- real-time forecasting /
- deep learning /
- TimeSformer
-

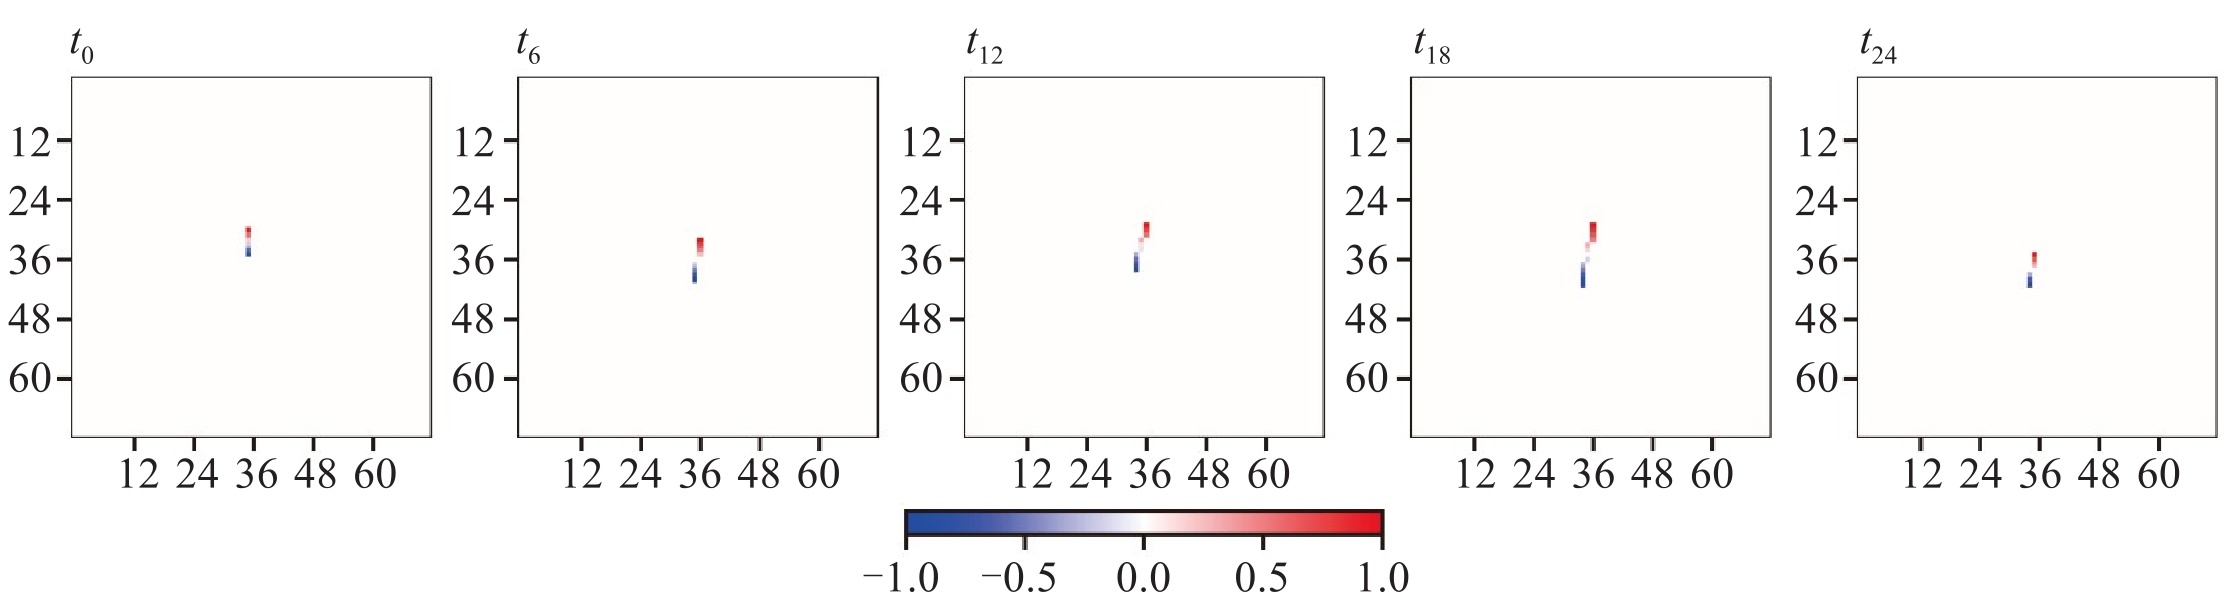
图 3 2114号台风“灿都”9月12日00时(世界时)—13日00时逐6 h间隔的台风移动路径表征层
填色表示归一化台风路径位置编码值,蓝色至红色分别表示从路径起点(−1)向终点(1)的移动方向,该编码为无量纲量。

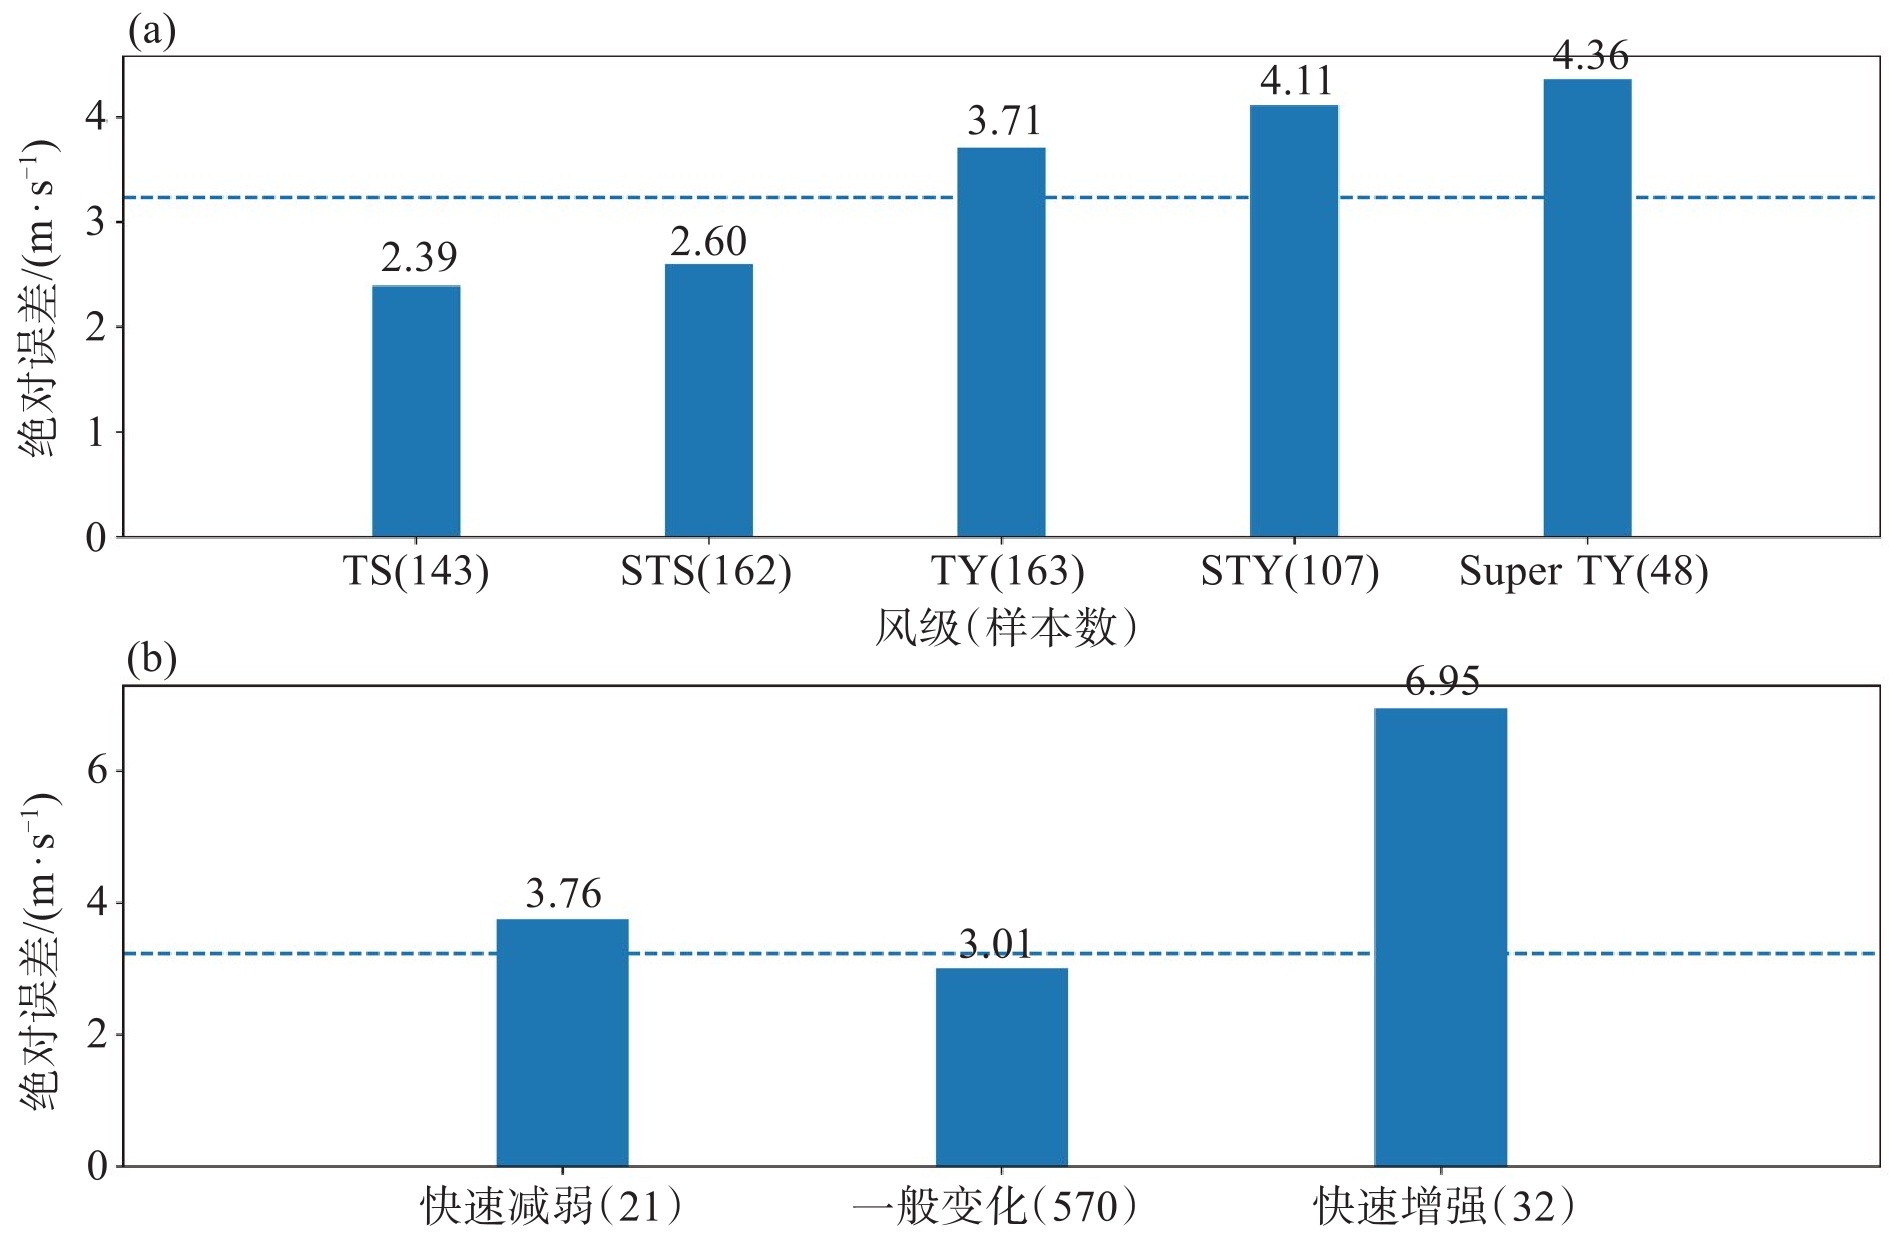
图 5 使用ERA5测试集数据的预报对于不同台风等级(a)以及不同24 h台风强度变化(b)的平均绝对误差
TS代表热带风暴级,STS代表强热带风暴级,TY代表台风级,STY代表强台风级,Super TY代表超强台风级,横轴括号内为样本数。

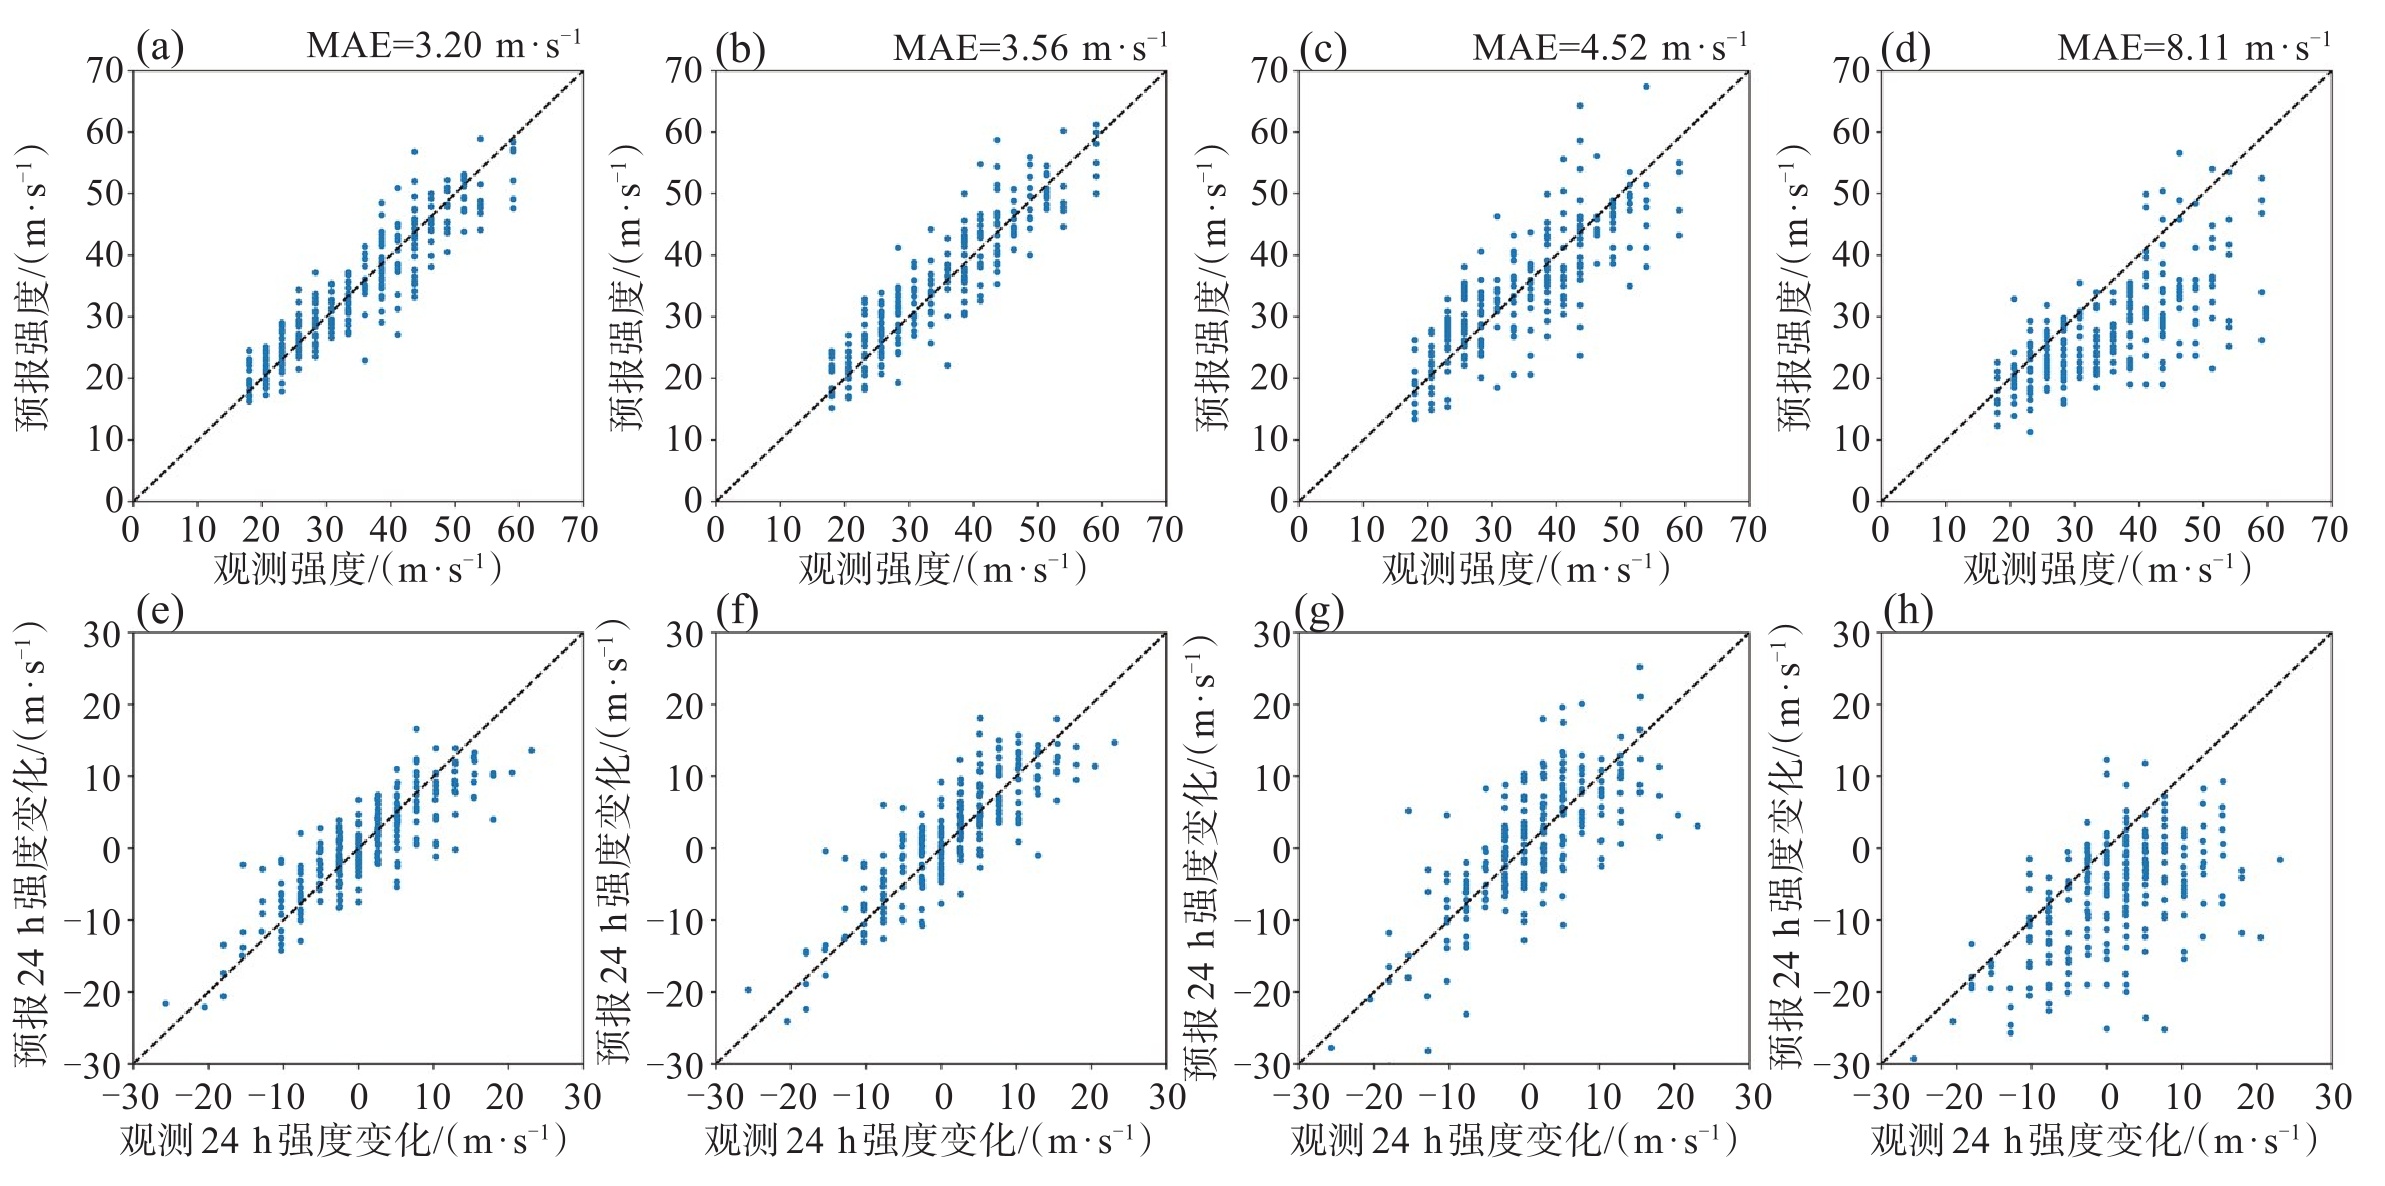
图 6 预报强度与观测强度的散点分布(a~d)和预报24 h强度变化与观测24 h强度变化的散点分布(e~h)
a、e.使用ERA5数据预报;b、f.使用ECMWF预报数据预报;c、g. NCEP;d、h.ECMWF。

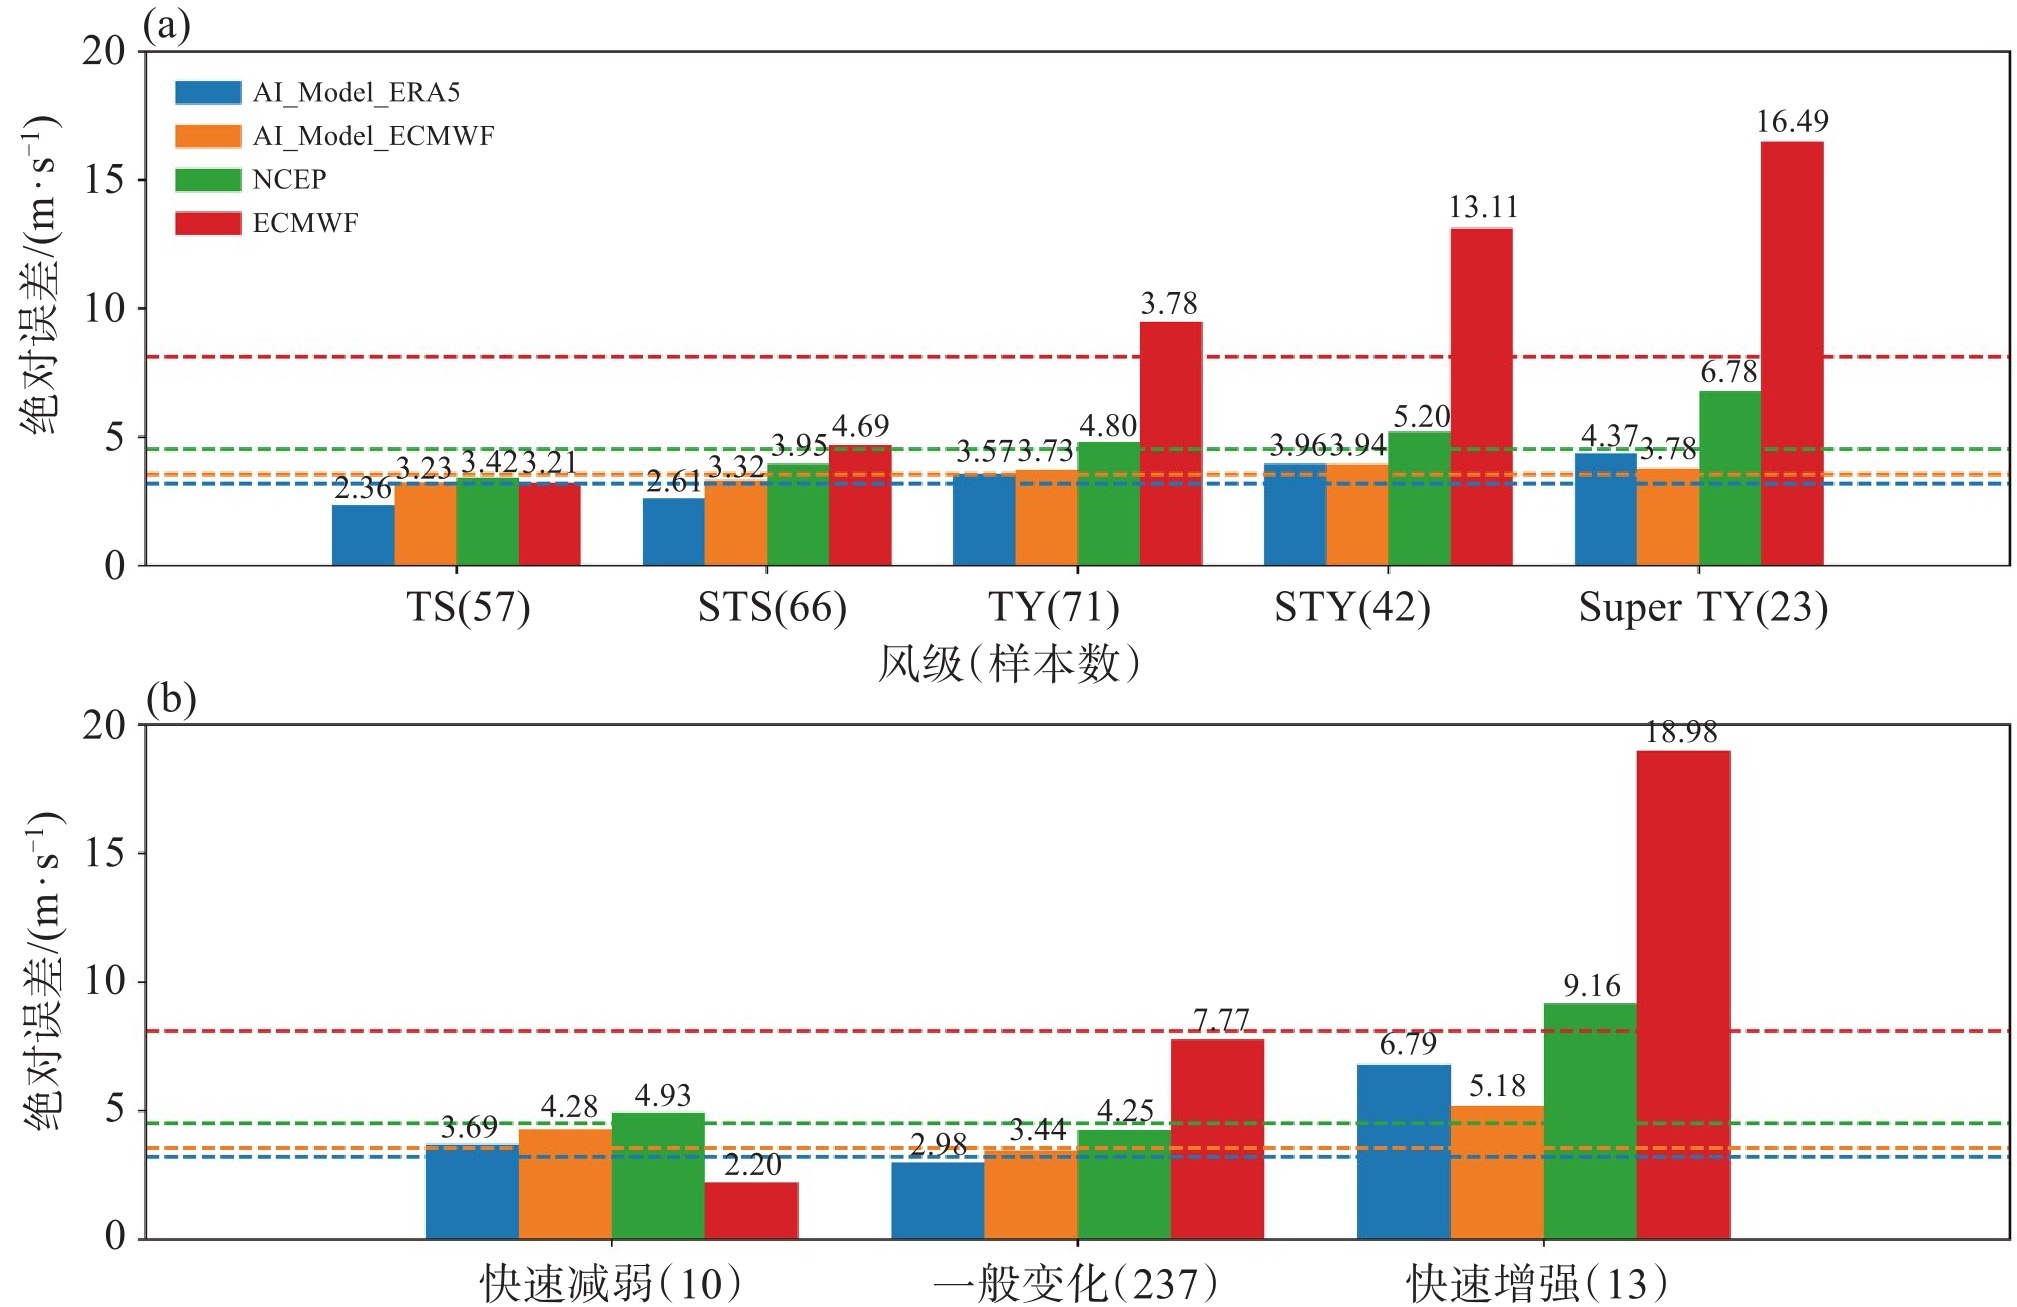
图 7 基于ERA5数据和ECMWF预报数据的模型预报以及NCEP和ECMWF预报对于不同台风等级(a)以及不同24 h台风强度变化(b)的平均绝对误差
TS代表热带风暴级,STS代表强热带风暴级,TY代表台风级,STY代表强台风级,Super TY代表超强台风级,横轴括号内为样本数。

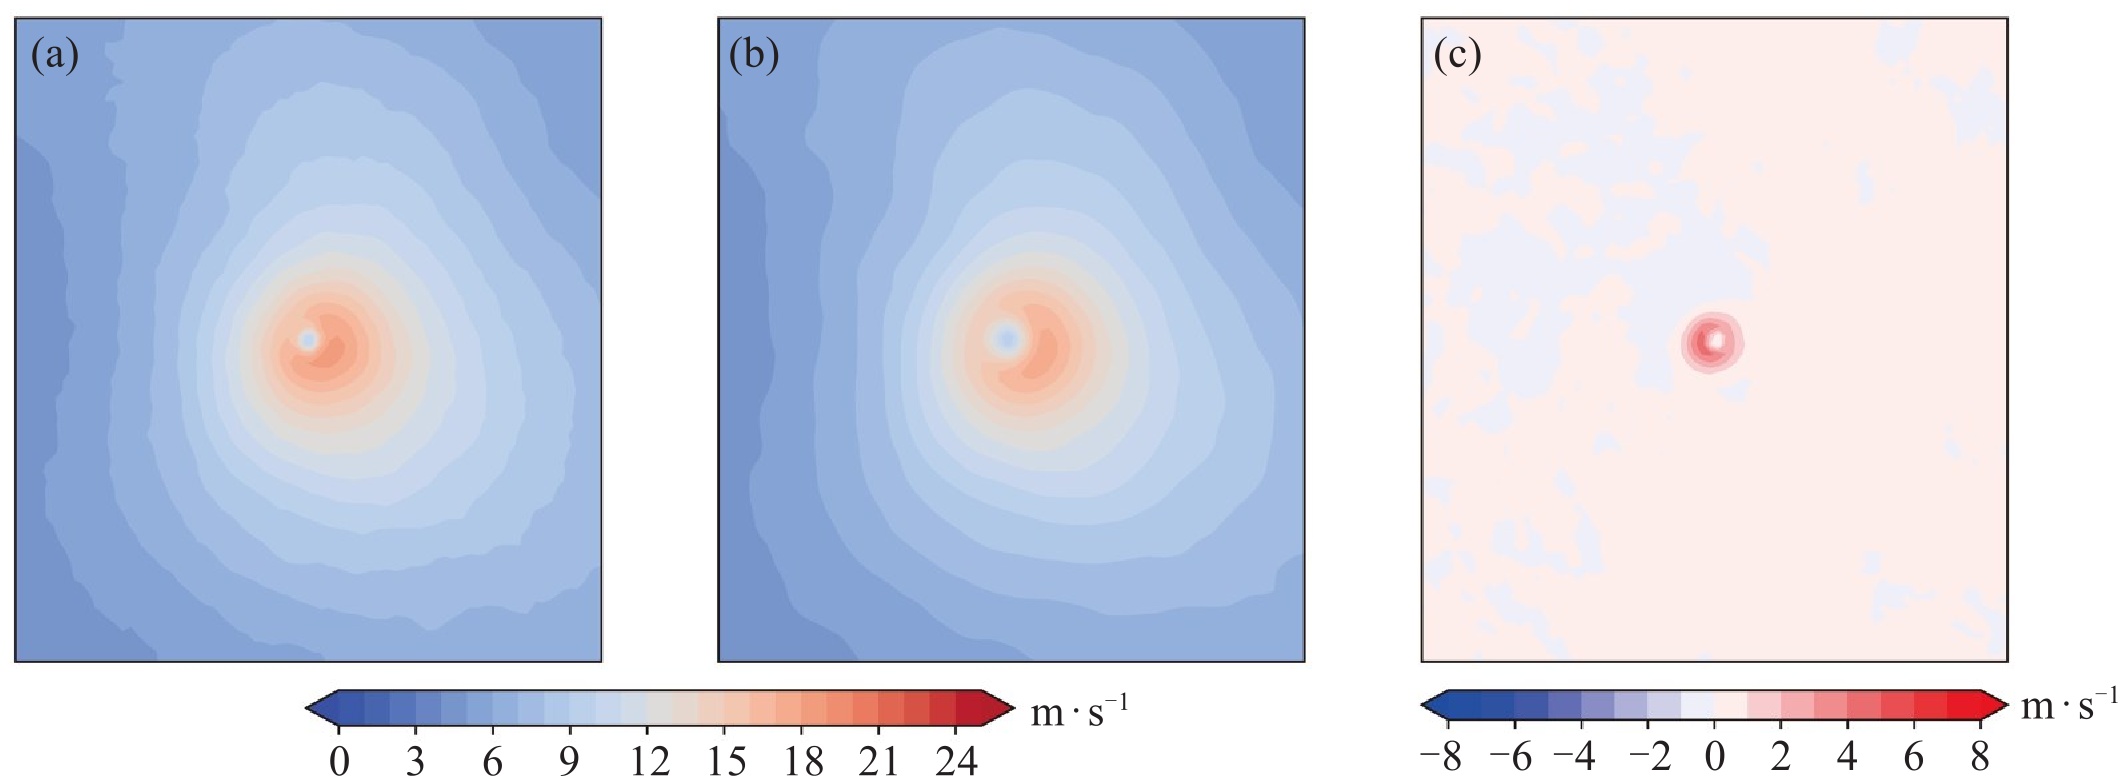
图 8 测试集(同样本)平均的ECMWF 00 h分析场的10 m风速与ERA5的10 m风速对比
a. ECMWF 00 h分析场;b.ERA5;c. ECMWF 00 h分析场与ERA5的差值。

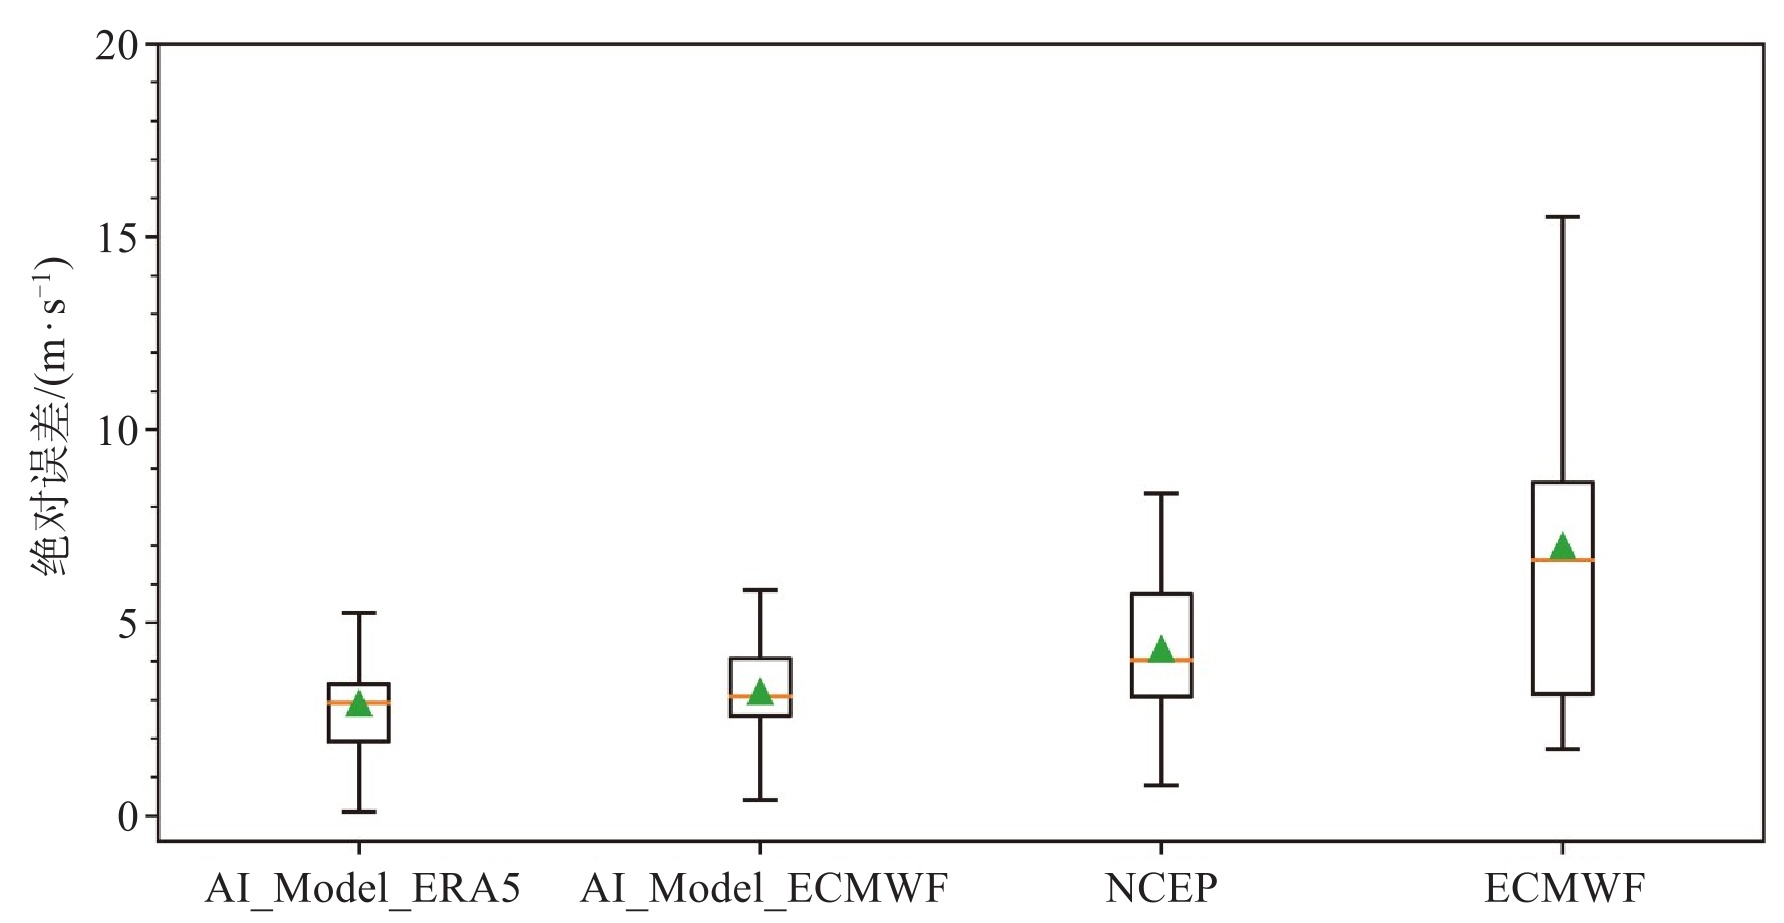
图 9 使用ERA5数据和ECMWF预报数据预报以及NCEP和ECMWF预报对于不同台风的平均绝对误差分布/(m·s-1)
箱体下、上边界分别代表第25%和第75%分位数,箱体内横线代表中位数,三角代表平均值,须线上、下两端分别代表最小和最大值(不包括异常值)。
表 1 数据集分布
台风数/个 快速增强样本数/个 快速减弱样本数/个 一般变化样本数/个 总样本数/个 训练集 712 462 344 12 100 12 906 验证集 43 23 21 603 647 ERA5测试集 39 32 21 570 623  下载: 导出CSV
表 2 模型输入中包含的要素
要素种类 要素名称 高空气象要素 气温、位势高度、相对湿度、纬向风、经向风 地面气象要素 2 m气温、海平面气压、海平面温度、10 m纬向风、10 m经向风 地面其他要素 海拔高度、海陆掩码
下载: 导出CSV
表 3 各组敏感性试验的最小测试集均方差
试验 测试集均方差/(m2·s-2) 200、500、850 hPa等压面 19.53 200、500、850 hPa等压面+移动路径表征层 17.69 200、500、700、850、950 hPa等压面+移动路径表征层 17.60 100、200、300、500、850 hPa等压面+移动路径表征层 17.98 100、200、300、500、700、850、950 hPa等压面+移动路径表征层 17.89
下载: 导出CSV
表 4 基于ERA5数据和ECMWF预报数据的模型预报以及NCEP和ECMWF预报对于不同台风的平均绝对误差
台风编号 AI_Model_ERA5/(m·s-1) AI_Model_ECMWF/(m·s-1) NCEP/(m·s-1) ECMWF/(m·s-1) 样本数/个 2201 2.72 3.14 3.35 8.87 10 2203 2.93 1.84 2.59 6.63 3 2204 1.24 2.70 2.96 3.10 4 2205 3.84 2.89 5.92 2.85 2 2207 0.68 0.91 3.60 5.70 1 2208 1.54 2.51 3.94 6.00 3 2209 3.42 4.88 5.53 5.65 4 2210 2.92 3.10 3.75 12.85 4 2211 3.86 3.99 5.78 13.95 13 2212 3.22 2.71 4.79 6.99 12 2213 1.72 2.98 4.35 5.66 5 2214 5.02 5.10 7.11 14.95 8 2216 7.70 3.76 8.35 15.52 4 2217 2.11 1.70 3.13 1.75 2 2218 5.77 5.84 7.60 6.86 5 2220 5.26 4.50 1.64 2.72 6 2222 1.92 1.88 3.95 2.01 11 2224 0.11 0.42 3.09 2.10 1 2301 0.92 0.65 5.68 6.70 1 2302 4.03 4.06 5.04 9.71 21 2303 3.01 2.83 1.70 7.86 10 2304 1.99 2.65 1.70 5.12 4 2305 2.94 4.07 2.54 8.63 12 2306 3.39 2.59 3.16 5.96 23 2307 2.54 3.00 4.24 9.28 17 2309 3.33 4.77 6.11 7.52 17 2310 3.2 4.47 7.02 3.16 7 2311 1.48 4.09 6.10 7.82 12 2312 2.31 3.72 4.03 1.72 5 2313 1.41 1.45 1.80 3.15 2 2314 4.00 3.43 4.83 8.56 17 2315 2.88 5.15 5.74 17.73 12 2316 2.07 3.66 0.79 3.10 2
下载: 导出CSV
-
[1] 端义宏, 陈联寿, 许映龙, 等. 我国台风监测预报预警体系的现状及建议[J]. 中国工程科学, 2012, 14(9): 4-9. [2] 许映龙, 张玲, 高拴柱. 我国台风预报业务的现状及思考[J]. 气象, 2010, 36(7): 43-49. [3] Emanuel K. 100 years of progress in tropical cyclone research[J]. Meteorological Monographs, 2018, 59: 15.1-15.68. [4] Chen R, Zhang W M, Wang X. Machine learning in tropical cyclone forecast modeling: a review[J]. Atmosphere, 2020, 11(7): 676. [5] Kieran B, Gabriel V, Hiroyuki M, et al. Projected response of tropical cyclone intensity and intensification in a global climate model[J]. Journal of Climate, 31(20): 8281-8303. [6] Wang S, Toumi R. Recent migration of tropical cyclones toward coasts[J]. Science, 2021, 371(6528): 514-517. [7] Emanuel K, Zhang F Q. On the predictability and error sources of tropical cyclone intensity forecasts[J]. Journal of the Atmospheric Sciences, 2016, 73(9): 3739-3747. [8] 端义宏, 方娟, 程正泉, 等. 热带气旋研究和业务预报进展—第九届世界气象组织热带气旋国际研讨会(IWTC-9)综述[J]. 气象学报, 2020, 78(3): 537-550. [9] Kaplan J, DeMaria M. Large-scale characteristics of rapidly intensifying tropical cyclones in the north Atlantic Basin[J]. Weather and Forecasting, 2003, 18(6): 1093-1108. [10] Kaplan J, Rozoff C M, DeMaria M, et al. Evaluating environmental impacts on tropical cyclone rapid intensification predictability utilizing statistical models[J]. Weather and Forecasting, 2015, 30(5): 1374-1396. [11] 吕心艳, 董林, 高拴柱. 台风"米克拉"在台湾海峡南部快速增强的原因分析[J]. 气象学报, 2023, 81(6): 866-878. [12] Mercer A, Grimes A. Atlantic tropical cyclone rapid intensification probabilistic forecasts from an ensemble of machine learning methods [J]. Procedia Computer Science, 2017, 114: 333-340. [13] Rozoff C M, Velden C S, Kaplan J, et al. Improvements in the probabilistic prediction of tropical cyclone rapid intensification with passive microwave observations[J]. Weather and Forecasting, 2015, 30(4): 1016-1038. [14] Bhatia K T, Nolan D S, Schumacher A B, et al. Improving tropical cyclone intensity forecasts with PRIME[J]. Weather and Forecasting, 2017, 32(4): 1353-1377. [15] DeMaria M, Kaplan J. A statistical hurricane intensity prediction scheme (SHIPS) for the Atlantic Basin[J]. Weather and Forecasting, 1994, 9(2): 209-220. [16] Knaff J A, Sampson C R, DeMaria M. An operational statistical typhoon intensity prediction scheme for the western north Pacific[J]. Weather and Forecasting, 2005, 20(4): 688-699. [17] Chen P Y, Yu H, Chan J C L. A western North Pacific tropical cyclone intensity prediction scheme[J]. Acta Meteorologica Sinica, 2011, 25(5): 611-624. [18] Pan B, Xu X, Shi Z W. Tropical cyclone intensity prediction based on recurrent neural networks[J]. Electronics Letters, 2019, 55(7): 413-415. [19] Jiang S L, Fan H J, Wang C Z. Improvement of typhoon intensity forecasting by using a novel spatio-temporal deep learning model[J]. Remote Sensing, 2022, 14(20): 5205. [20] Chen R, Wang X, Zhang W M, et al. A hybrid CNN-LSTM model for typhoon formation forecasting[J]. GeoInformatica, 2019, 23(3): 375-396. [21] Wang X, Chen K, Liu L, et al. Global tropical cyclone intensity forecasting with multi-modal multi-scale causal autoregressive model[J]. arXiv:2402.13270v1. [22] Yuan S J, Wang C, Mu B, et al. Typhoon intensity forecasting based on LSTM using the rolling forecast method[J]. Algorithms, 2021, 14(3): 83. [23] Zhou J Y, Xiang J, Huang S X. Classification and prediction of typhoon levels by satellite cloud pictures through GC-LSTM deep learning model[J]. Sensors, 2020, 20(18): 5132. [24] Xu G N, Lin K H, Li X T, et al. SAF-Net: a spatio-temporal deep learning method for typhoon intensity prediction[J]. Pattern Recognition Letters, 2022, 155: 121-127. [25] Vaswani A, Shazeer N, Parmar N, et al. Attention is All you Need[J]. arXiv:1706.03762v7. [26] Dosovitskiy A, Beyer L, Kolesnikov A, et al. An image is worth 16x16 words: Transformers for image recognition at scale[J]. arXiv:2010.11929v2. [27] Guo B, Li X, Yang M, et al. Predicting microsatellite instability and key biomarkers in colorectal cancer from H&E‐stained images: achieving state‐of‐the‐art predictive performance with fewer data using Swin Transformer[J]. The Journal of Pathology: Clinical Research, 2023, 9(3): 223-235. [28] Bertasius G, Wang H, Torresani L. Is Space-Time Attention All You Need for Video Understanding [A]. arXiv:2102.05095v4. [29] Ioffe S, Ioffe S, Szegedy C, et al. Batch normalization: accelerating deep network training by reducing internal covariate shift[C]//Proceedings of the 32nd International Conference on Machine Learning. 2015, 37: 448-456. [30] Knapp K R, Kruk M C, Levinson D H, et al. The international best track archive for climate stewardship (IBTrACS): unifying tropical cyclone data[J]. Bulletin of the American Meteorological Society, 2010, 91(3): 363-376. -

 点击查看大图
计量
- 文章访问数: 2
- HTML全文浏览量: 0
- PDF下载量: 0
- 被引次数: 0
 粤公网安备 4401069904700003号