



Influence of Air Density on Engineering Wind Pressure Values Under Different Strong-wind Weather Conditions
-
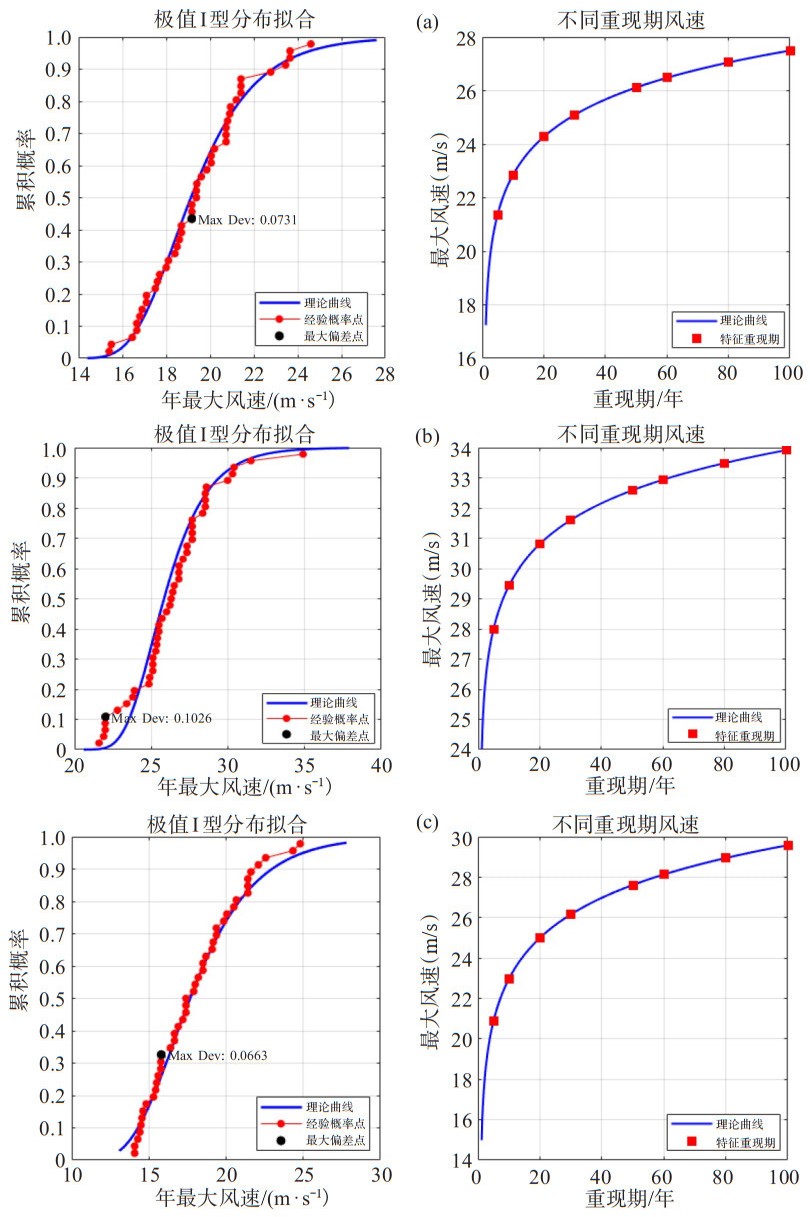
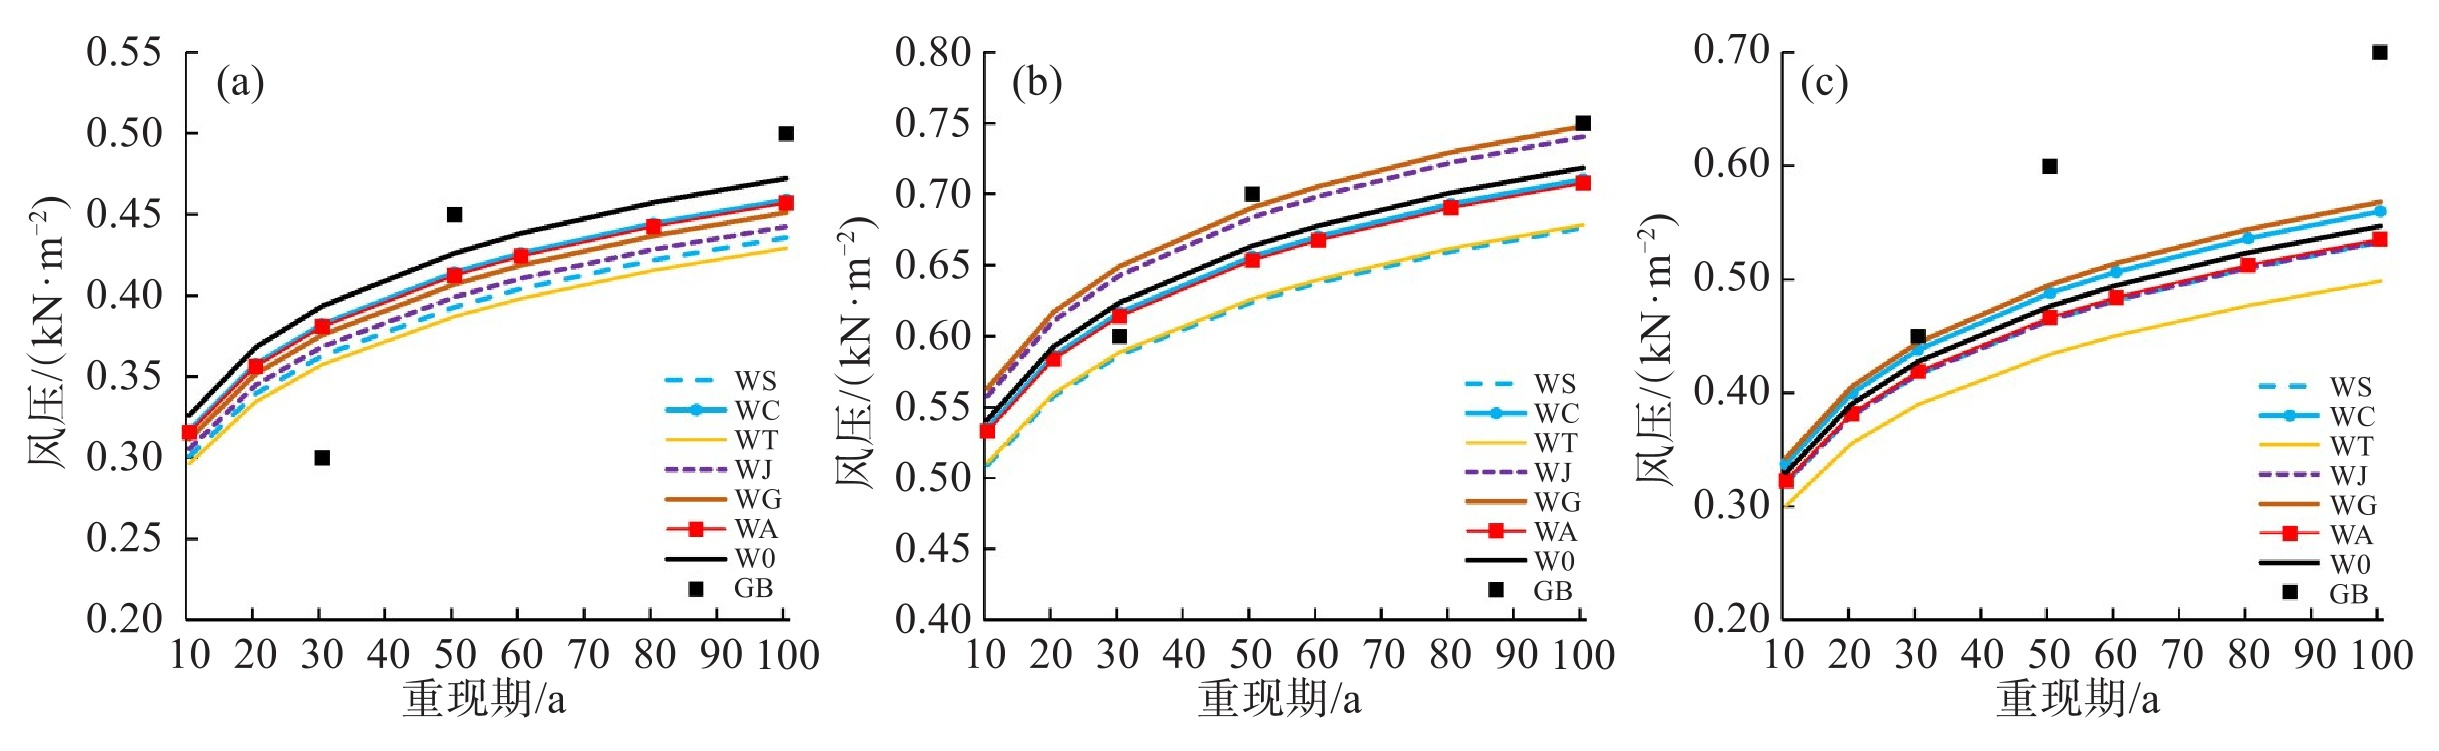
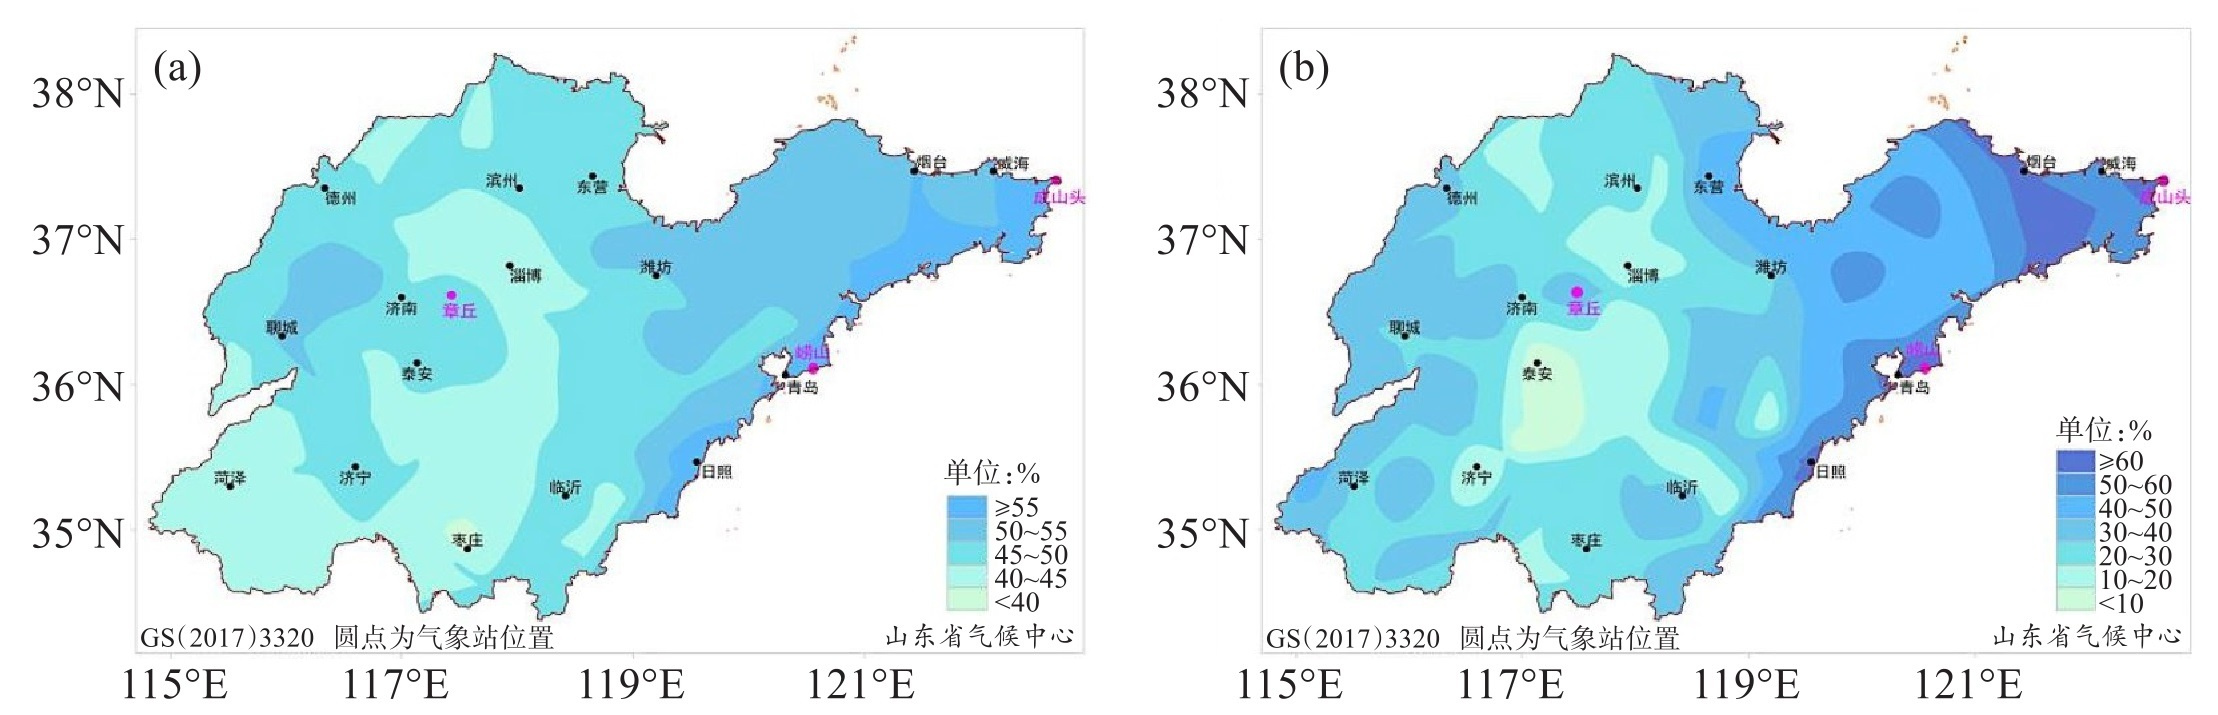
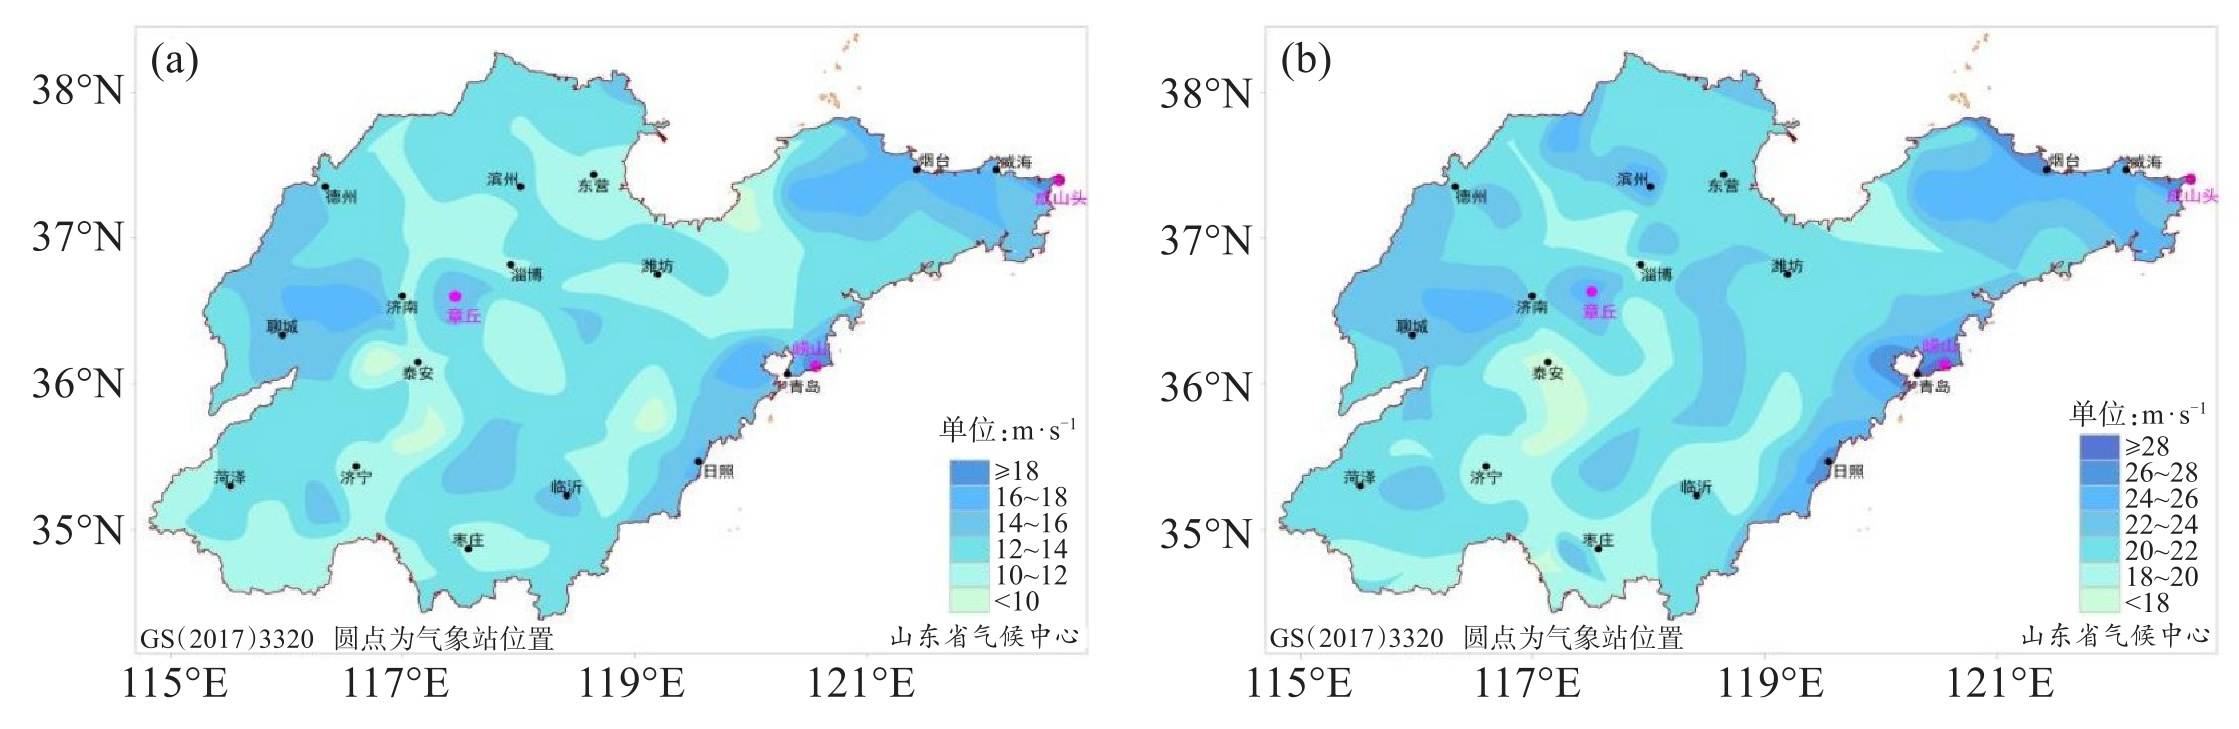
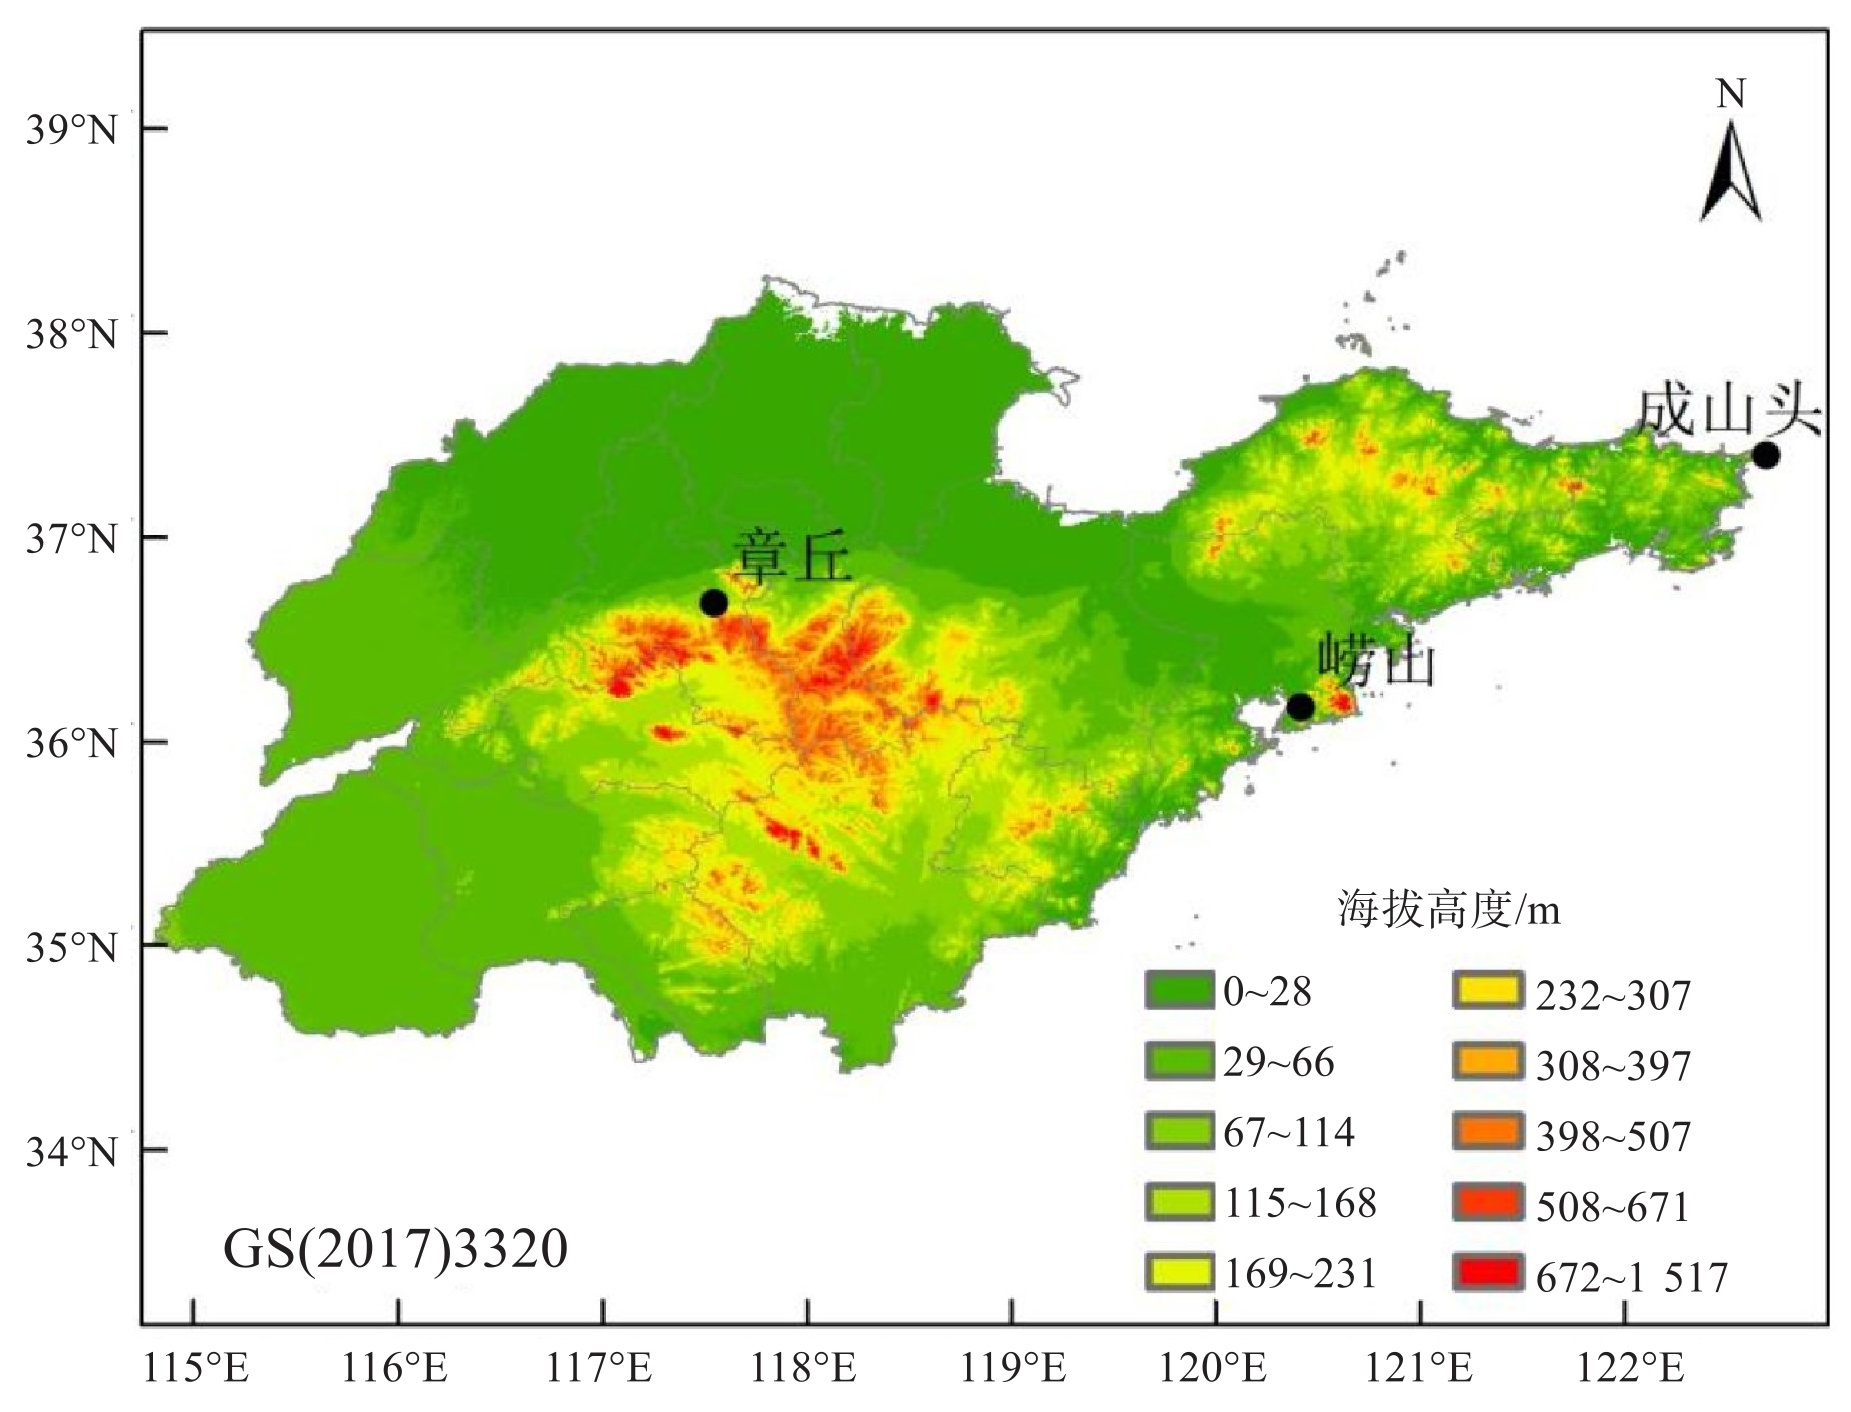
摘要: 为探究不同强风天气系统下空气密度对工程风压取值的影响, 选取山东章丘、成山头、崂山3个代表性气象站点, 基于近10年寒潮、热带气旋、强对流大风观测资料与45年历史大风数据, 采用极值Ⅰ型分布推算多重现期最大风速, 定量分析不同空气密度对应的风压差异。结果表明, 强风过程空气密度波动显著, 受天气系统与地理位置影响存在明显空间分异, 沿海成山头、崂山冷季极端大风空气密度峰值显著高于内陆章丘站。各站点重现期极值风速成山头最大, 崂山次之, 章丘最小。各站实况风压均未超出国标推荐限值, 但国标统一取值存在区域适配性不足、整体偏保守的问题。成山头、崂山强风工况风压较常规密度计算的风压值偏高4%~6%, 需采用实况强风密度修正风压取值, 其中成山头实况风压与国标值基本持平;章丘、崂山实况风压较国标值分别偏低约9%~16%、20%~40%, 章丘采用常年空气密度取值, 可兼顾工程抗风安全与经济成本。本研究明确了山东内陆与沿海差异化风压参数取值方法, 可为区域工程抗风精细化设计提供科学依据。Abstract: To investigate the influence of air density under different strong-wind weather systems on engineering wind pressure determination, three representative meteorological stations in Shandong Province, namely Zhangqiu, Chengshantou and Laoshan, were selected. Based on 10-year observational data of gales induced by cold waves, tropical cyclones and severe convection, together with 45-year historical gale records, extreme wind speeds for multiple return periods were estimated using the Type Ⅰ extreme value distribution. The differences in wind pressure corresponding to varied air densities were quantitatively analyzed. The results show that air density fluctuates significantly during strong-wind processes and presents distinct spatial differentiation governed by weather system type and geographical setting. Peak air densities during extreme cold-season gales at the coastal stations of Chengshantou and Laoshan are considerably higher than those at the inland station of Zhangqiu. Extreme wind speeds for all different return periods rank the highest at Chengshantou, followed by Laoshan and Zhangqiu. Actual wind pressures at all stations do not exceed the national standard limits. However, the unified national standard air density assumption proved regionally inapplicable and generally conservative. Wind pressures under strong-wind conditions at Chengshantou and Laoshan are 4%-6%higher than those calculated using conventional air density, indicating that actual strong-wind density should be adopted for wind pressure correction, and the corrected wind pressure at Chengshantou is then basically consistent with the standard value. Actual wind pressures at Zhangqiu and Laoshan are approximately 9%-16%and 20%-40%lower than the national standard values, respectively. Adopting the annual mean air density for Zhangqiu could balance structural wind-resistant safety and economic cost. This study proposes differentiated wind pressure parameter selection schemes for inland and coastal areas of Shandong Province, providing a scientific reference for refined wind-resistant engineering design.
-
Key words:
- air density /
- cold wave /
- return period /
- wind pressure
-
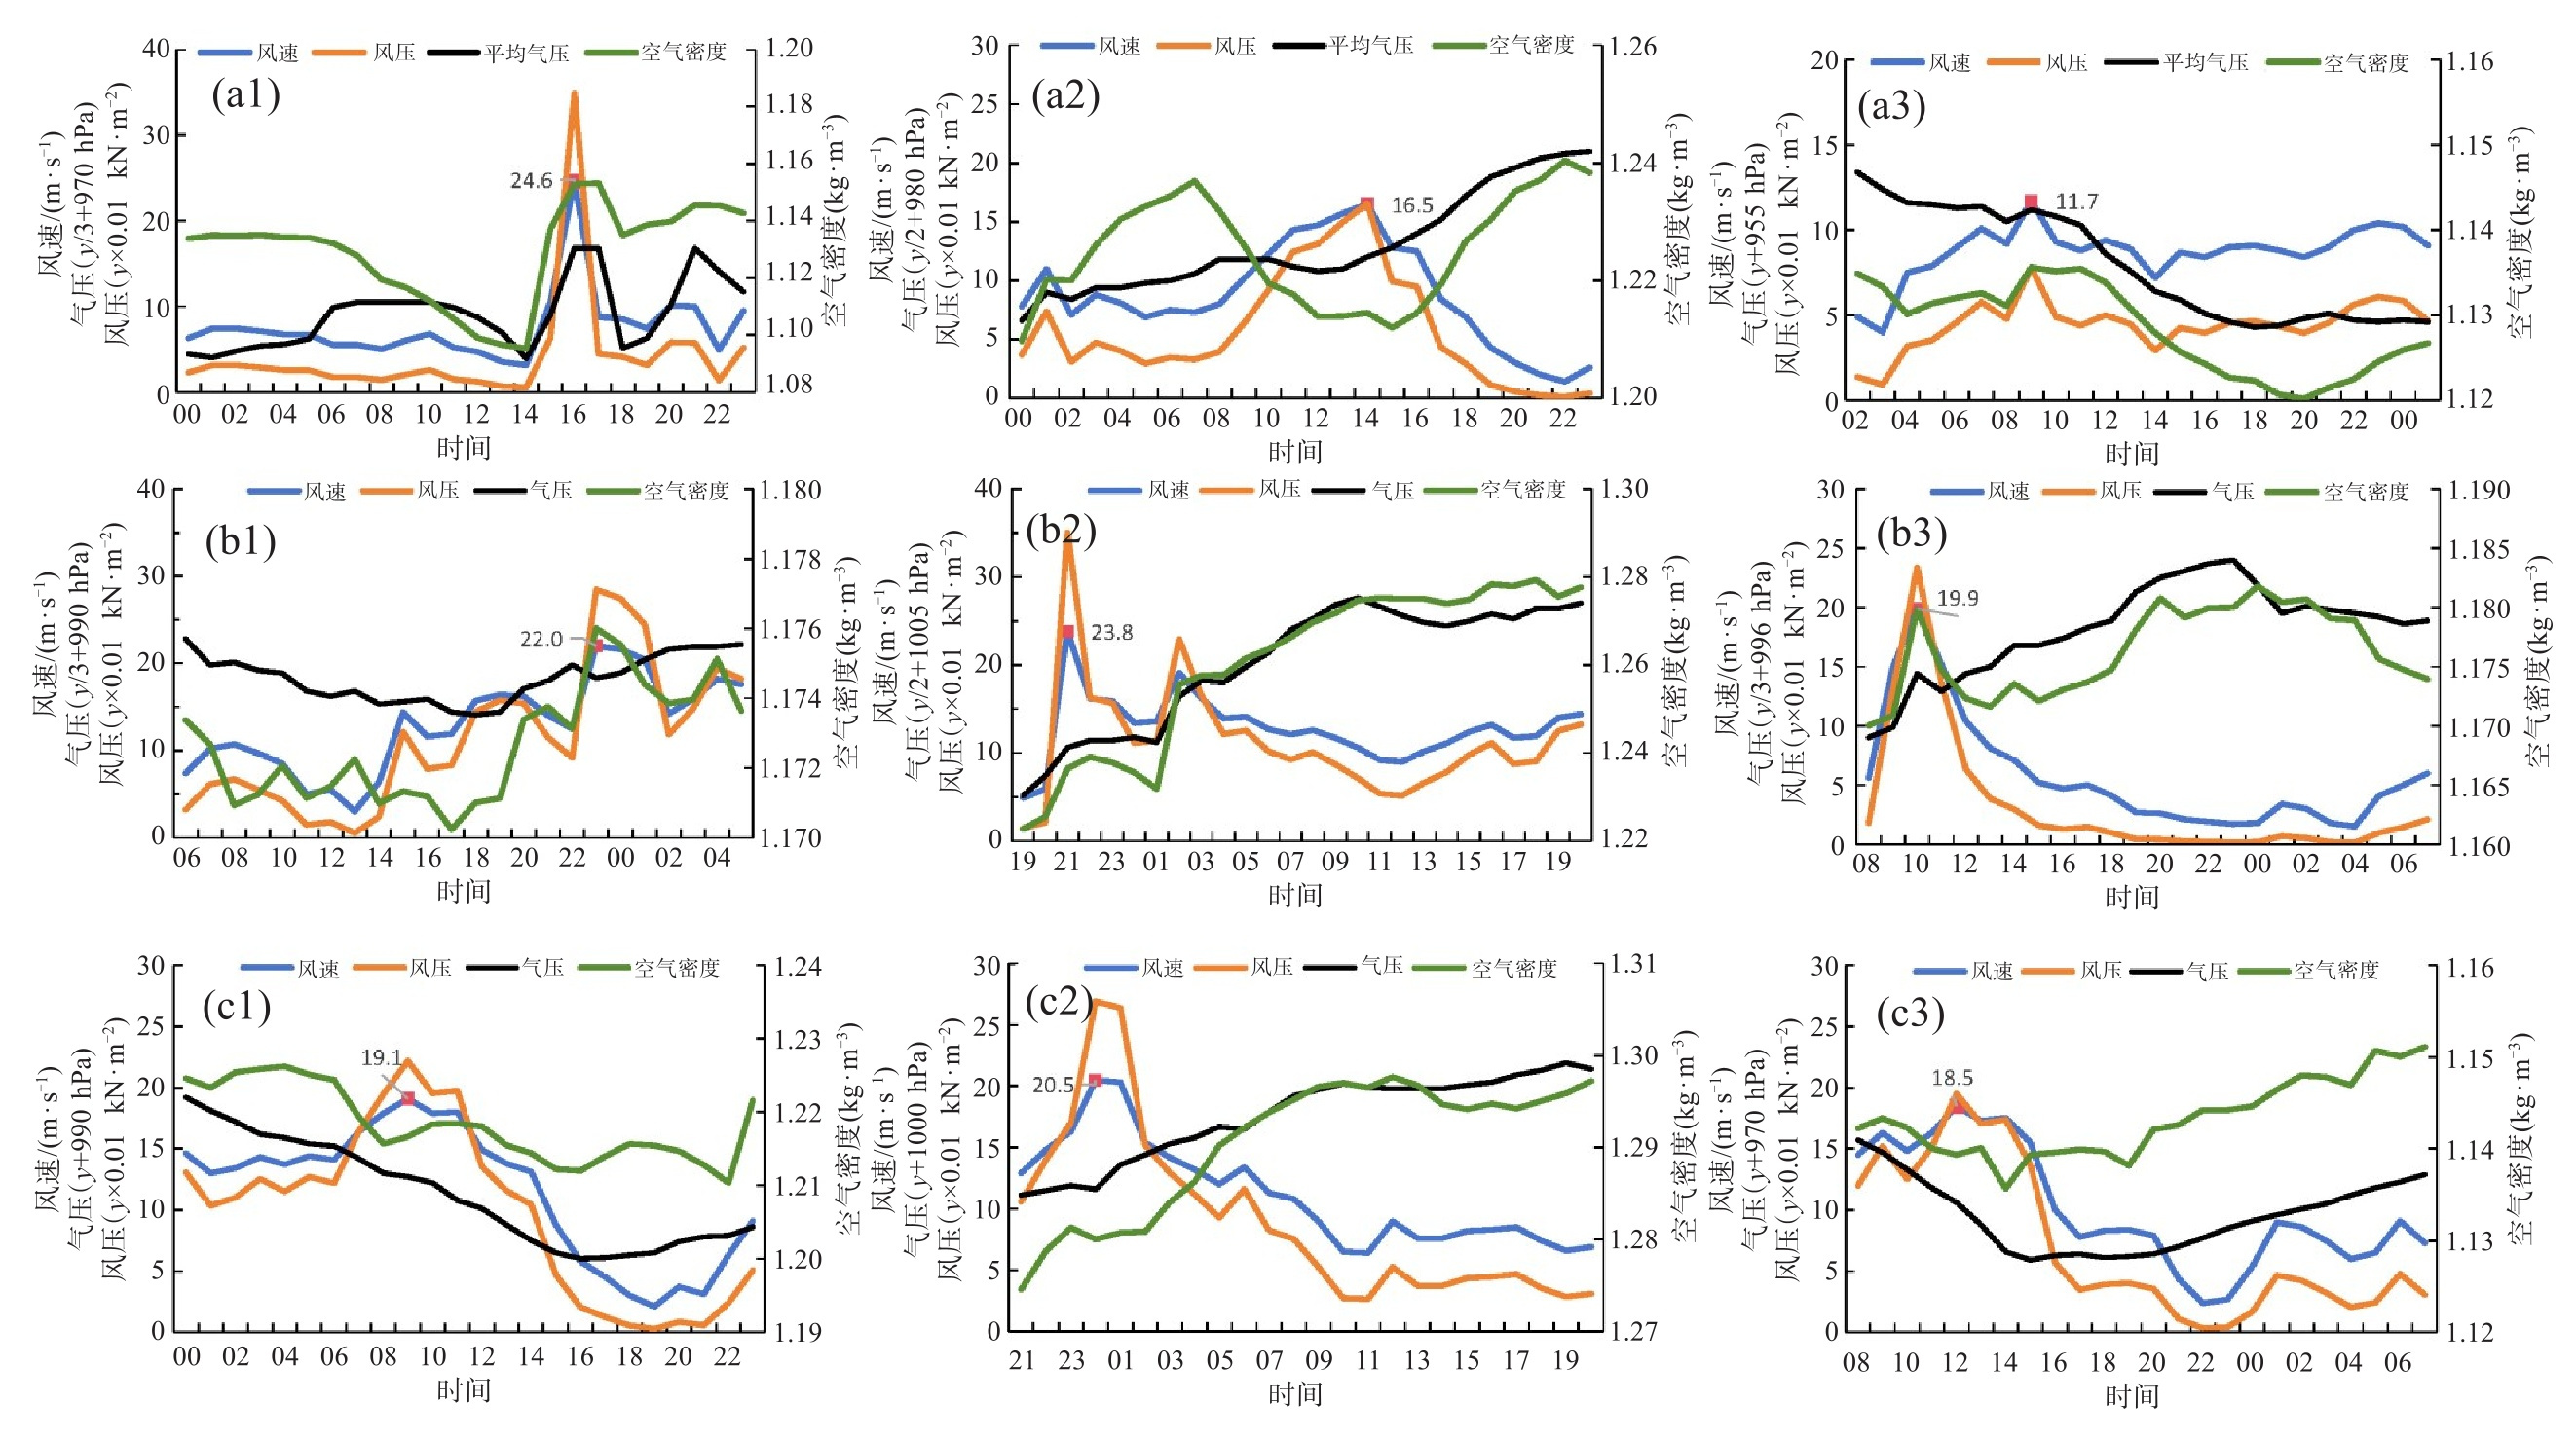
表 1 典型强风过程最大风速及对应时刻的空气密度、风压值
站点 时间 天气类型 最大风速/(m·s-1) 气压/hPa 对应时刻空气密度/(kg·m-3) 对应时刻风压/(kN·m-2) 章丘 2023年11月6日 寒潮 16.5 986.0 1.21 0.165 2021年6月30日 强对流 24.6 975.6 1.15 0.349 2019年8月11日 热带气旋(利奇马) 11.7 966.2 1.14 0.078 成山头 2019年11月17日 寒潮 23.8 1010.3 1.24 0.350 2020年7月23日 强对流 22.0 996.1 1.18 0.285 2022年9月4日 热带气旋(轩岚诺) 19.9 1000.8 1.18 0.234 崂山 2020年1月8日 寒潮 20.5 1011.6 1.28 0.269 2023年4月4日 强对流 19.1 1002.7 1.22 0.222 2019年8月11日 热带气旋(利奇马) 18.5 980.6 1.14 0.195  下载: 导出CSV
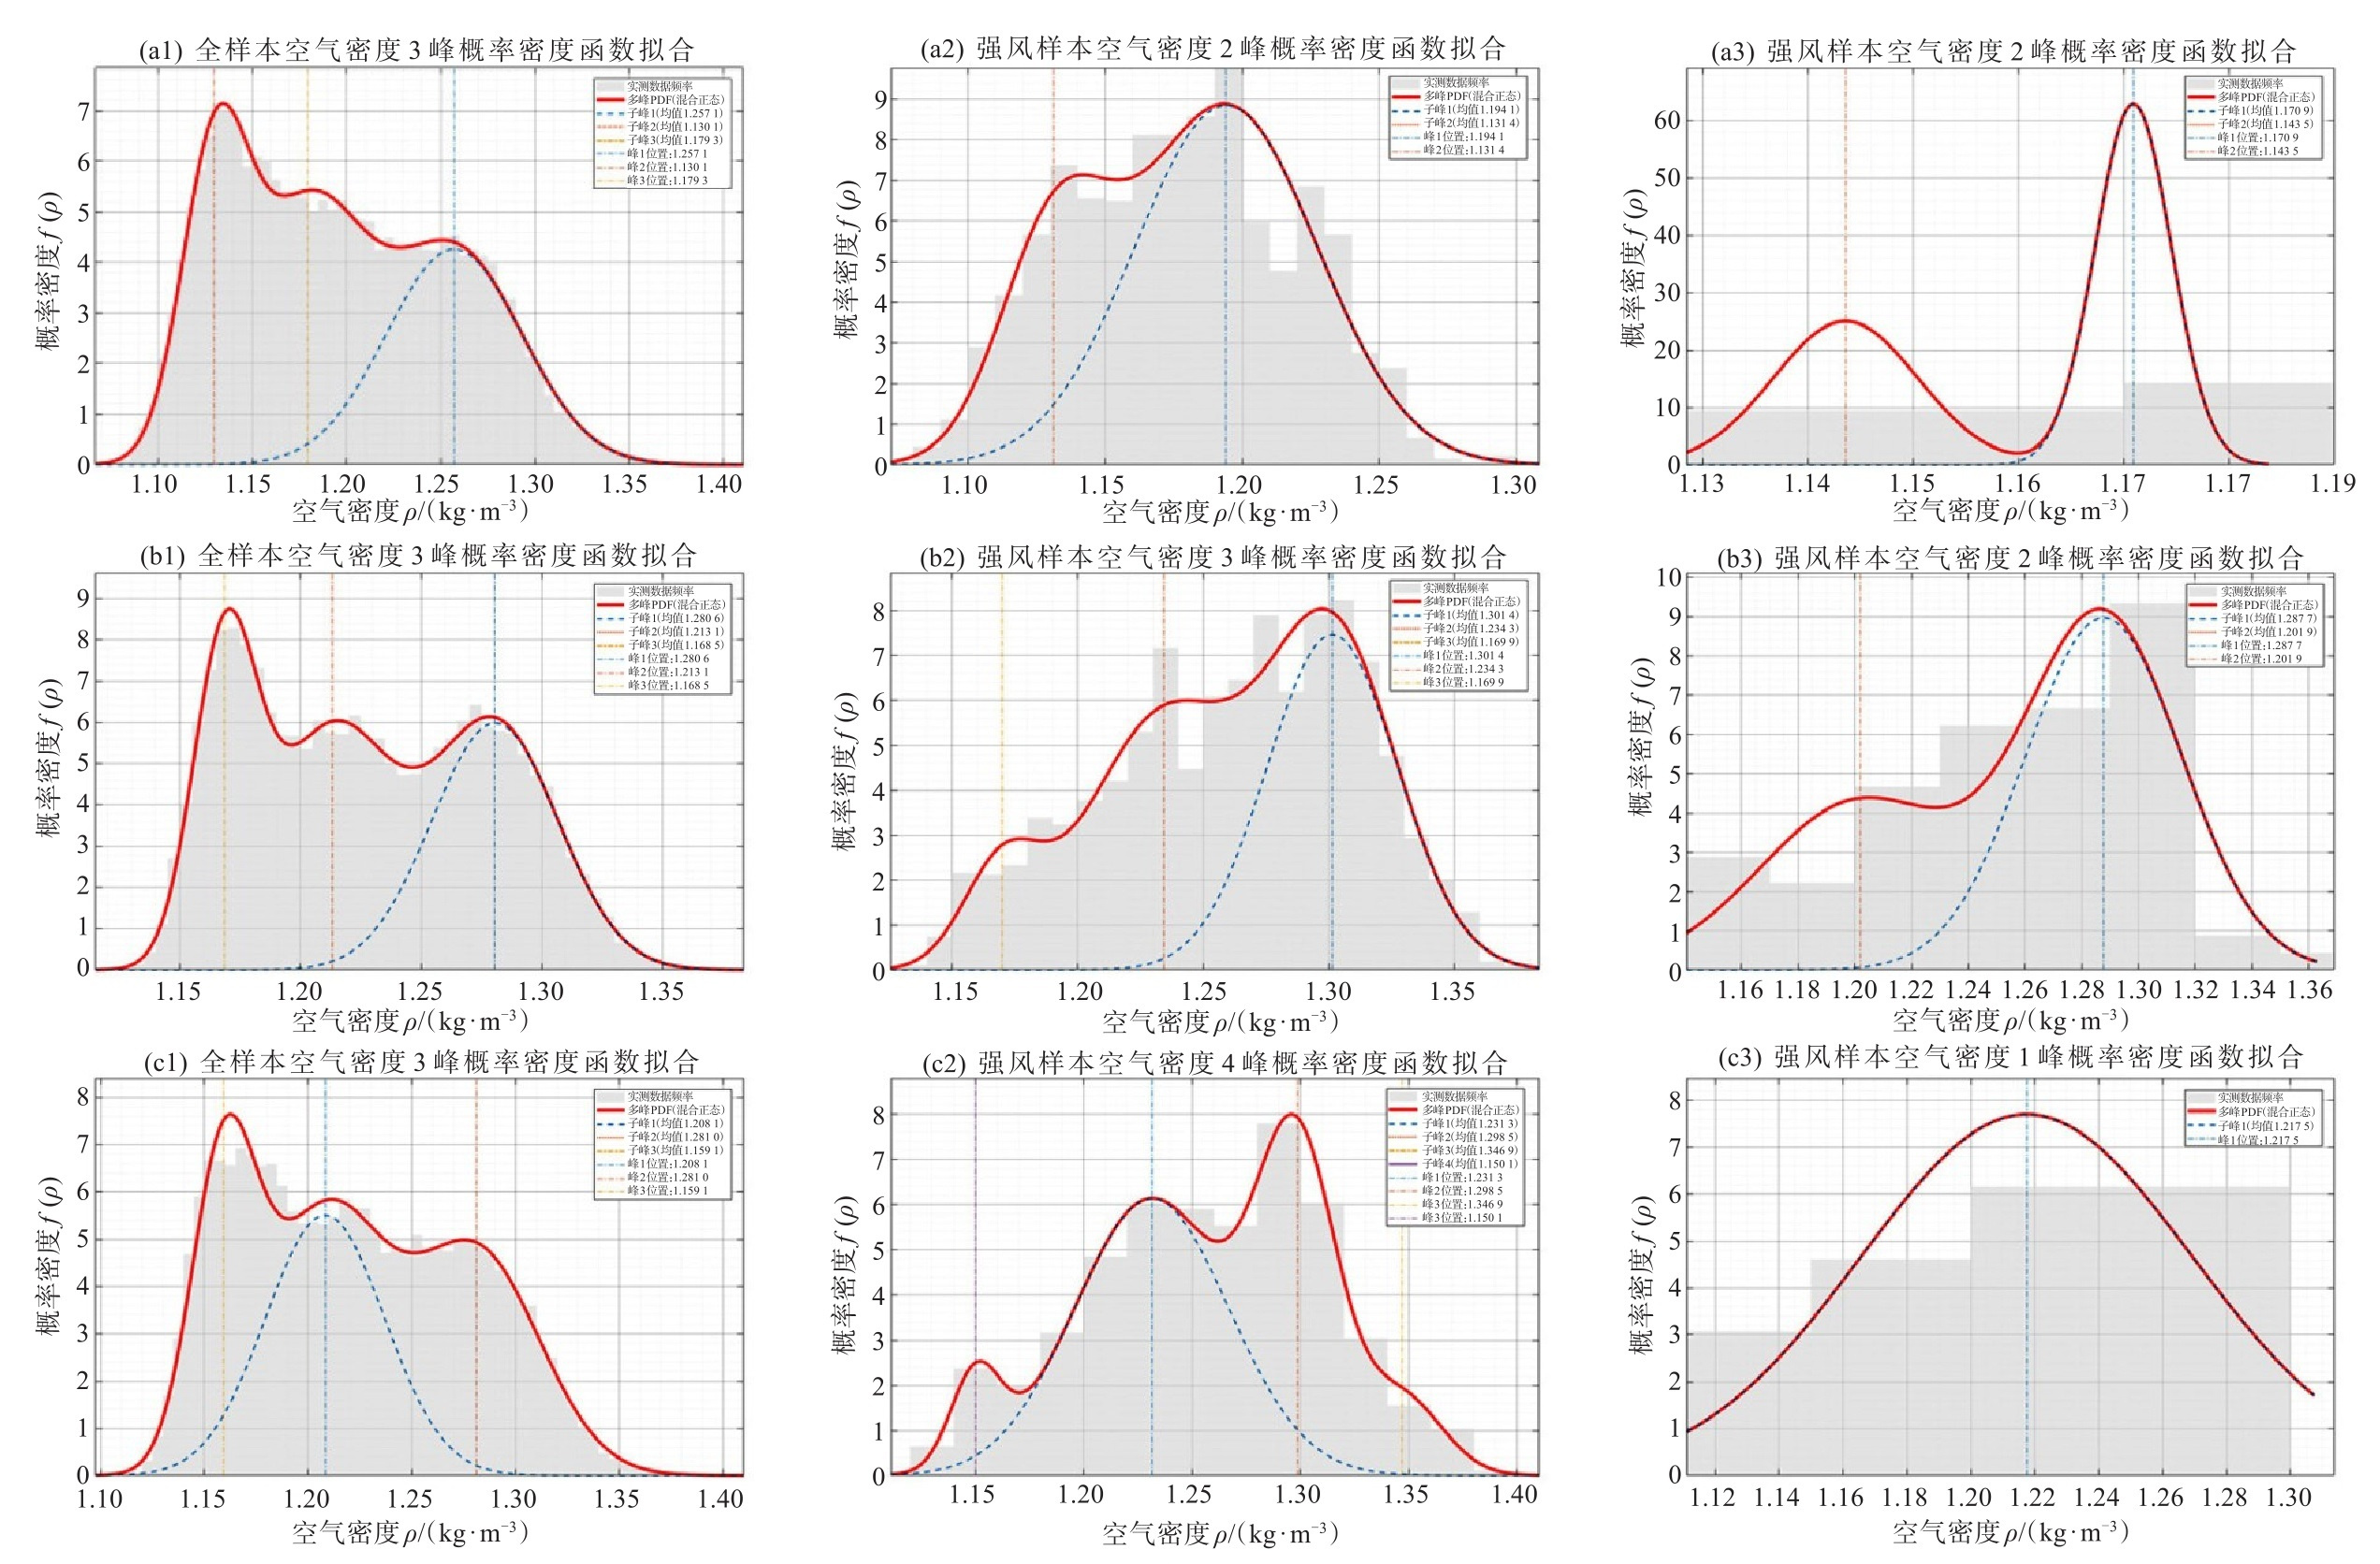
表 2 近10年全样本、强风样本和大风样本下空气密度的高斯混合分布多峰拟合结果
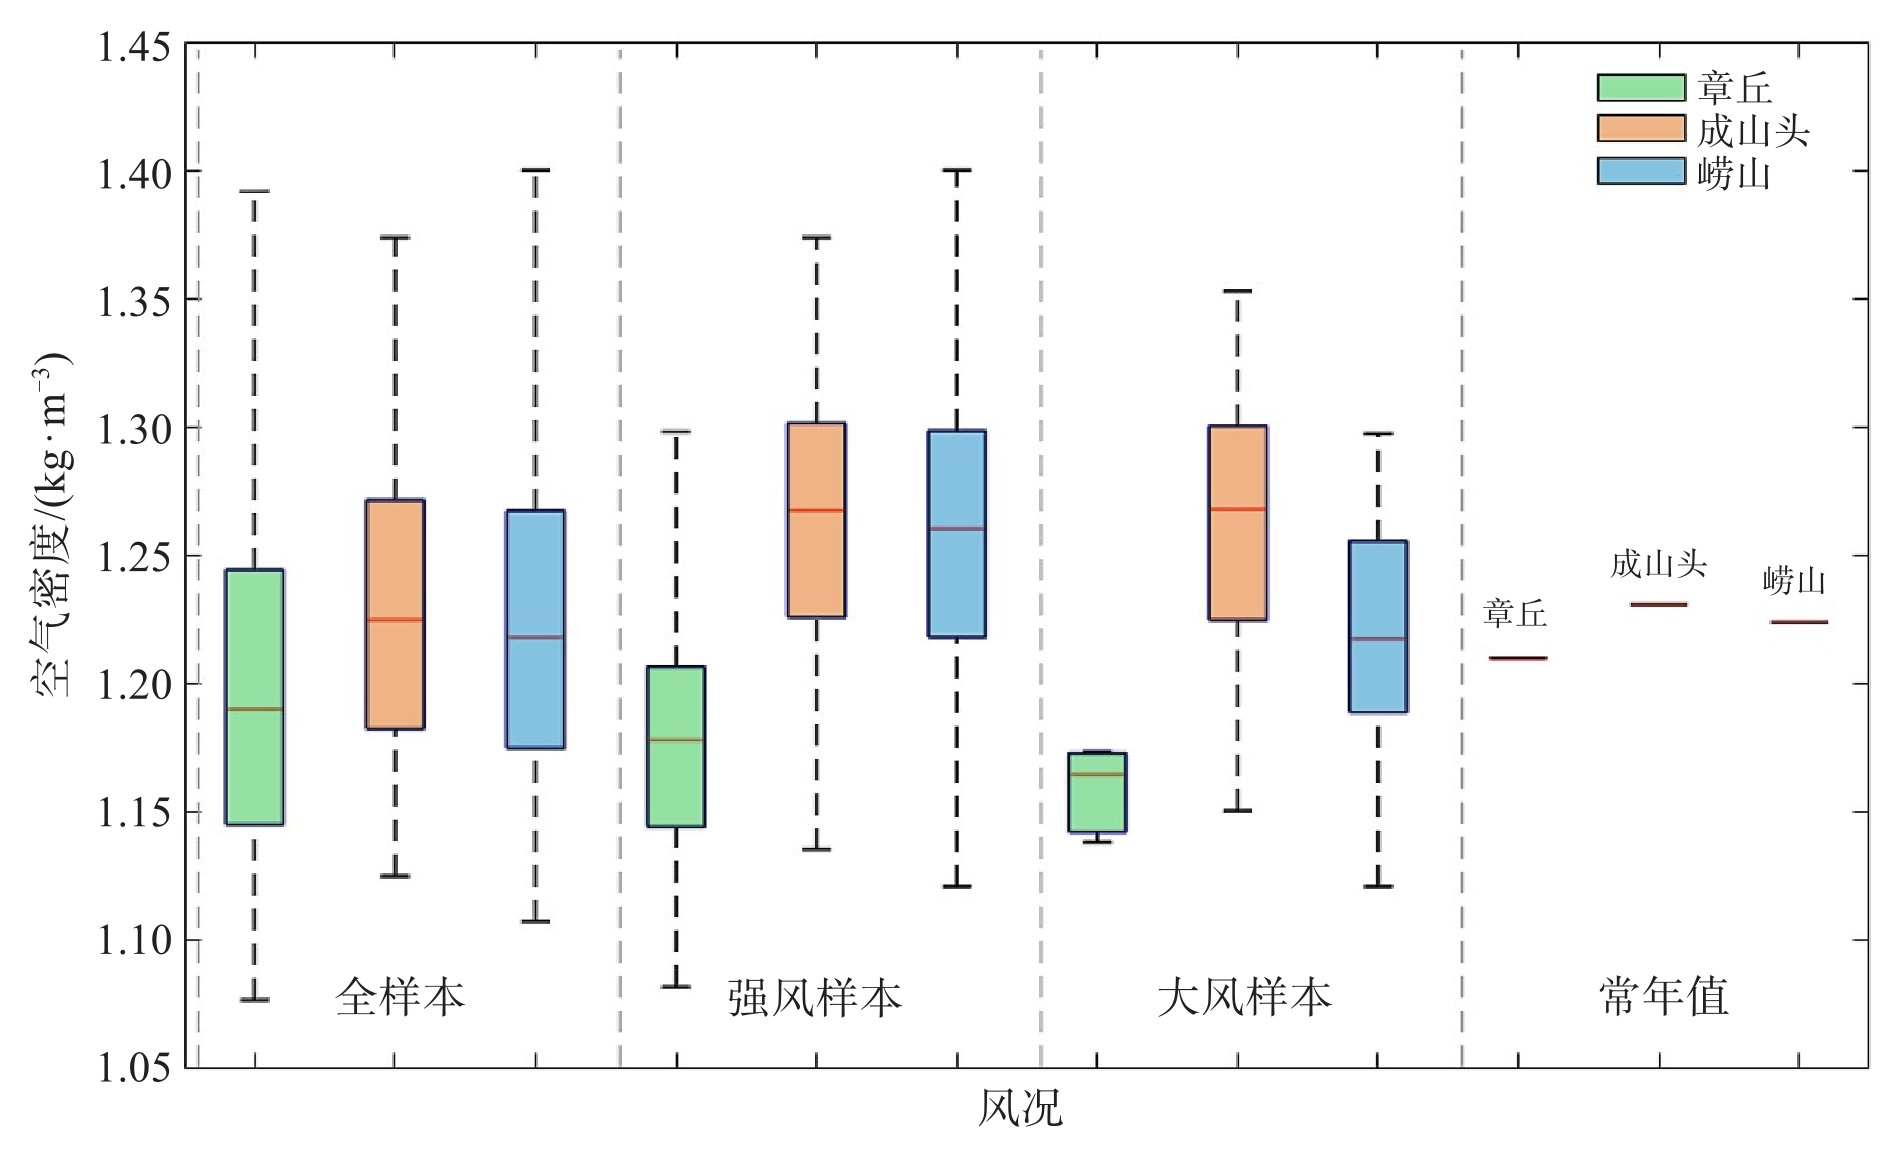
参数 章丘 成山头 崂山 峰1 峰2 峰3 峰1 峰2 峰3 峰1 峰2 峰3 峰4 全样本 峰值(kg·m-3) 1.257 1.179 0.130 1.281 1.213 1.169 1.208 1.281 1.159 - 权重 0.38 0.36 0.26 0.39 0.36 0.25 0.40 0.36 0.24 - 强风样本 峰值(kg·m-3) 1.194 1.131 - 1.301 1.234 1.170 1.231 1.299 1.347 1.150 权重 0.74 0.26 - 0.49 0.43 0.08 0.54 0.32 0.08 0.06 大风样本 峰值(kg·m-3) 1.171 1.144 - 1.288 1.202 - 1.218 - - - 权重 0.57 0.43 - 0.62 0.38 - 1.00 - - - 常年值(1991—2020) 空气密度(kg·m-3) 1.210 1.231 1.224
下载: 导出CSV
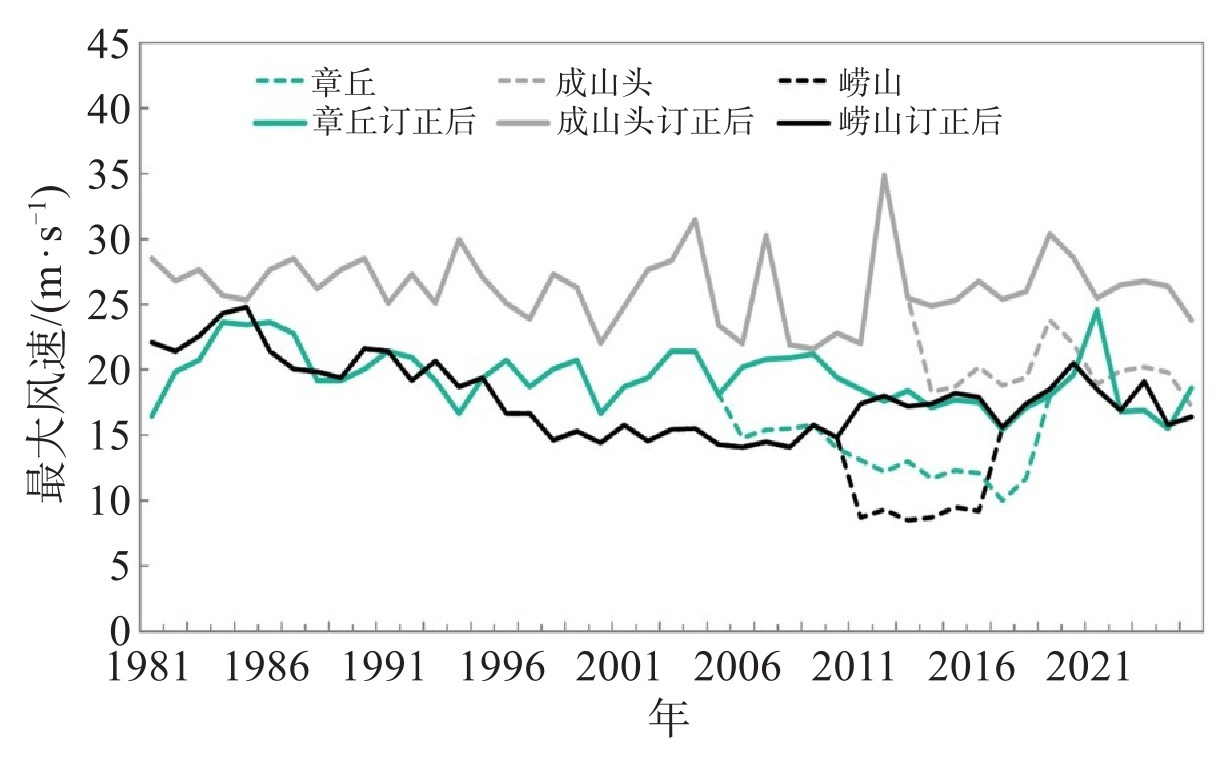
表 3 1981—2025年气象站极值Ⅰ型分布拟合不同重现期下的设计风速/(m·s-1)
站点 重现期 10 a 20 a 30 a 50 a 100 a 章丘 22.62 23.97 24.75 25.72 27.03 成山头 29.43 30.80 31.59 32.58 33.91 崂山 22.07 23.80 24.80 26.05 27.74
下载: 导出CSV
表 4 气象站在不同天气类型下空气密度对应的风压值
站点 空气密度(kg·m-3) 风压(kN·m-2) 分类 30 a 50 a 100 a 章丘 ρS 1.153 WS 0.363 0.393 0.436 ρC 1.215 WC 0.382 0.414 0.459 ρT 1.136 WT 0.358 0.387 0.429 ρG 1.194 WG 0.376 0.407 0.451 ρJ 1.171 WJ 0.369 0.399 0.442 ρA 1.210 WA 0.381 0.412 0.457 ρ0 1.250 W0 0.393 0.426 0.472 成山头 ρS 1.176 WS 0.587 0.624 0.676 ρC 1.236 WC 0.617 0.656 0.711 ρT 1.180 WT 0.589 0.626 0.678 ρG 1.301 WG 0.649 0.690 0.748 ρJ 1.288 WJ 0.643 0.684 0.741 ρA 1.231 WA 0.614 0.653 0.708 ρ0 1.250 W0 0.624 0.663 0.719 崂山 ρS 1.217 WS 0.416 0.464 0.532 ρC 1.280 WC 0.438 0.488 0.560 ρT 1.139 WT 0.390 0.434 0.498 ρG 1.299 WG 0.444 0.495 0.568 ρJ 1.218 WJ 0.417 0.464 0.533 ρA 1.224 WA 0.419 0.467 0.535 ρ0 1.250 W0 0.428 0.476 0.547
下载: 导出CSV
-
[1] 吴春冰, 王京学, 冀晓东, 等. 空气密度时空统计特性及对基本风压的影响——以山东省为例[J]. 北京林业大学学报, 2021(5): 99-107. [2] 刘攀峰. 青海湖地区空气密度年变化分析[J]. 青海大学学报(自然科学版), 2010, 28(2): 14-15, 60. [3] 宋丽莉, 毛慧琴, 钱光明, 等. 热带气旋对风力发电的影响分析[J]. 太阳能学报, 2006, 27(9): 961-965. [4] 黄浩辉, 陈雯超, 植石群, 等. 基于测风塔实测台风威马逊登陆过程的强风特性分析[J]. 气象, 2021, 47(2): 143-156. [5] 柳艳香, 袁春红, 朱玲, 等. 近12年来影响风电场安全运行的气象灾害因子分布特征[J]. 风能, 2013(5): 70-74. [6] 高晓梅, 白莉娜, 郭蓉, 等. 台风"利奇马"北上锋生导致山东省创纪录暴雨天气学成因分析[J]. 热带气象学报, 2023, 39(2): 145-158. [7] 宋丽莉, 毛慧琴, 汤海燕, 等. 广东沿海近地层大风特性的观测分析[J]. 热带气象学报, 2004, 20(6): 731-736. [8] 洪畅, 胡超, 邓超, 等. 台风期间海上风电场空气密度研究[J]. 人民长江, 2020, 51(S2): 290-293+360. [9] 丁立国, 段莹, 罗宇翔. 贵州省分散式风电场空气密度计算方法研究[J]. 贵州气象, 2015, 39(1): 32-34. [10] GB 50009-2012建筑结构荷载规范[S]. [11] 杜燕军, 田涛, 车利军. 指数法在风电场空气密度模拟中的实际应用[J]. 电网与清洁能源, 2013, 29(07): 63-66. [12] 阎丽凤, 杨成芳. 山东省灾害性天气预报技术手册[M]. 北京: 气象出版社, 2014. [13] 朱义青, 刘淑鸿, 谢晓华, 等. 冷涡背景下山东南部一次弓形回波极端大风成因分析[J]. 热带气象学报, 2024, 40(5): 745-757. [14] Meng Z Y, Yan D C, Zhang Y J. General features of squall lines in East China[J]. Monthly Weather Review, 2013, 141(5): 1629-1647. [15] 孟凡昌, 李本霞, 王娟娟. 近73年影响我国的热带气旋时空演变特征及其归因分析[J]. 热带气象学报, 2025, 41(1): 75-84. [16] 文贤填, 肖永, 林呈辉, 等. 贵州高原山区空气密度对风电功率影响研究[J]. 中国电力, 2014, 47(7): 101-103. [17] 吕爱民, 杨柳妮, 黄彬, 等. 中国近海大风的天气学分型[J]. 海洋气象学报, 2018, 38(1): 43-50. [18] 陈政清, 华旭刚. 结构抗风减振理论与实践湖南大学风工程试验研究中心成立20年论文精选[M]. 长沙: 湖南大学出版社, 2024. [19] GB/T 28591—2012风力等级[S]. [20] QX/T 436-2018气候可行性论证规范抗风参数计算[S]. [21] 李丽, 王业斌, 鲁俊, 等. 1981-2020年安徽省不同重现期最大风速和极大风速时空变化特征[J]. 热带气象学报, 2022, 38(5): 662-670. [22] 阎凤霞, 李晓萌. 2002-2021年西北太平洋秋季台风特征分析[J]. 热带气象学报, 2025, 41(1): 1-15. [23] 张萍萍, 辛文鹏, 迟静, 等. 威海极端南北大风特征对比及天气分型研究[J]. 海洋预报, 2025, 42(3): 56-65. [24] 于慧珍, 马艳, 韩旭卿. 不同天气形势下山东半岛南部沿海大风特征及其成因[J]. 气象科技, 2023, 51(1): 94-103. [25] 董旭光, 邱粲, 李娟, 等. 1981-2016年山东陆地观测最大风速变化特征[J]. 海洋气象学报, 2018, 38(2): 87-95. [26] 赵宗慈, 罗勇, 江溁. 风电场对气候变化影响研究进展[J]. 气候变化研究进展, 2011, 7(6): 400-406. [27] Jung C, Schindler D. Global comparison of the goodness-of-fit of wind speed distributions[J]. Energy Conversion and Management, 2017, 133: 216-234. [28] Akgül F G, Şenoğlu B, Arslan T. An alternative distribution to Weibull for modeling the wind speed data: inverse Weibull distribution[J]. Energy Conversion and Management, 2016, 114: 234-240. [29] Kang D, Ko K, Huh J. Determination of extreme wind values using the Gumbel distribution[J]. Energy, 2015, 86: 51-58. [30] 董旭光, 高理, 邬铭法. 山东半岛阵风系数时空变化和基本风压特征[J]. 干旱气象, 2026, 44(2): 285-292. [31] 崔宜少, 闫景鹏, 李强. 山东半岛大风的统计与分析[J]. 山东气象, 2013, 33(1): 22-26. -

 点击查看大图
图(9) / 表(4)
计量
- 文章访问数: 198
- HTML全文浏览量: 0
- PDF下载量: 48
- 被引次数: 0
 粤公网安备 4401069904700003号
