



Wind Resource Assessment in Alxa Left Banner Based on Kilometer-scale Regional Atmospheric Reanalysis
-
摘要: 风资源的垂直结构与时空变化是高塔筒风电(核心可及高度50~300 m)选址定容与协同调度的关键依据, 但现有测风塔、卫星反演与全球再分析在垂直覆盖或分辨率上各有局限, 难以支撑从近地层到中高空的精细化评估。为此, 本文以内蒙古阿拉善左旗荒漠区为研究区, 将公里级区域大气再分析资料(EARS1km)与2025年全年L波段探空观测相结合, 系统评估了20~3000 m风速、风向与风切变的垂直结构及日、月、季节变化, 重点聚焦50~300 m风能开发关键层。结果表明:(1) EARS1km适用性良好, 与探空的风速、风向相关系数分别为0.89和0.78, 均方根误差(RMSE)分别为$ 2.85 \mathrm{~m} \cdot \mathrm{~s}^{-1} $和$ 39.40^{\circ} $, 性能随高度升高而改善, 冷季优于暖季。(2)年平均风速随高度呈"低层快速增长—中层趋缓—高空再增强"的多段式结构, 20、100、500 m风速分别为5.70、7.14、7.97 m ⋅ s-1, 风功率密度为239.8、461.1、$ 682.8 \mathrm{~W} \cdot \mathrm{~m}^{-2}; 20 \sim 200 \mathrm{~m} $风切变显著($ \alpha=0.11 \sim 0.15 $)为风速增益最集中区间, 200~500 m切变减弱并呈冬正夏负转换, 300~400 m为风能由增长转入饱和的过渡高度;风向以WNW(西北偏西)、NW(西北)和W(西)为主, 并随高度集中。(3)时间变化具有显著高度依赖性:风速峰值随高度由近地层的春季(20 m 4月最高)推移至200 m以上的11月前后、1000 m以上的冬季;20 m日变化呈清晨(06—08时)峰值, 与夜间稳定边界层动量再分配有关。综合风能"量"与"质", 50~300 m为该区高塔筒风电的核心开发层, 300~500 m为延伸潜力层, 1000 m以上亦具潜力;各高度强风期的系统性错位为多高度时序互补与协同开发提供了依据。Abstract: The vertical structure and spatiotemporal variability of wind resources are central to the siting, capacity configuration, and coordinated dispatch of tall-tower wind power (core hub-height range 50-300 m). However, conventional meteorological towers, satellite retrievals, and global reanalyses are each limited in vertical coverage or resolution, hindering fine-scale assessment from the near-surface to the mid-upper atmosphere. This study combines the kilometer-scale regional atmospheric reanalysis EARS1km with year-round L-band radiosonde observations from 2025 over the desert region of Alxa Left Banner, Inner Mongolia. We systematically evaluate the vertical structure and diurnal, monthly, and seasonal variations of wind speed, wind direction, and wind shear across 20-3000 m, with a focus on the 50-300 m layer critical for wind energy development. The main results are as follows. (1) EARS1km performs well against radiosonde observations, with correlation coefficients of 0.89 (wind speed) and 0.78 (wind direction) and RMSEs of $ 2.85 \mathrm{~m} \cdot \mathrm{~s}^{-1} $, and $ 39.40^{\circ} $, respectively. Its performance improves with height and is better in the cold season. (2) The annual mean wind speed increases with height in a multi-layer pattern: rapid growth in the lower-layer, a slowdown in the mid-layer, and renewed strengthening aloft, with values of 5.70, 7.14, and $ 7.97 \mathrm{~m} \cdot \mathrm{~s}^{-1} $ at 20, 100, and 500 m, respectively, corresponding to wind power densities of 239.8, 461.1, and $ 682.8 \mathrm{~W} \cdot \mathrm{~m}^{-2} $. Wind shear is pronounced within $ 20-200 \mathrm{~m}(\alpha=0.11-0.15) $, which is the layer of most concentrated wind speed gains, weakens within 200-500 m with a winter-positive/summer-negative reversal, and the 300-400 m layer marks the transition from growth to saturation. Wind directions are dominated by west-northwest (WNW), northwest (NW), and west (W) with directional concentration increasing with height. (3)The temporal variability is strongly height-dependent: the timing of peak wind speed shifts from spring near the surface (April maximum at 20 m) to autumn (around November) above 200 m and to winter above 1000 m, while the 20 m diurnal cycle peaks in the early morning (06: 00-08: 00 LT), associated with momentum redistribution in the stable nocturnal boundary layer. Considering both the quantity (wind power density) and quality (shear stability) of the resource, the 50-300 m layer is identified as the core layer for tall-tower wind power development over Alxa Left Banner, with 300-500 m as an extended-potential layer, and above 1000 m holding further potential. The systematic vertical offset in peak-wind timing provides a basis for temporal complementarity and coordinated multi-height wind farm development.
-

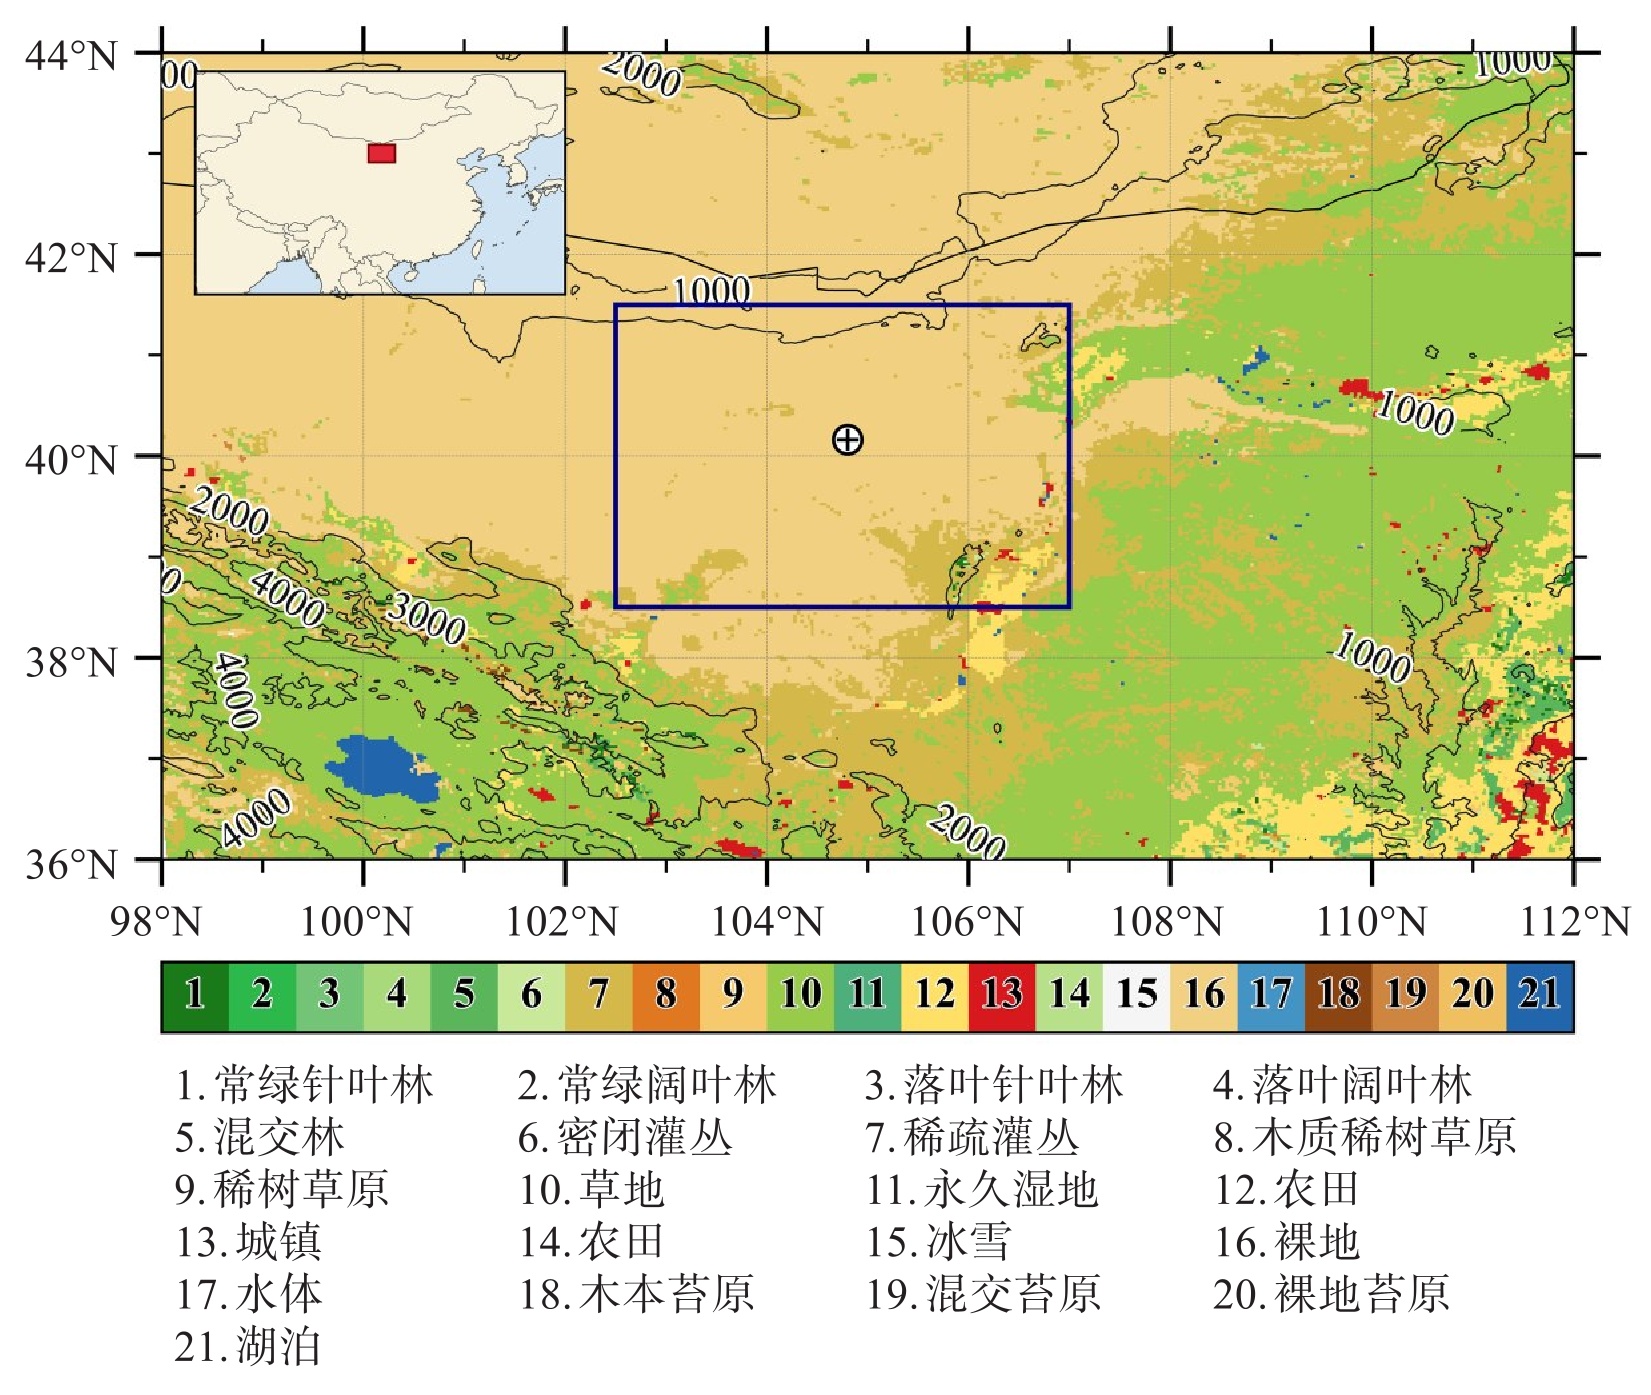
图 1 研究区土地利用类型与地形(基于MODIS IGBP 21类分类, 填色)图
黑色等值线为地形(1000~4000 m);蓝色框为重点研究区;带"+"的白色圆为探空站;下方为分类图例。

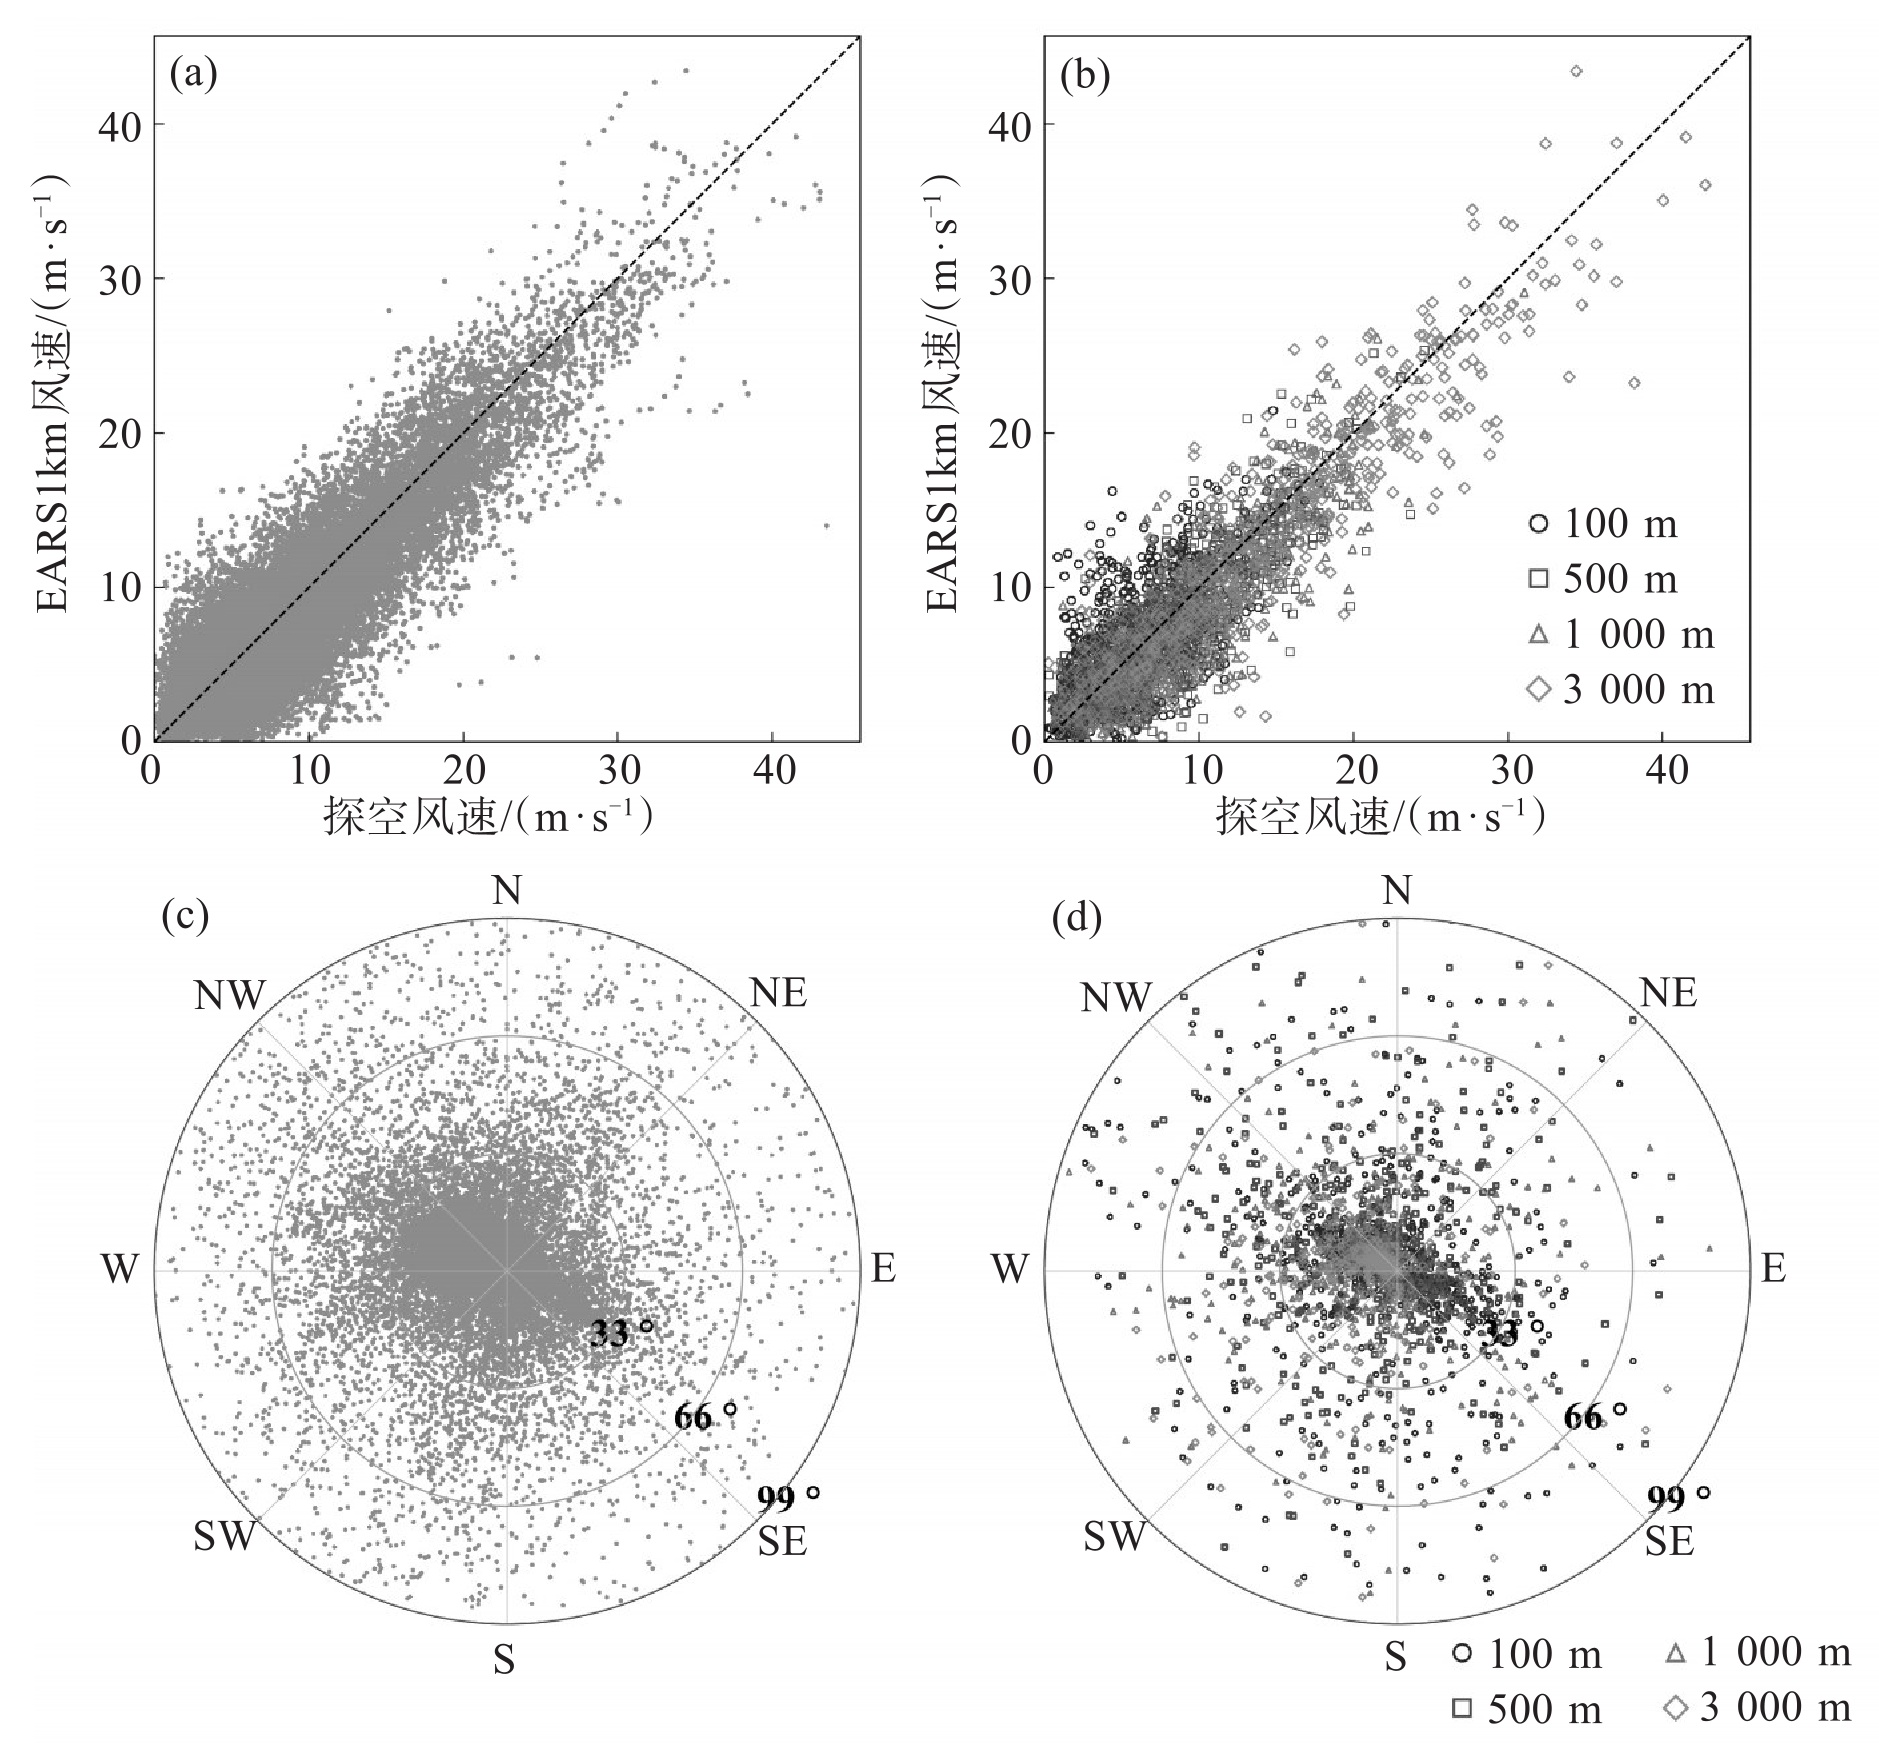
图 2 EARS1km风场与探空风速、风向的整体对比
a.所有高度层风速散点图, 横轴与纵轴分别为探空风速和EARS 1 km风速(单位:m ⋅ s-1);b.典型高度层(100、500、1000和3000 m AGL)风速散点对比;c.所有高度层风向偏差极坐标图, 角度表示探空风向(正北为上, 顺时针), 径向距离表示EARS1km与探空风向的圆形绝对偏差 $ \Delta i $(单位:°), 灰色同心圆依次对应33°、66°和99°;d.典型高度层风向偏差极坐标对比。

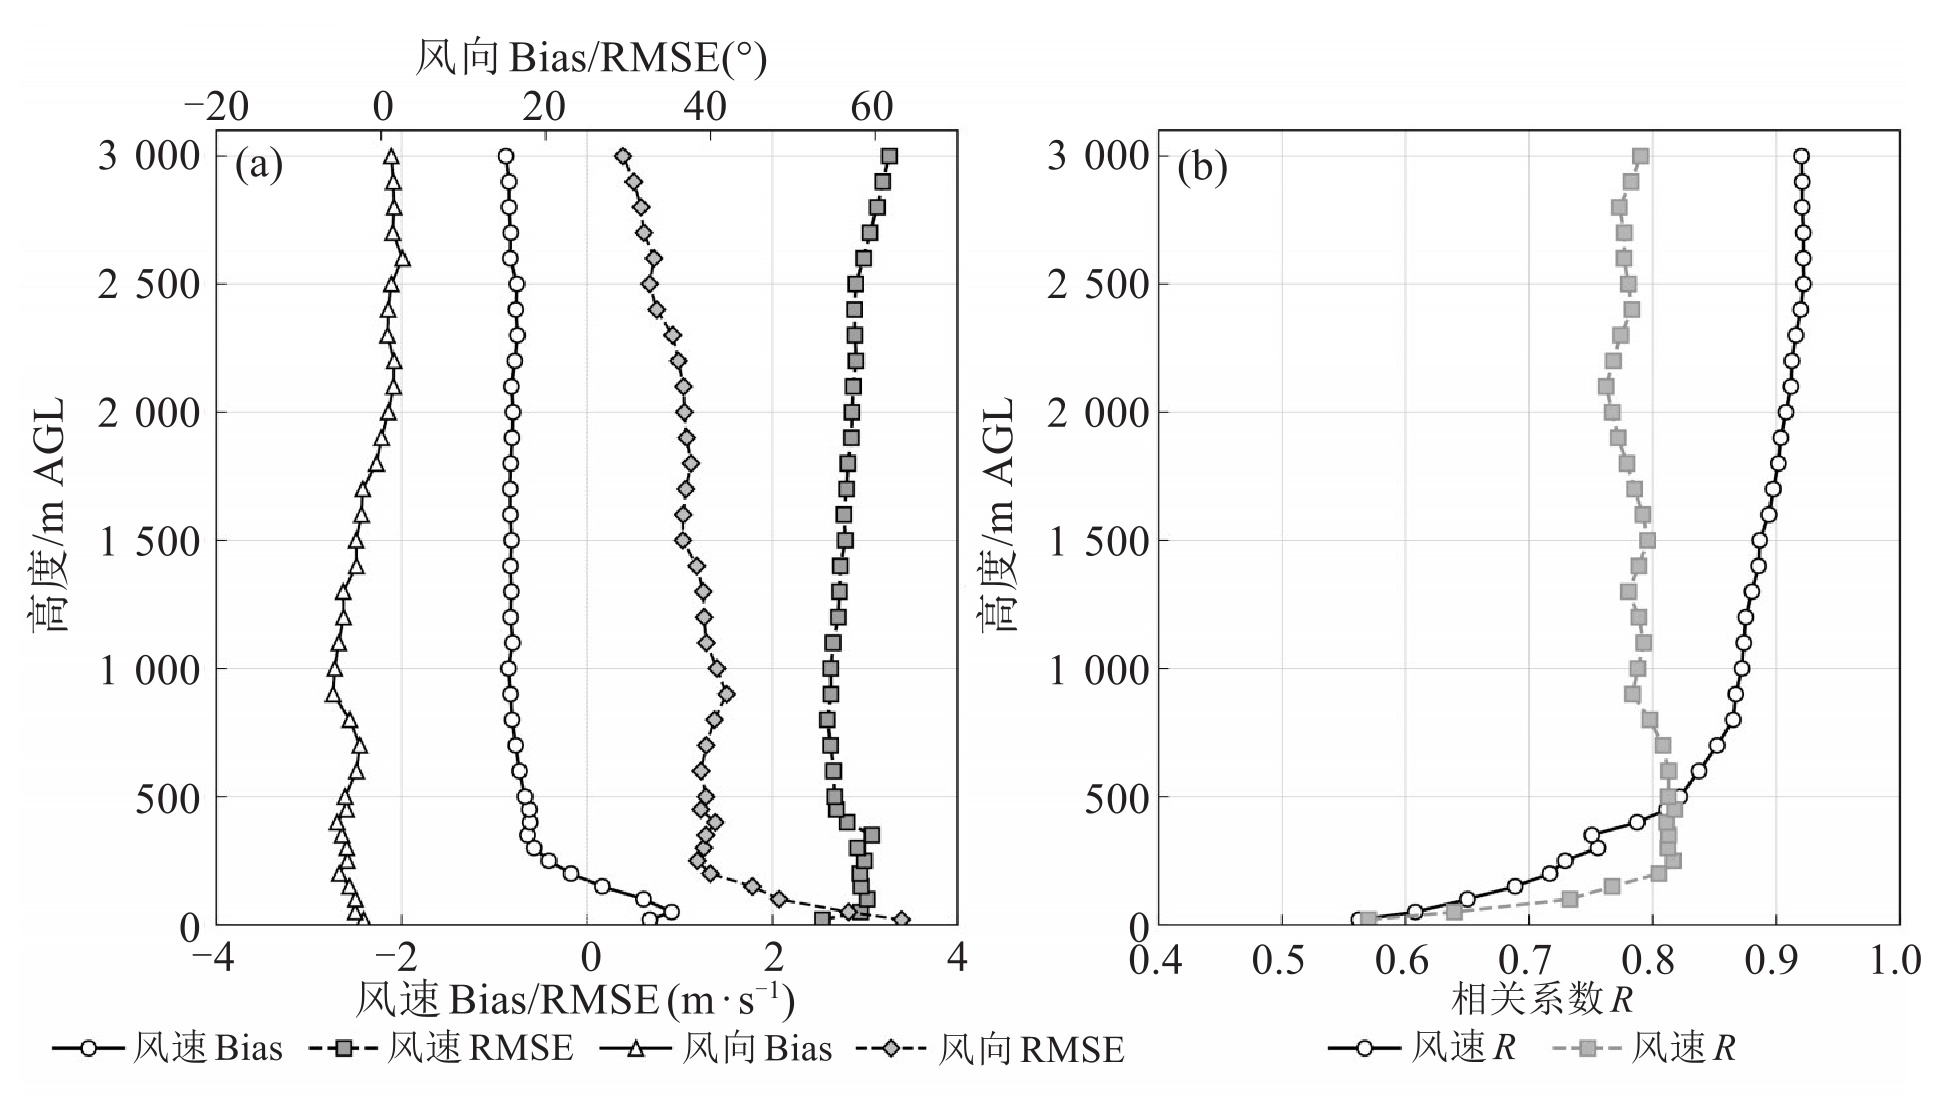
图 3 EARS 1 km风场验证误差的垂直廓线(0~3000 m AGL)
a.风速偏差(Bias)和均方根误差(RMSE)随高度的分布(左x轴, 单位:m ⋅ s-1), 叠加风向Bias和RMSE的垂直廓线(右x轴, 单位:°), 实心圆—实线与正方形—虚线分别表示Bias和RMSE;b.风速和风向相关系数 R的垂直廓线, R值范围为0.4~1.0。

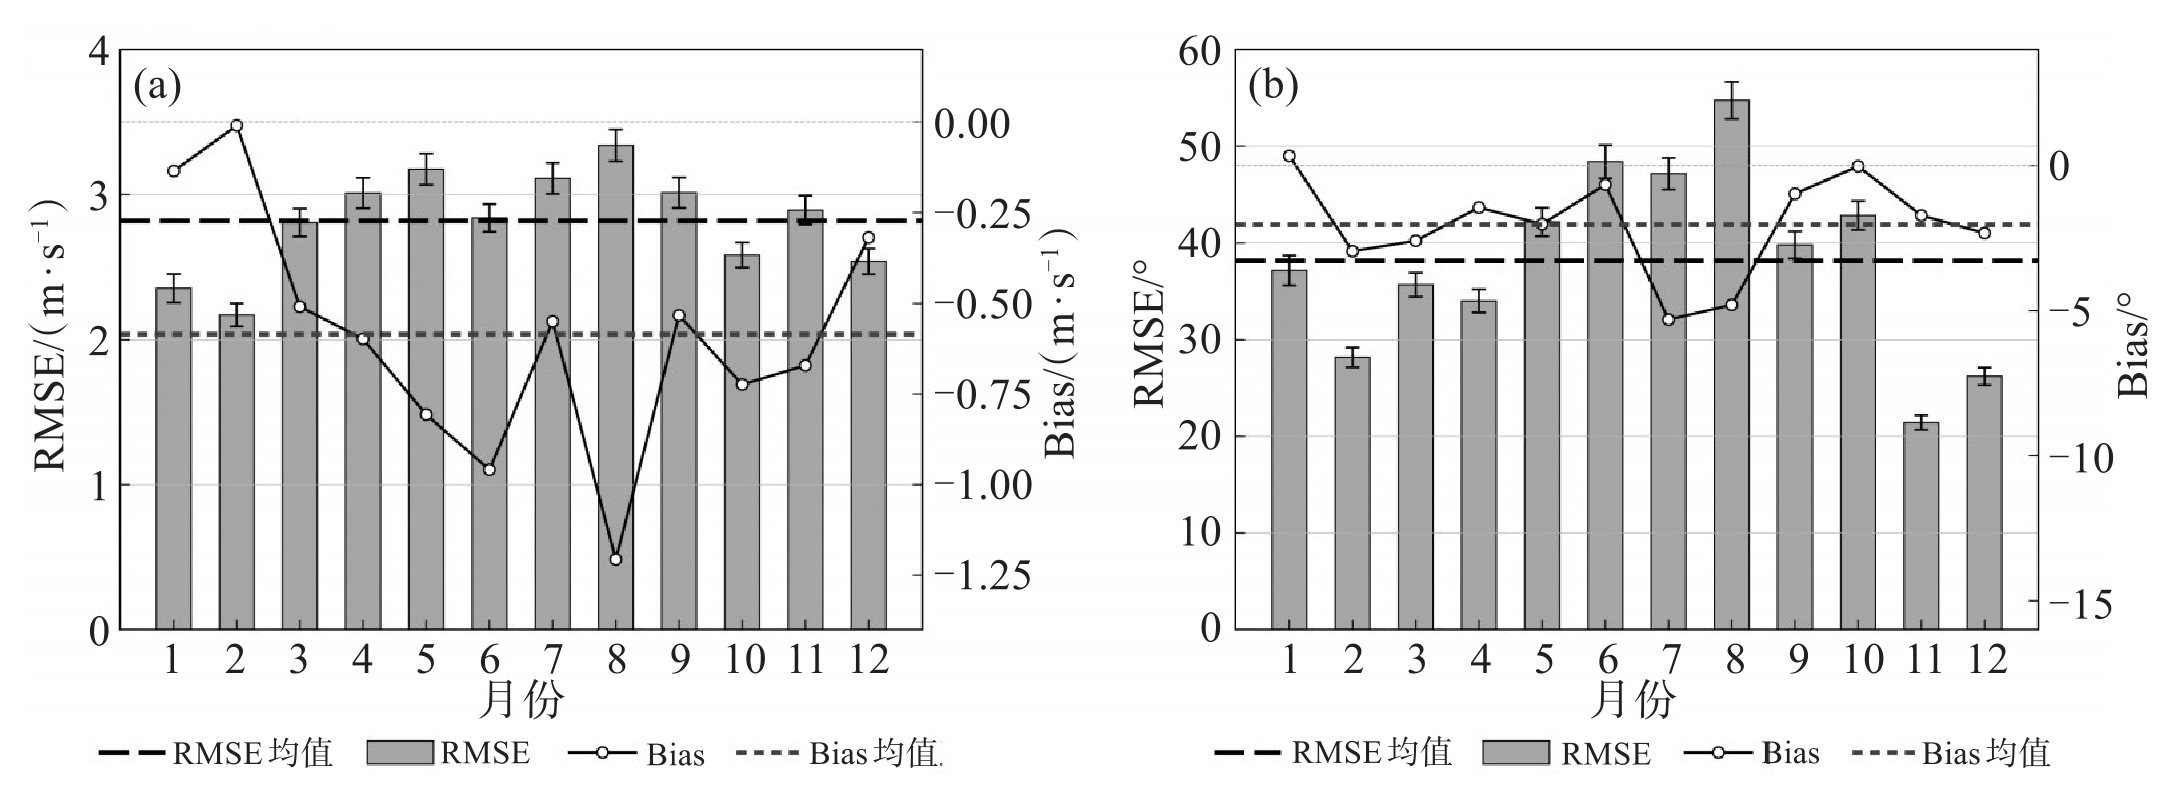
图 4 EARS1km风场逐月模拟性能
a.风速逐月均方根误差(灰色柱, 误差棒为95%置信区间)及逐月偏差(黑色实线带空心圆, 对应右纵轴), 点线分别为RMSE和Bias的年均值参考线;b.风向逐月RMSE(灰色柱, 误差棒同前)及逐月Bias(黑色实线带空心圆, 对应右纵轴), 点线为对应年均值参考线。横轴为2025年月份(1—12月)。

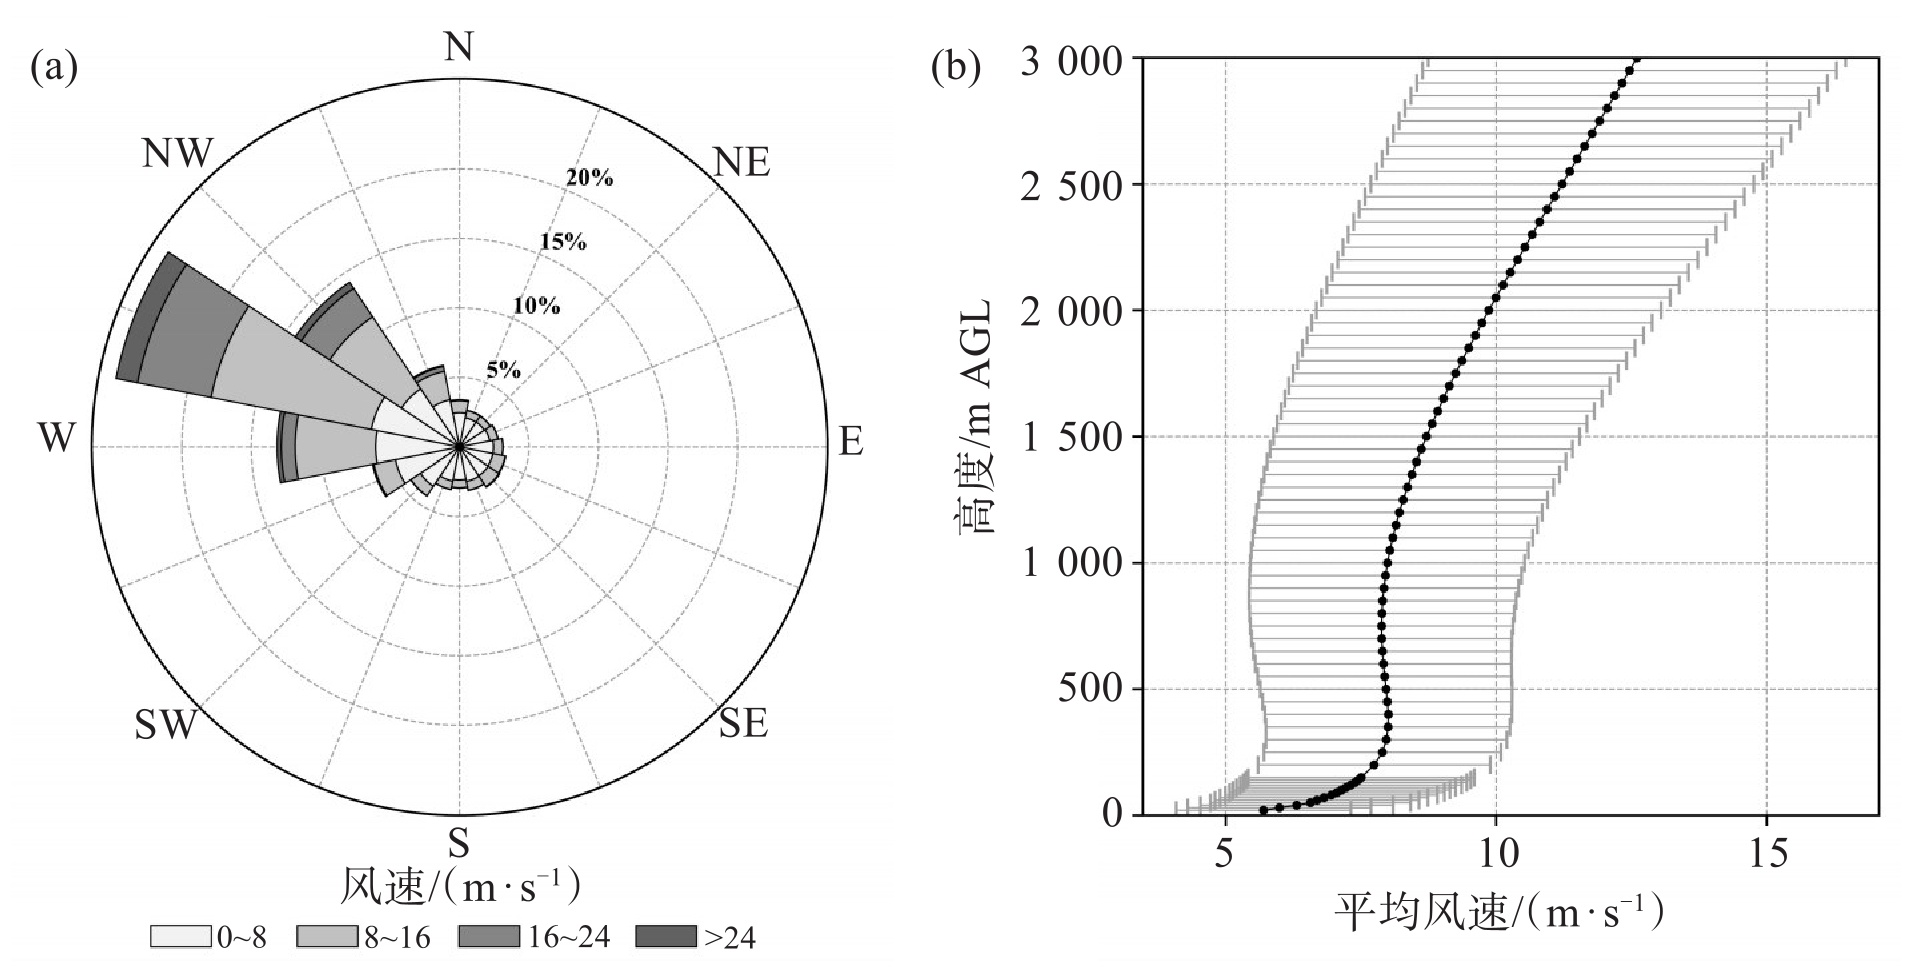
图 5 研究区0~3 000 m高度层EARS1km风场的统计特征
a. $ 0 \sim 3000 \mathrm{~m} $综合风向玫瑰图, 径向坐标表示各方向出现频率(单位:%), 16个方位角方向按顺时针排列, 填色深浅由浅至深依次对应风速区间 $ 0 \sim 8、8 \sim 16、16 \sim 24 $及 $ >24 \mathrm{~m} \cdot \mathrm{~s}^{-1}; ~ \mathrm{~b} $。平均风速垂直廓线, 横轴为各高度层平均风速(单位:$ \mathrm{m} \cdot \mathrm{s}^{-1} $), 纵轴为离地高度(单位:m), 圆点为各层均值, 水平误差棒表示0.5倍标准差。

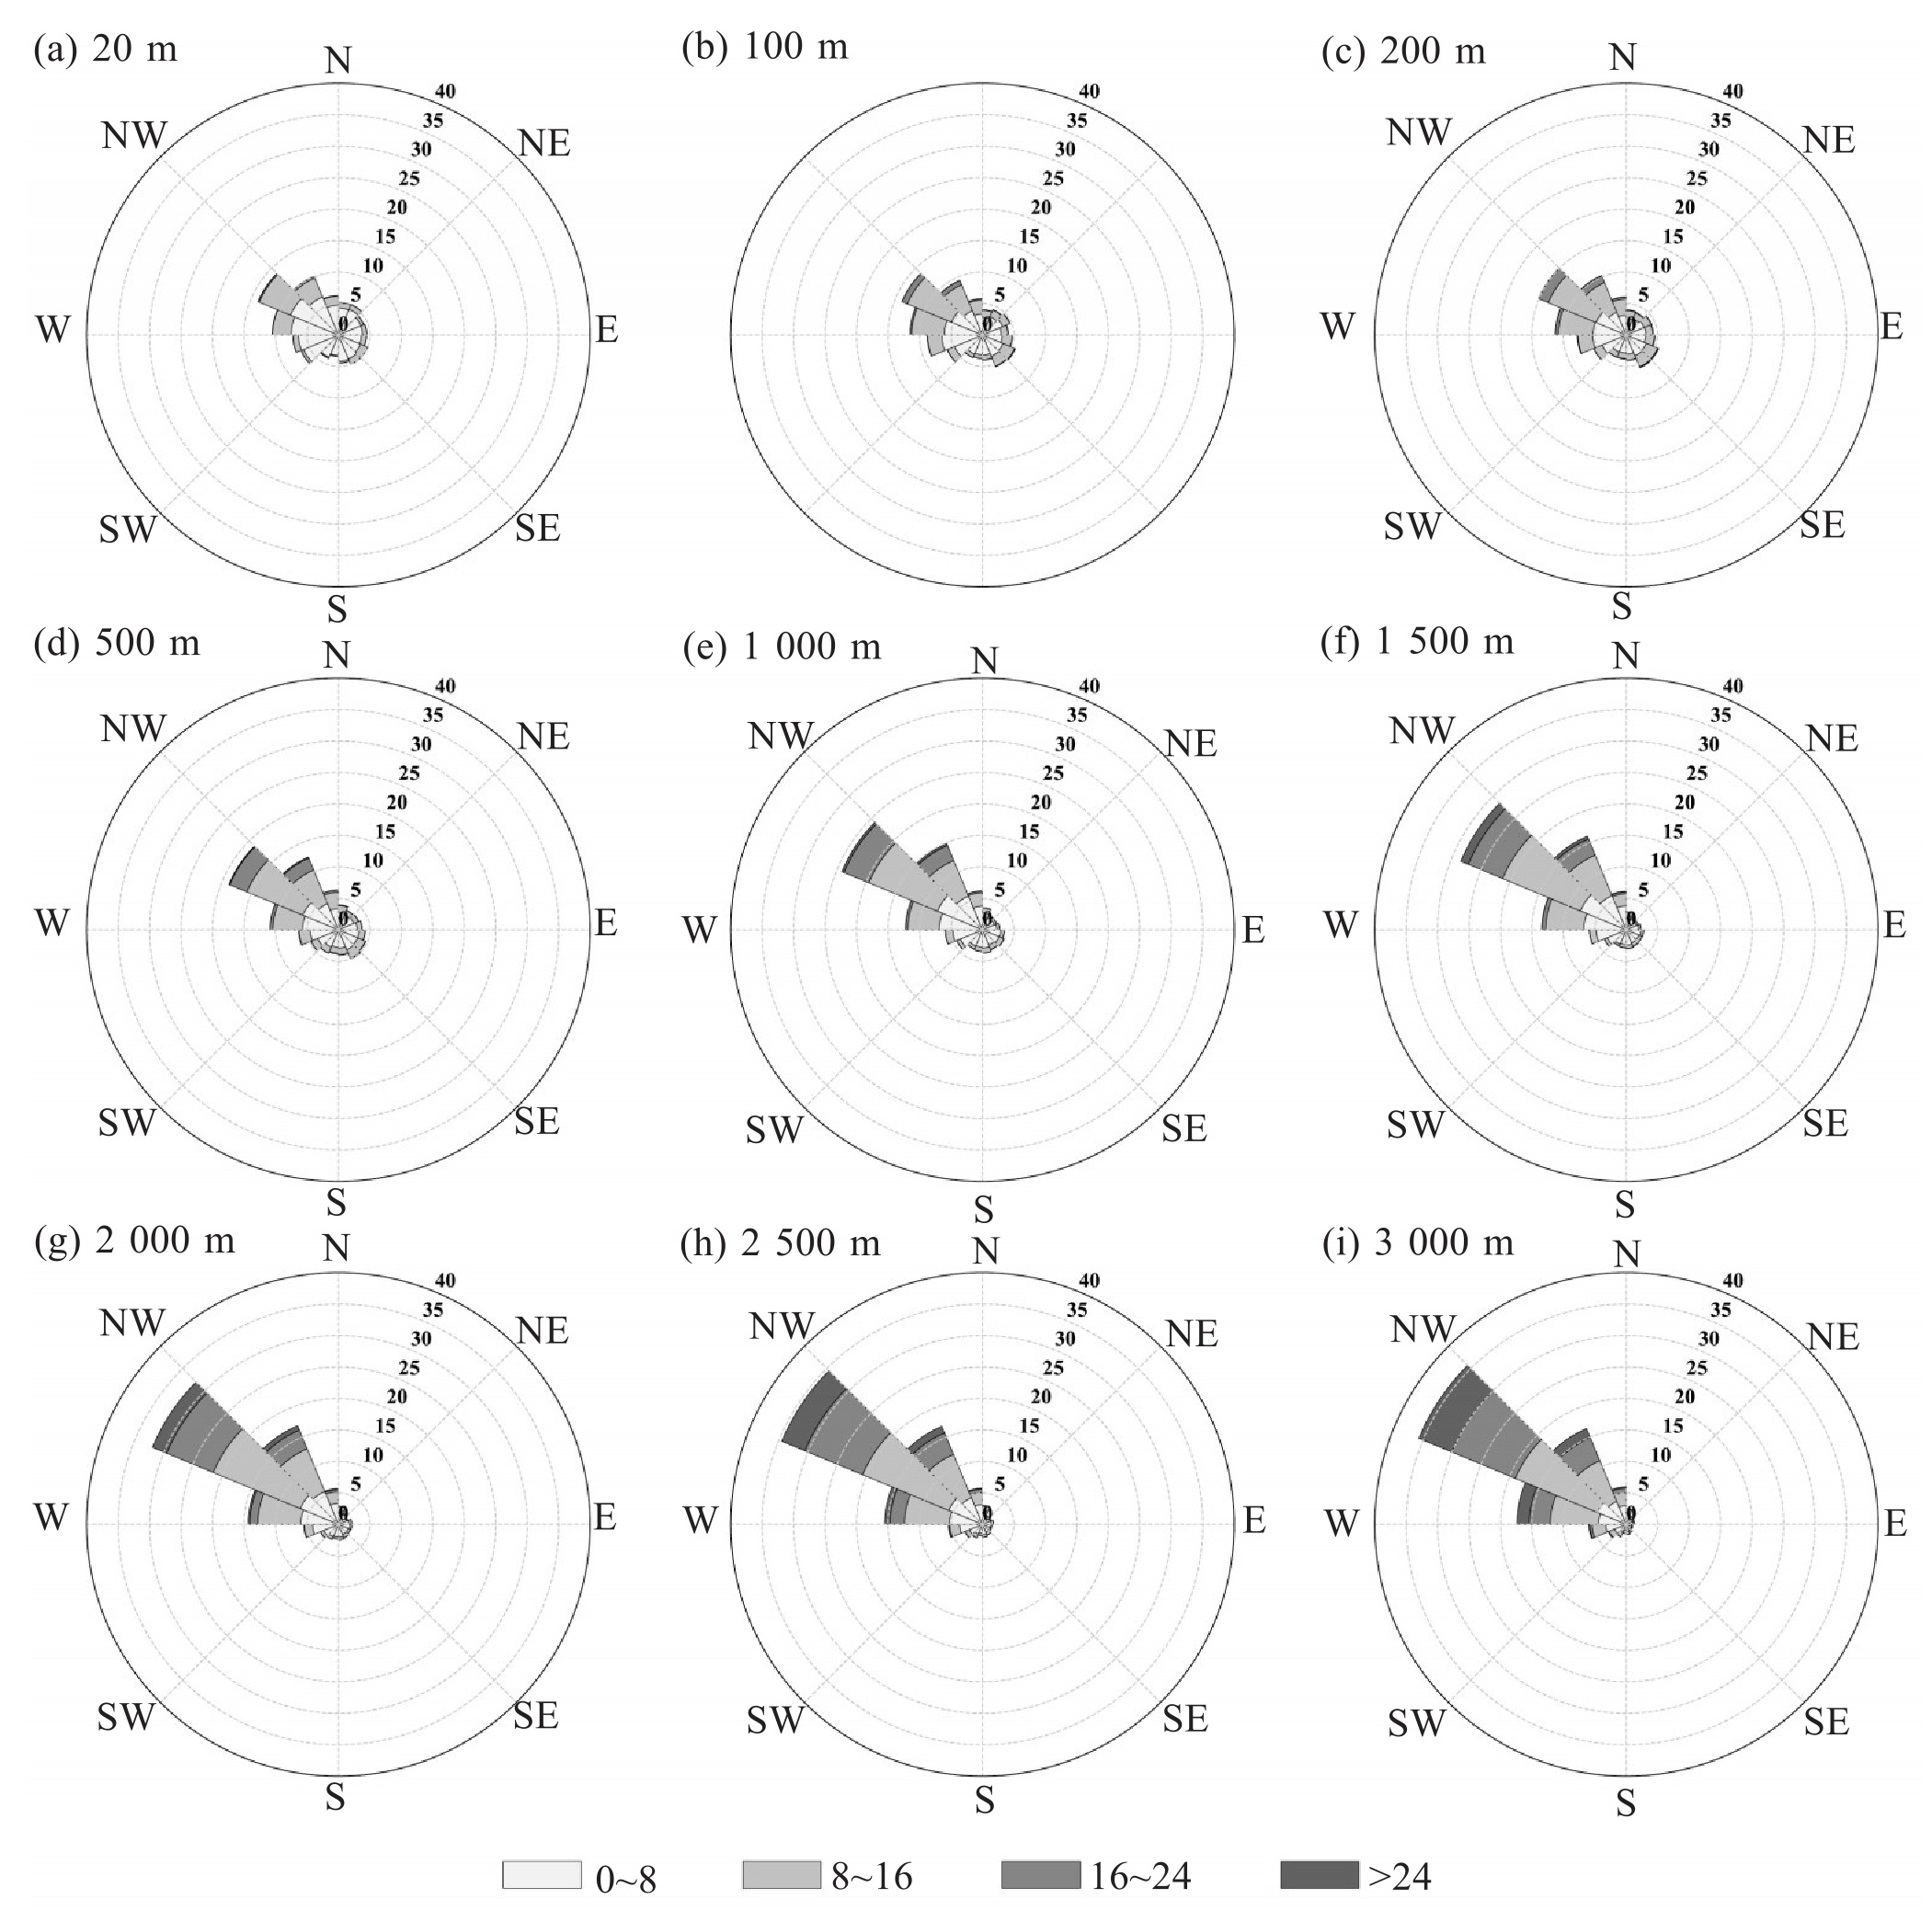
图 6 研究区各典型高度层风向玫瑰图
$ \mathrm{a} \sim \mathrm{i} $分别对应离地高度 $ 20、100、200、500、1000、1500、2000、2500 $和3000 m, 各子图径向坐标表示该高度层内各风向扇区出现的频率(单位:%), 16个方位角扇区按顺时针等间隔排列, 每扇区宽度为22.5°, 堆叠填色由浅至深依次对应风速区间0~8、8~16、16~24及 $ >24 \mathrm{~m} \cdot \mathrm{~s}^{-1} $。

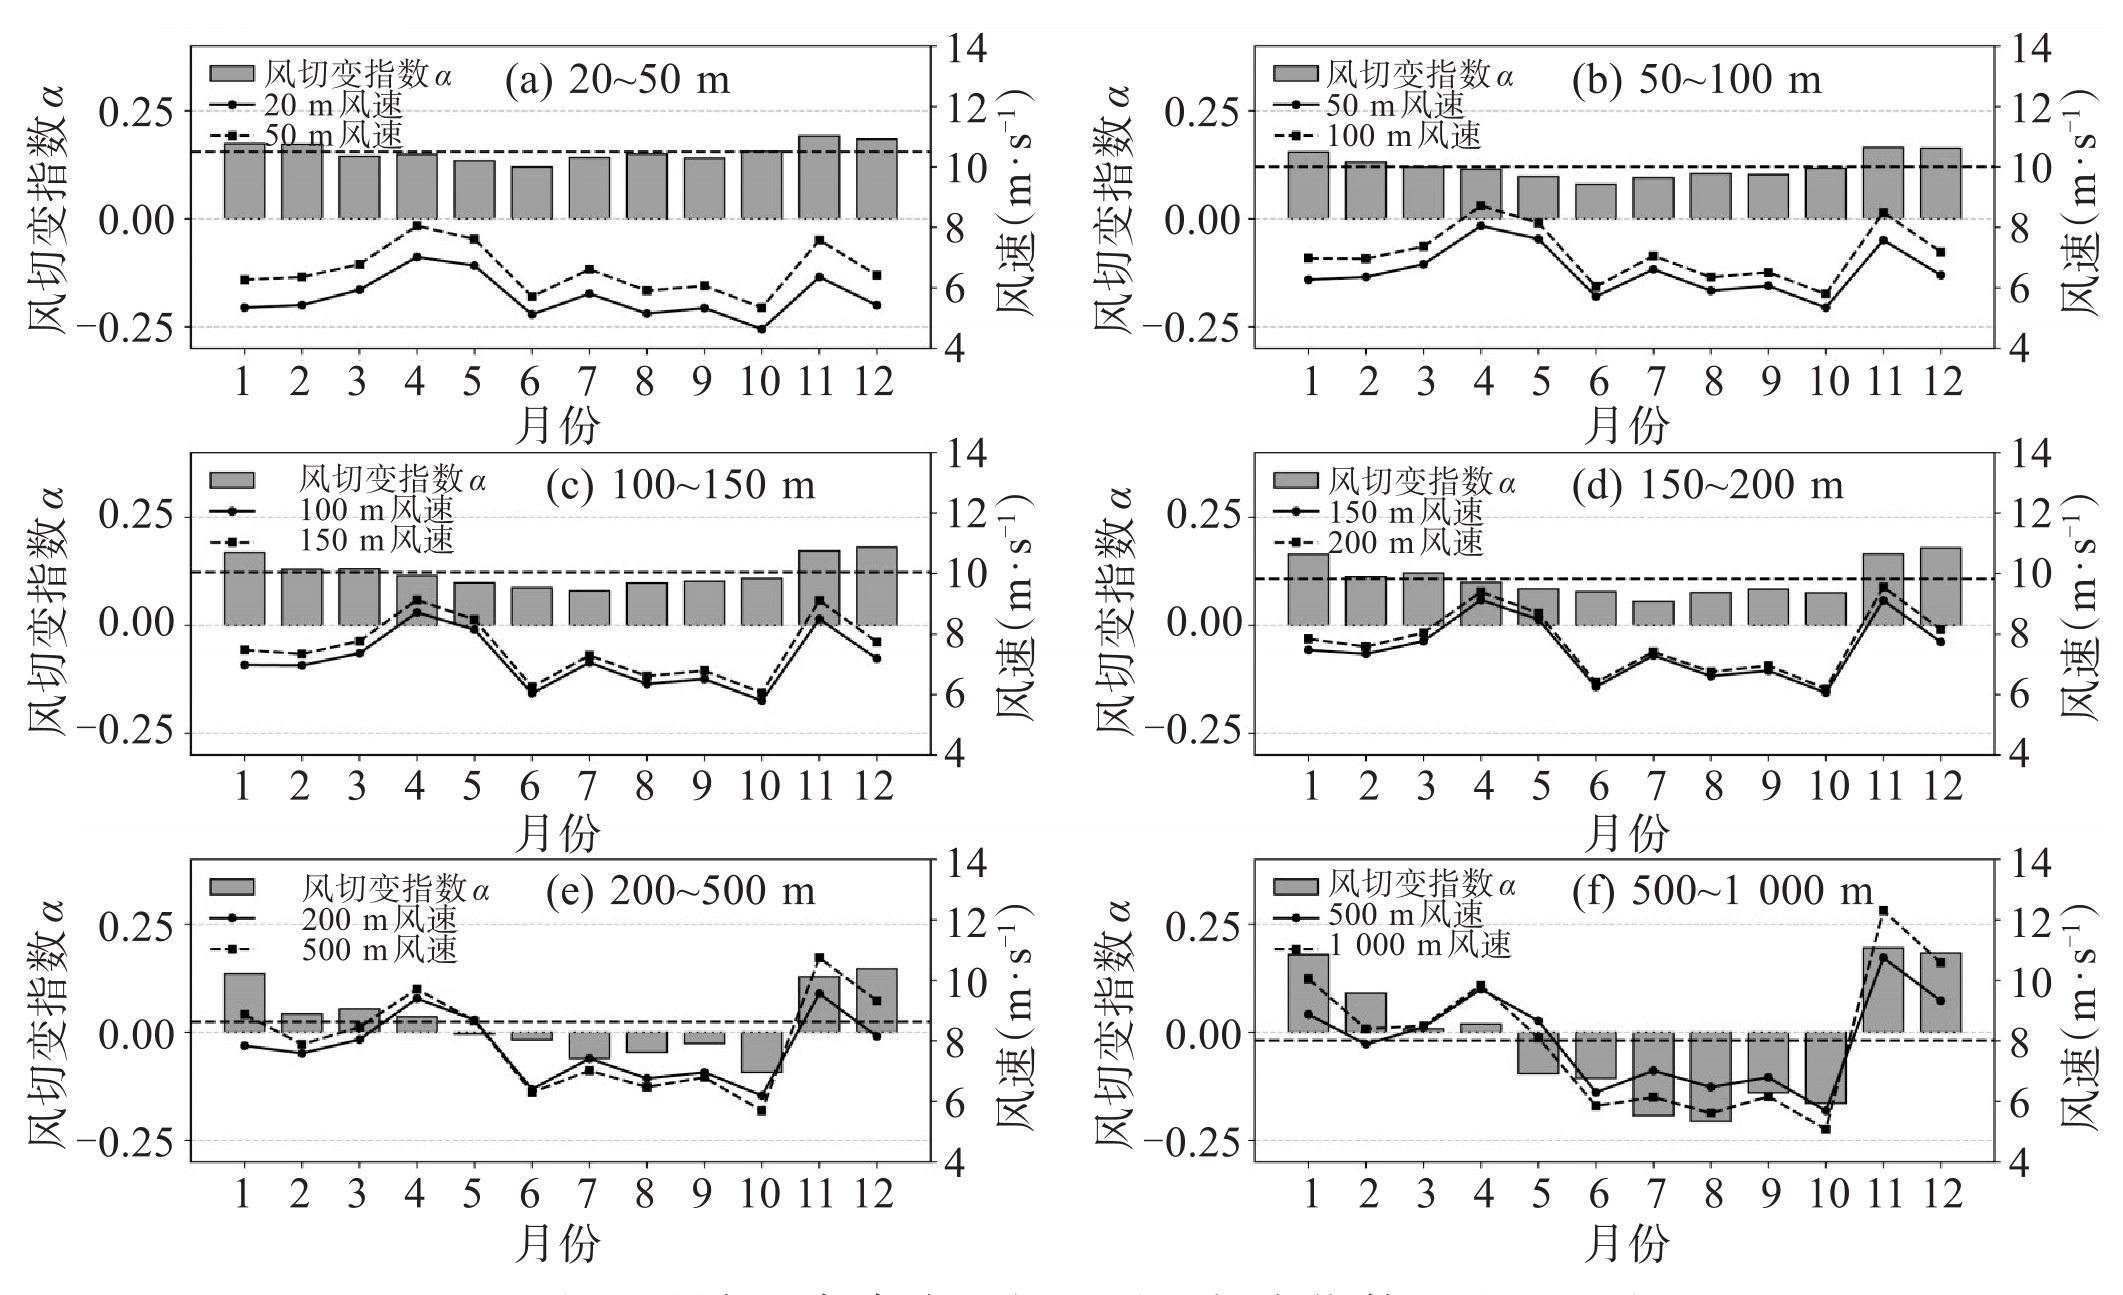
图 7 研究区各高度区间逐月风切变指数及边界风速
$ \mathrm{a} \sim \mathrm{f} $分别对应20~50、50~100、100~150、150~200、200~500和500~1 000m共6个高度区间, 灰色柱状表示逐月风切变指数 α(对应左纵轴), 黑色水平虚线为各区间 α年均值;右纵轴折线分别示意该区间下边界(实线带圆点)和上边界(虚线带方点)的逐月平均风速(单位:$ \mathrm{m} \cdot \mathrm{s}^{-1} $)。

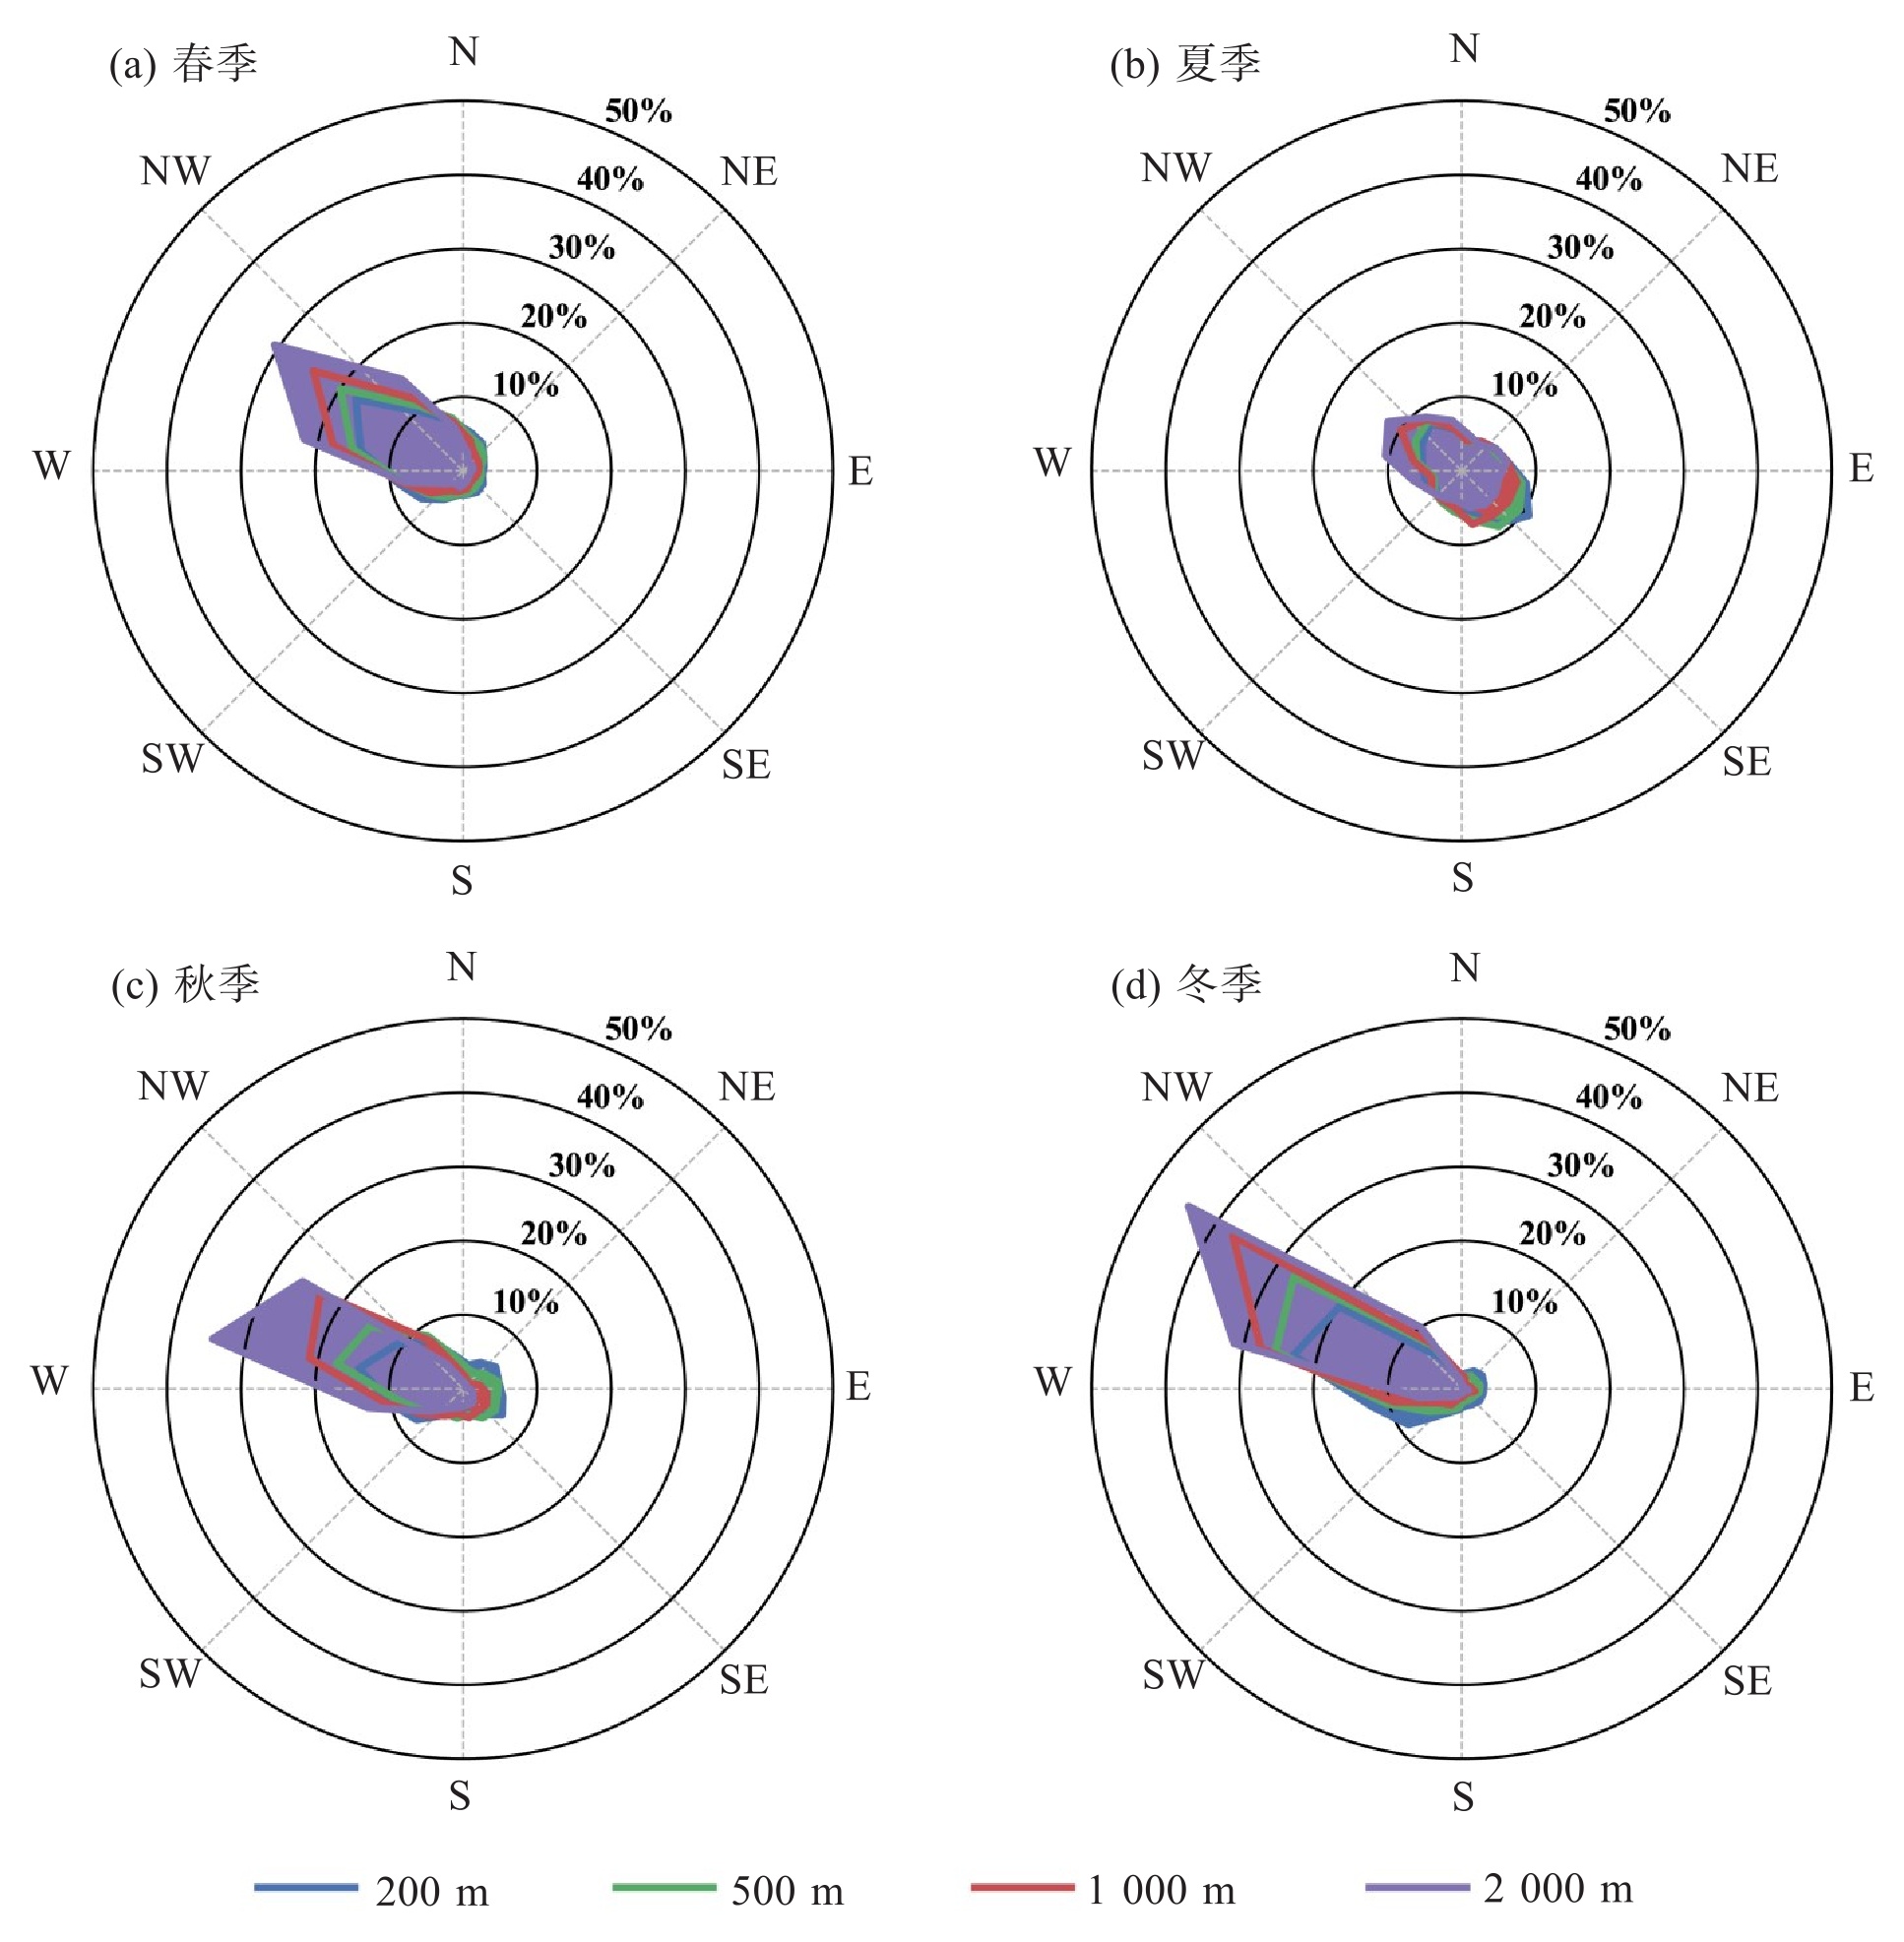
图 8 研究区各季节、各高度层风向玫瑰图
a~d分别对应春、夏、秋、冬四季, 图例不同颜色对应不同高度层;各子图径向坐标表示风向频率(单位:%), 16个方位扇区顺时针排列, 堆叠填色由浅至深对应风速区间 $ 0 \sim 8、8 \sim 16、16 \sim 24 $及 $ >24 \mathrm{~m} \cdot \mathrm{~s}^{-1} $。

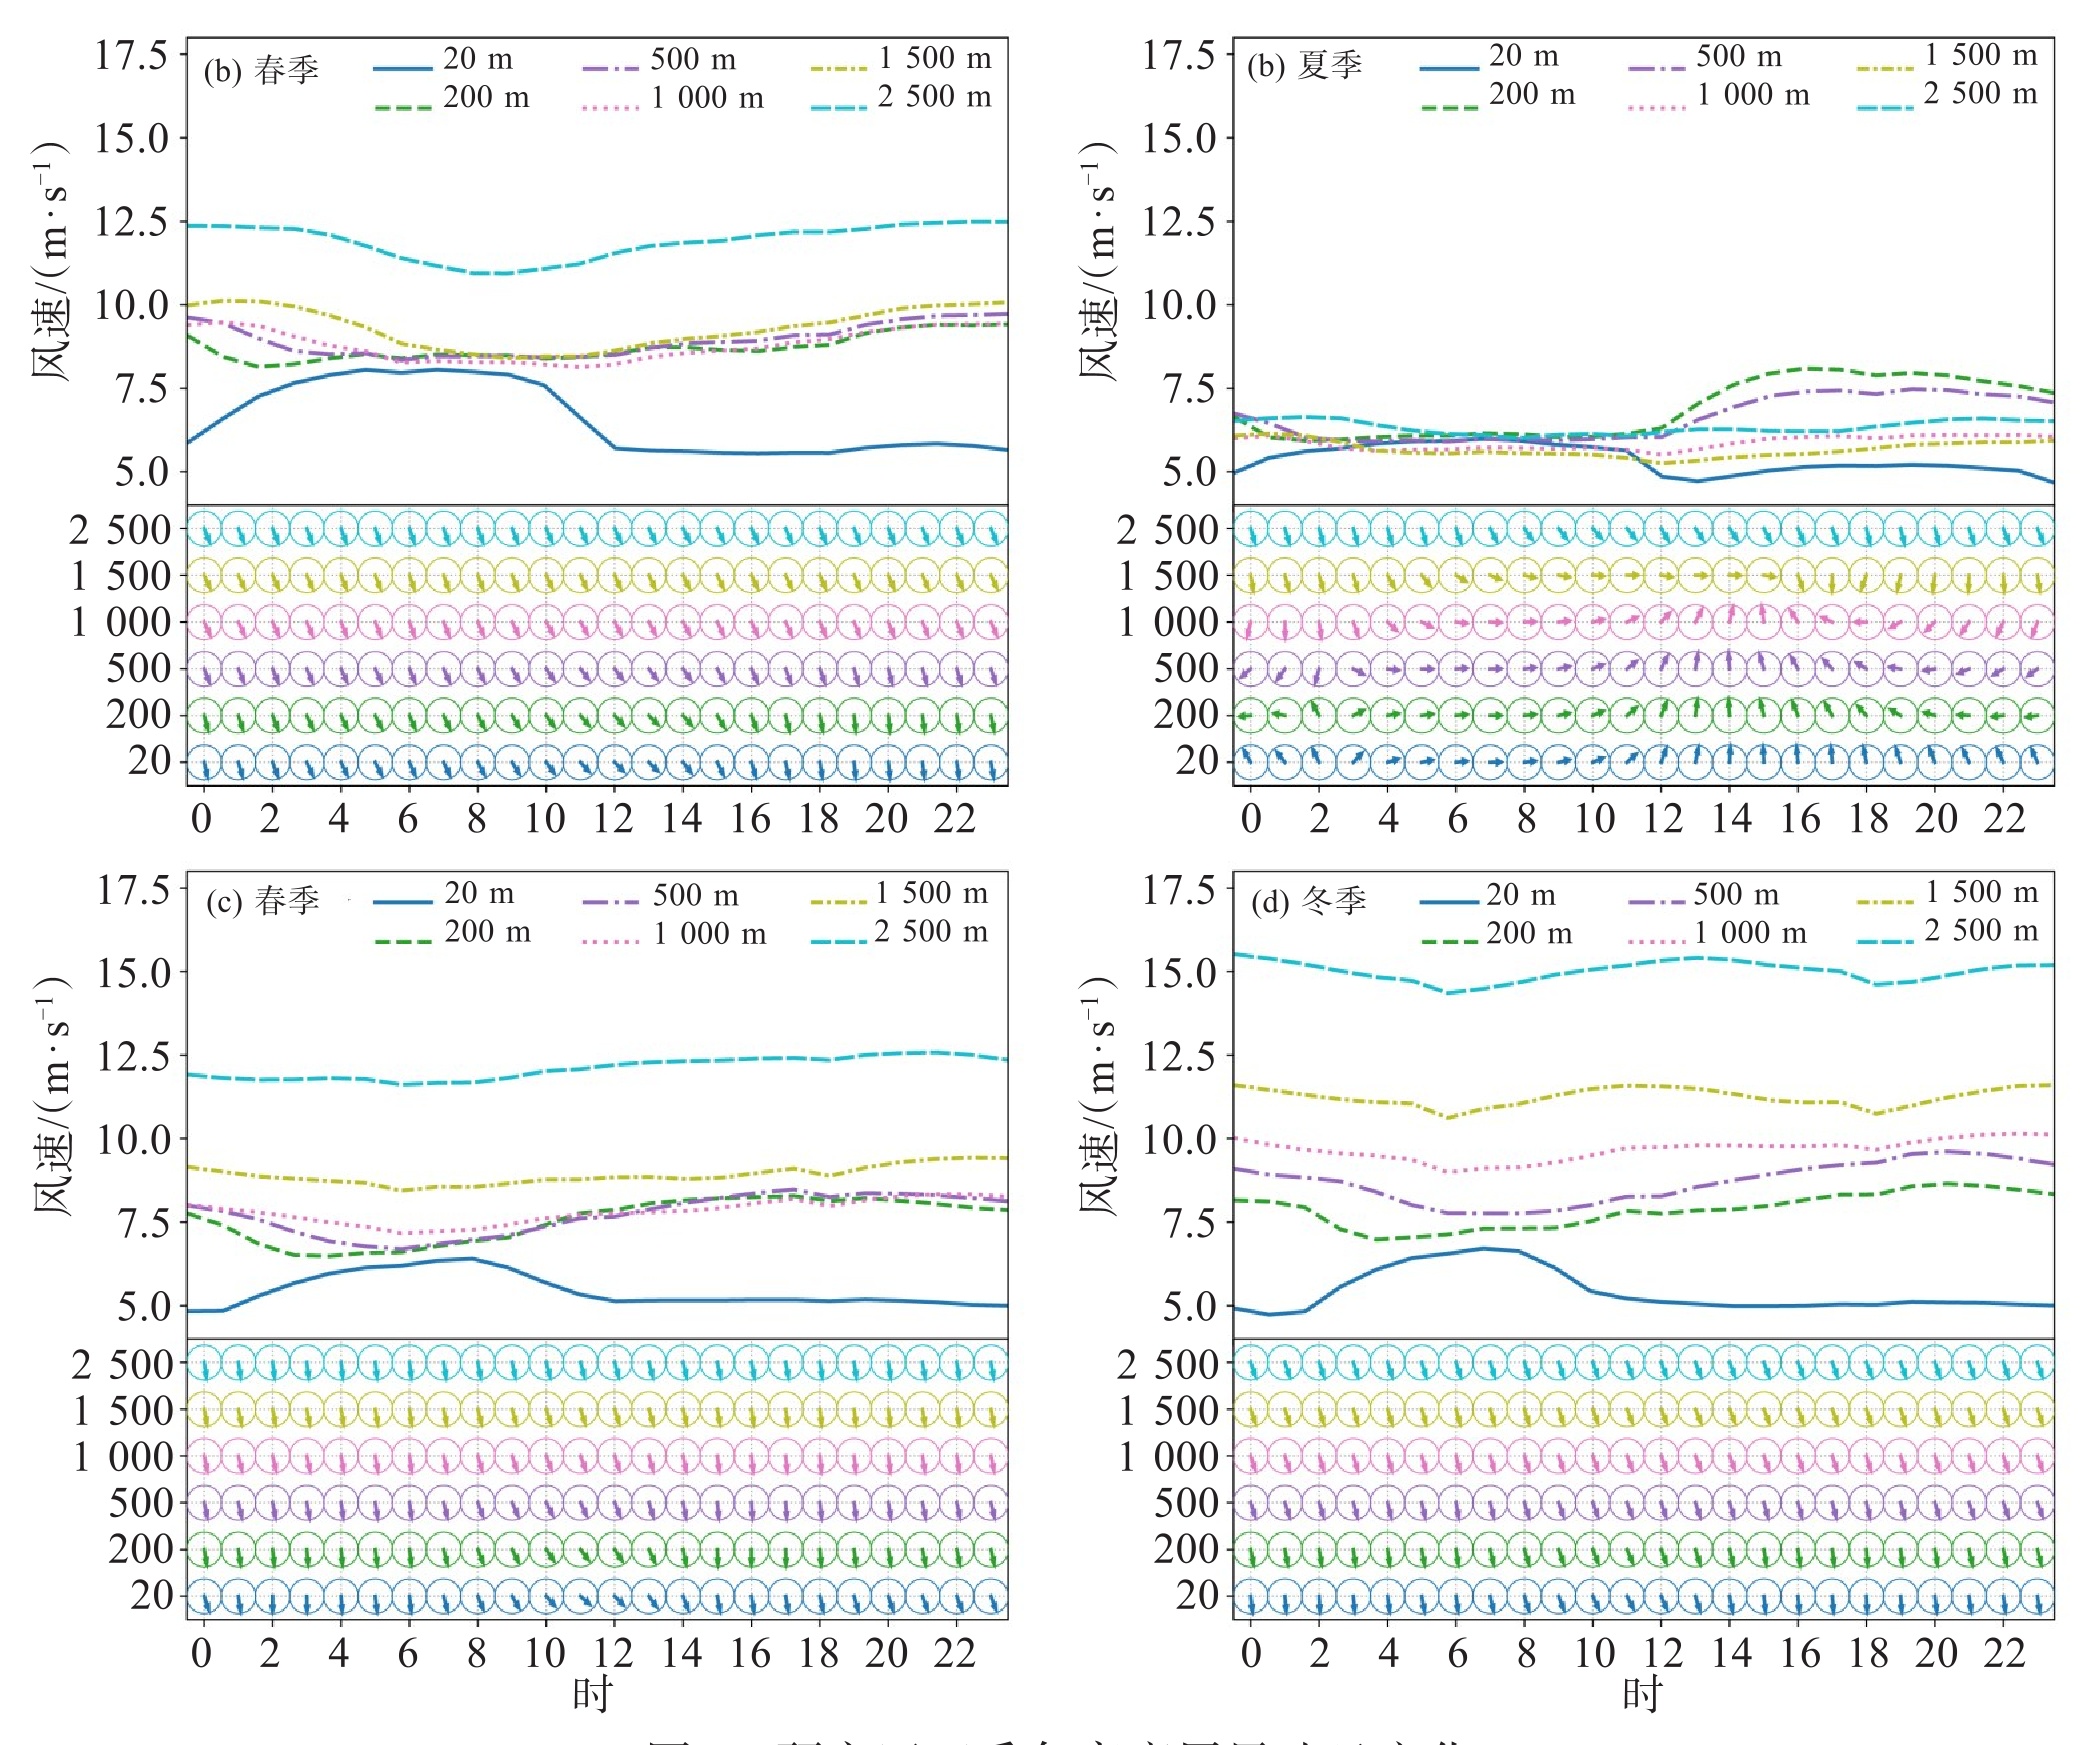
图 9 研究区四季各高度层风速日变化
a~d分别对应春、夏、秋、冬四季, 各子图横轴为地方时(0—23时), 纵轴为离地高度(m), 填色表示该季节、该高度层、该时刻的多年平均风速(单位:$ \mathrm{m} \cdot \mathrm{s}^{-1} $);叠加箭头示意对应的平均风向。
表 1 20~500 m各高度层年平均风速、有效风速及风功率密度
高度/m 平均风速$/\left(\mathrm{m} \cdot \mathrm{s}^{-1}\right) $ 有效风速$ V_{\text {eff}}/\left(\mathrm{m} \cdot \mathrm{s}^{-1}\right) $ WPD $/\left(\mathrm{W} \cdot \mathrm{m}^{-2}\right) $ 相对20 m增幅 $ \geqslant 3 \mathrm{~m} \cdot \mathrm{~s}^{-1} $频率 $ \geqslant 5 \mathrm{~m} \cdot \mathrm{~s}^{-1} $频率 $ \geqslant 10 \mathrm{~m} \cdot \mathrm{~s}^{-1} $频率 20 5.7 7.32 239.8 0 78.7% 53.4% 10% 50 6.57 8.37 359.7 15.2% 82.1% 61.8% 17.7% 100 7.14 9.1 461.1 25.2% 84.8% 65.8% 22.7% 150 7.5 9.54 531.9 31.7% 86.7% 68.5% 25.5% 200 7.74 9.83 582.7 35.9% 87.8% 70.2% 27.1% 300 7.97 10.16 643 39.8% 88.5% 71.4% 28.7% 400 8.01 10.31 670.5 40.5% 88.3% 71.1% 28.9% 500 7.97 10.37 682.8 39.8% 87.8% 70.1% 28.5%  下载: 导出CSV
表 2 20~500 m各高度层主导风向及频率
高度 第1主导风向 第2主导风向 第3主导风向 第4主导风向 第5主导风向 20 m WNW(13.8%) W(10.5%) NW(10.1%) WSW(7.2%) SW(6.4%) 50 m WNW(13.7%) W(11.5%) NW(9.4%) WSW(8.5%) SW(6.3%) 100 m WNW(13.8%) W(11.5%) NW(9.4%) WSW(8.8%) SW(6.1%) 150 m WNW(14.4%) W(11.4%) NW(9.8%) WSW(8.2%) NNW(5.9%) 200 m WNW(15.1%) W(11.3%) NW(10.2%) WSW(7.8%) NNW(6.1%) 300 m WNW(16.3%) NW(11.1%) W(11.1%) WSW(7.0%) NNW(6.2%) 400 m WNW(17.7%) NW(11.8%) W(10.8%) WSW(6.6%) NNW(6.4%) 500 m WNW(18.8%) NW(12.5%) W(10.8%) NNW(6.3%) WSW(6.3%)
下载: 导出CSV
表 3 20~500 m各高度区间风切变指数与风功率密度边界
高度区间 α(年均) α(1月) α(7月) $ \Delta \mathrm{WS}/\left(\mathrm{m} \cdot \mathrm{s}^{-1}\right) $ WPD下边界/$ \left(\mathrm{W} \cdot \mathrm{m}^{-2}\right) $ WPD上边界/$ \left(\mathrm{W} \cdot \mathrm{m}^{-2}\right) $ 开发评价 20~50 m 0.154 0.174 0.142 0.87 240 360 强正切变 50~100 m 0.12 0.154 0.095 0.57 360 461 强正切变 100~150 m 0.124 0.169 0.08 0.37 461 532 强正切变 $ 150 \sim 200 \mathrm{~m} $ 0.109 0.165 0.056 0.24 532 583 中正切变 200~300 m 0.071 0.153 -0.006 0.23 583 643 弱正切变 $ 300 \sim 400 \mathrm{~m} $ 0.016 0.123 -0.076 0.04 643 671 接近零切变 400~500 m -0.023 0.12 -0.140 -0.04 671 683 负切变
下载: 导出CSV
-
[1] Li M Y, Shen Y B, Yao J F, et al. An assessment of observed wind speed and wind power density over China for 1980-2021[J]. Wind Energy, 2022, 25(12): 2052-2070. [2] Zhou S H, Yang Y J, Gao Z Q, et al. Estimating vertical wind power density using tower observation and empirical models over varied desert steppe terrain in northern China[J]. Atmospheric Measurement Techniques, 2022, 15(3): 757-773. [3] Jung C, Schindler D. The role of the power law exponent in wind energy assessment: a global analysis[J]. International Journal of Energy Research, 2021, 45(6): 8484-8496. [4] Gualtieri G. A comprehensive review on wind resource extrapolation models applied in wind energy[J]. Renewable and Sustainable Energy Reviews, 2019, 102: 215-233. [5] 龚玺, 朱蓉, 范广洲, 等. 内蒙古草原近地层垂直风速廓线的观测研究[J]. 气象学报, 2014, 72(4): 711-722. [6] Hersbach H, Bell B, Berrisford P, et al. The ERA5 global reanalysis[J]. Quarterly Journal of the Royal Meteorological Society, 2020, 146(730): 1999-2049. [7] Sheridan L M, Krishnamurthy R, García Medina G, et al. Offshore reanalysis wind speed assessment across the wind turbine rotor layer off the United States Pacific coast[J]. Wind Energy Science, 2022, 7(5): 2059-2084. [8] Carvalho D, Rocha A, Gómez-Gesteira M, et al. WRF wind simulation and wind energy production estimates forced by different reanalyses: comparison with observed data for Portugal[J]. Applied Energy, 2014, 117: 116-126. [9] Guo J P, Miao Y C, Zhang Y, et al. The climatology of planetary boundary layer height in China derived from radiosonde and reanalysis data[J]. Atmospheric Chemistry and Physics, 2016, 16(20): 13309-13319. [10] Wang J, Chen L, Li S L. Characteristics of spring Mongolian cyclones in the recent 70 years: background circulations and weather influences[J]. International Journal of Climatology, 2024, 44(1): 328-343. [11] Liu F, Sun F B, Liu W B, et al. On wind speed pattern and energy potential in China[J]. Applied Energy, 2019, 236: 867-876. [12] Yang X R, Jiang X, Liang S J, et al. Spatiotemporal variation of power law exponent on the use of wind energy[J]. Applied Energy, 2024, 356: 122441. [13] Gong X, Zhu R, Chen L S. Characteristics of near surface winds over different underlying surfaces in China: implications for wind power development[J]. Journal of Meteorological Research, 2019, 33(2): 349-362. [14] Blackadar A K. Boundary layer wind maxima and their significance for the growth of nocturnal inversions[J]. Bulletin of the American Meteorological Society, 1957, 38(5): 283-290. [15] Banta R M. Stable-boundary-layer regimes from the perspective of the low-level jet[J]. Acta Geophysica, 2008, 56(1): 58-87. [16] Banta R M, Pichugina Y L, Brewer W A. Turbulent velocity-variance profiles in the stable boundary layer generated by a nocturnal low-level jet[J]. Journal of the Atmospheric Sciences, 2006, 63(11): 2700-2719. -

 点击查看大图
计量
- 文章访问数: 72
- HTML全文浏览量: 1
- PDF下载量: 31
- 被引次数: 0
 粤公网安备 4401069904700003号
