


Quantitative Analysis of Water Vapor Sources for Rainstorm Days in Beijing During Warm Seasons of 2009-2013
-
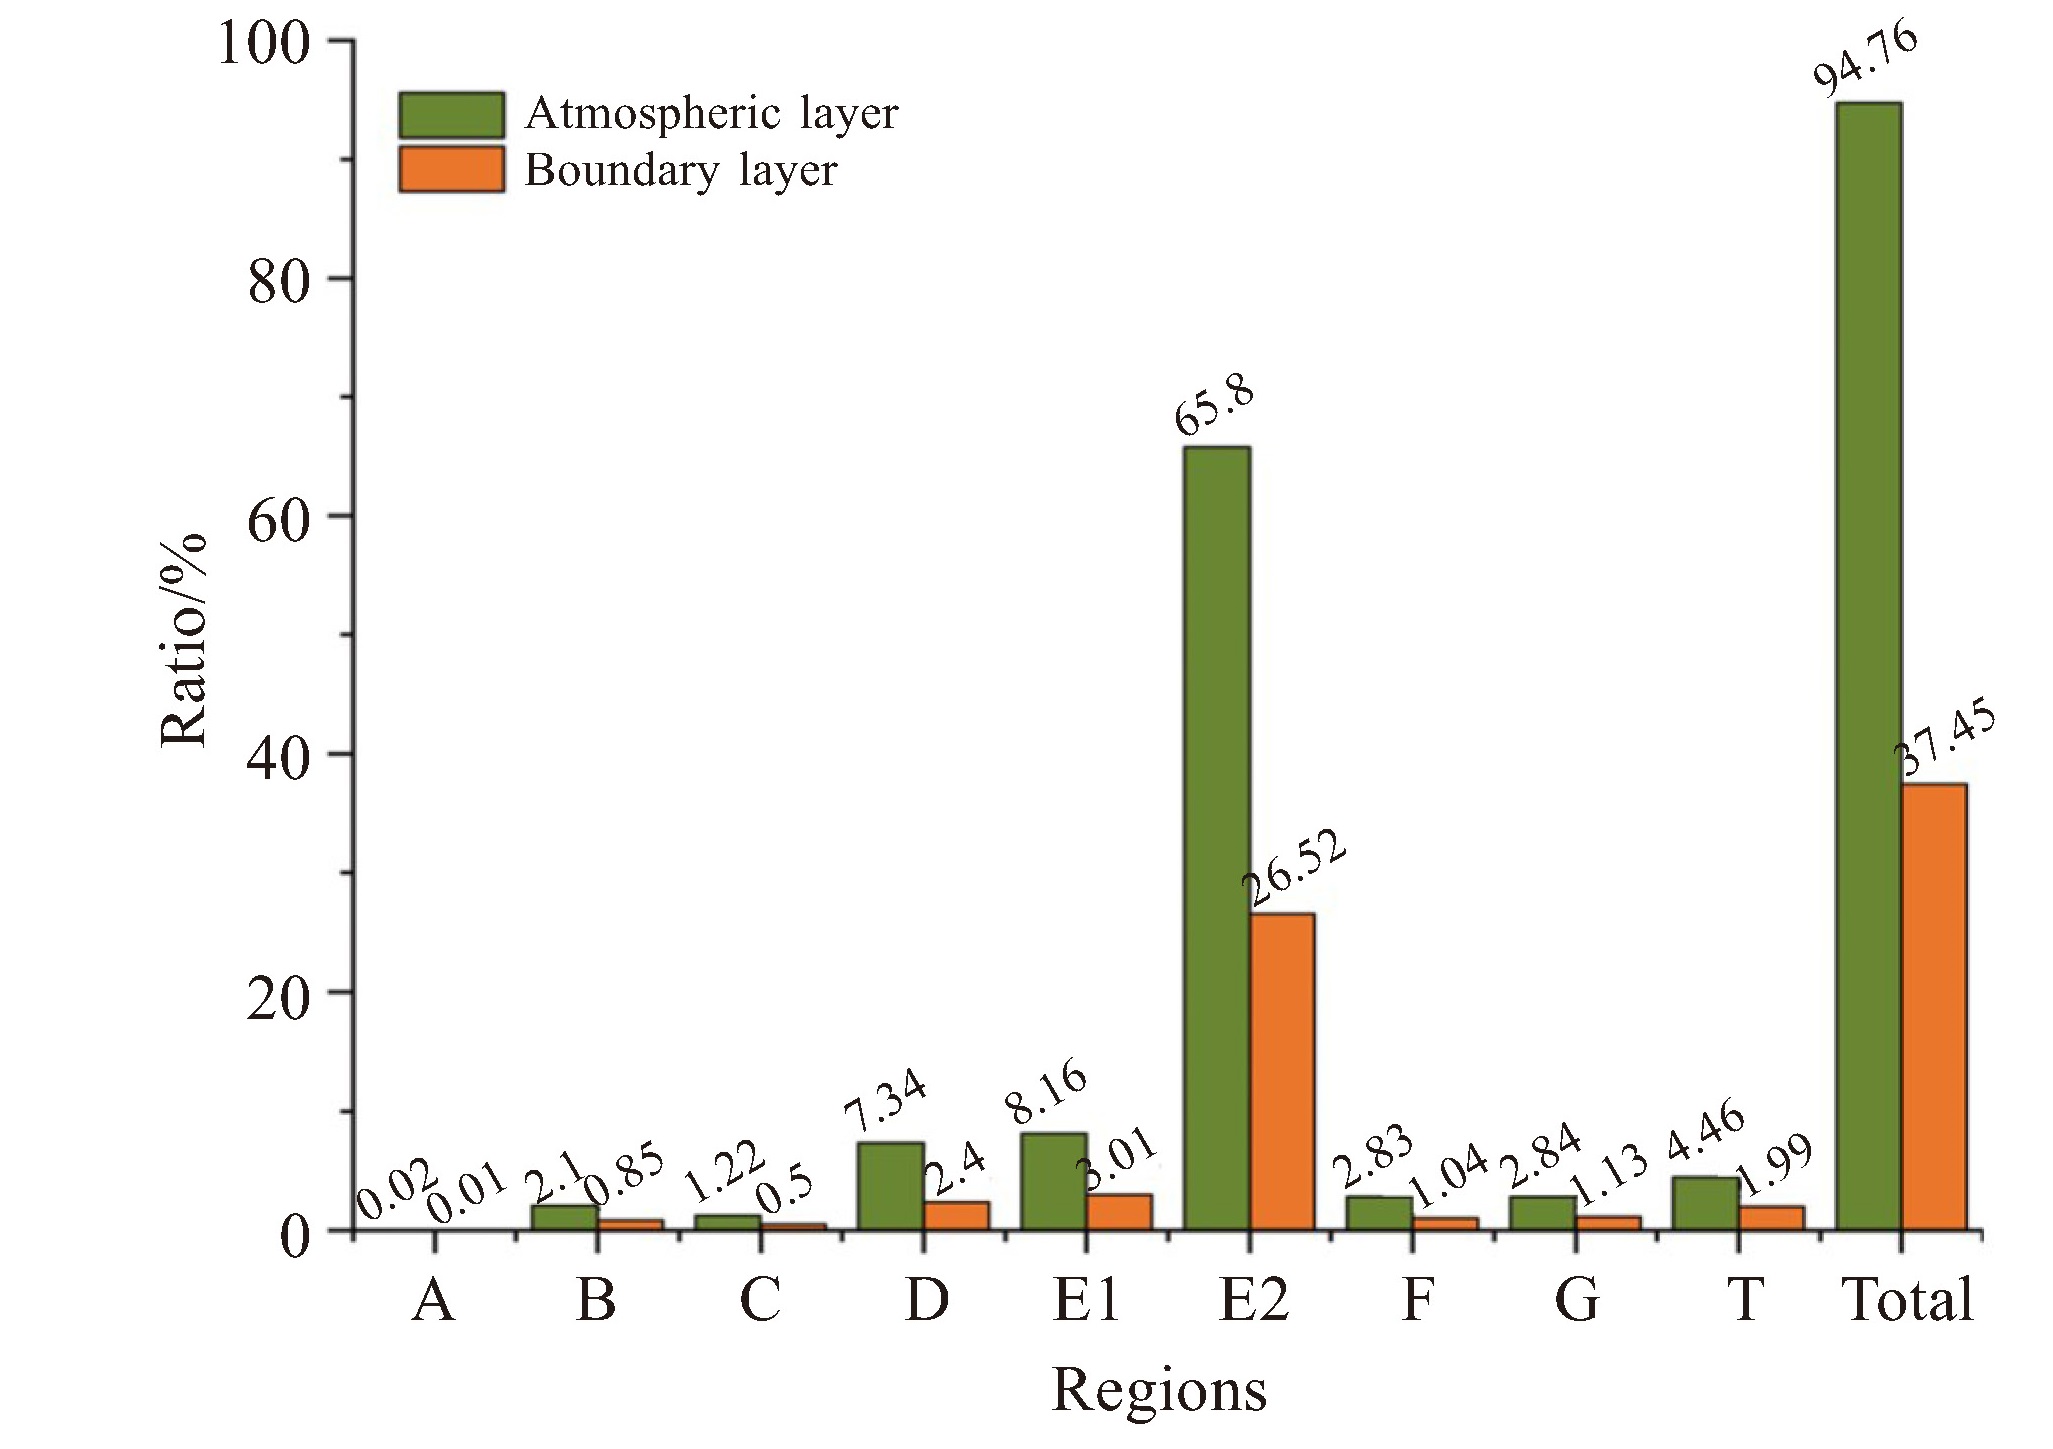
摘要: 本文使用FLEXPART轨迹追踪模式以及水汽来源定量贡献分析方法,分析揭示了2009-2013年暖季(5-9月)北京暴雨日的水汽源区、输送路径和源区定量贡献。结果表明,目标气块初始源地和运动轨迹分布广泛,所处高度较低的气块,由于其源自或途径水面,其水汽摄取能力更强;目标气块到达北京之前,经历了多次不同程度的水汽摄取和释放,其中,华北和华中及其沿海区域摄取和释放最为显著。暴雨日水汽主要来自我国中东部大陆及沿海,其中,华北和华中大陆及沿海地区贡献最大(65.8%),而亚洲西部-中国西北部-青藏高原地区(7.34%)和华南大陆及沿海(8.16%)贡献相当。目标气块从华北和华中大陆及沿海地区摄取的水汽总量最大,而在暴雨区释放部分仅占6.9%,但由于摄取总量巨大,对暴雨日贡献远高于其他区域;亚洲西部-中国西北部-青藏高原地区水汽摄取总量排在第二位,但沿途损失占比较高,然而由于摄取总量明显高于华南大陆及沿海,造成其与后者相当;华南大陆及沿海地区水汽摄取总量与俄罗斯南部-贝加尔湖附近地区相当,但由于相对较低的沿途损失率,造成前者水汽明显高于后者。
-
关键词:
- FLEXPART模式 /
- 水汽来源定量分析方法 /
- 暴雨日 /
- 暖季
Abstract: With the help of the FLEXPART model as well as a quantitative analysis of water vapor source contribution, the present study investigated the water vapor sources, transport paths, and quantitative contribution to rainstorm events in Beijing during warm seasons (May-September) from 2009 to 2013. Key findings are as follows. Air parcels originated from widely distributed initial source regions with varying transport paths. Lower-altitude air parcels exhibited enhanced moisture uptake capacity, particularly those originating from or traversing water surfaces. Air parcels underwent multiple moisture uptake and release processes en route to Beijing, with the most pronounced exchanges occurring over the continental and coastal areas of Central China and North China. Dominant moisture contributions (65.8%) to Beijing rainstorms originated from the continental and coastal areas of Central and North China. Secondary contributions included Western Asia-Northwest China-Tibetan Plateau (7.34%) and South China continental/ coastal regions (8.16%). The total amount of water vapor absorbed by the target air parcel from the continental and coastal areas of North China and Central China was the largest. While the proportion of water vapor released in Beijing was only 6.9%, due to the huge amount of water vapor absorbed in the continental and coastal areas of Central and North China, the contribution of this area to the rainstorm days was much higher than that other areas. The Western Asia-Northwest China-Tibetan Plateau region ranked second in total moisture uptake but exhibited substantial transport losses, reducing its effective contribution to levels comparable with South China. Although the total amount of water vapor uptake in the continental and coastal areas of South China was equivalent to that in the south of Russia near Lake Baikal, due to the relatively low loss along the way, the contribution of water vapor of the former was significantly higher than that of the latter. -

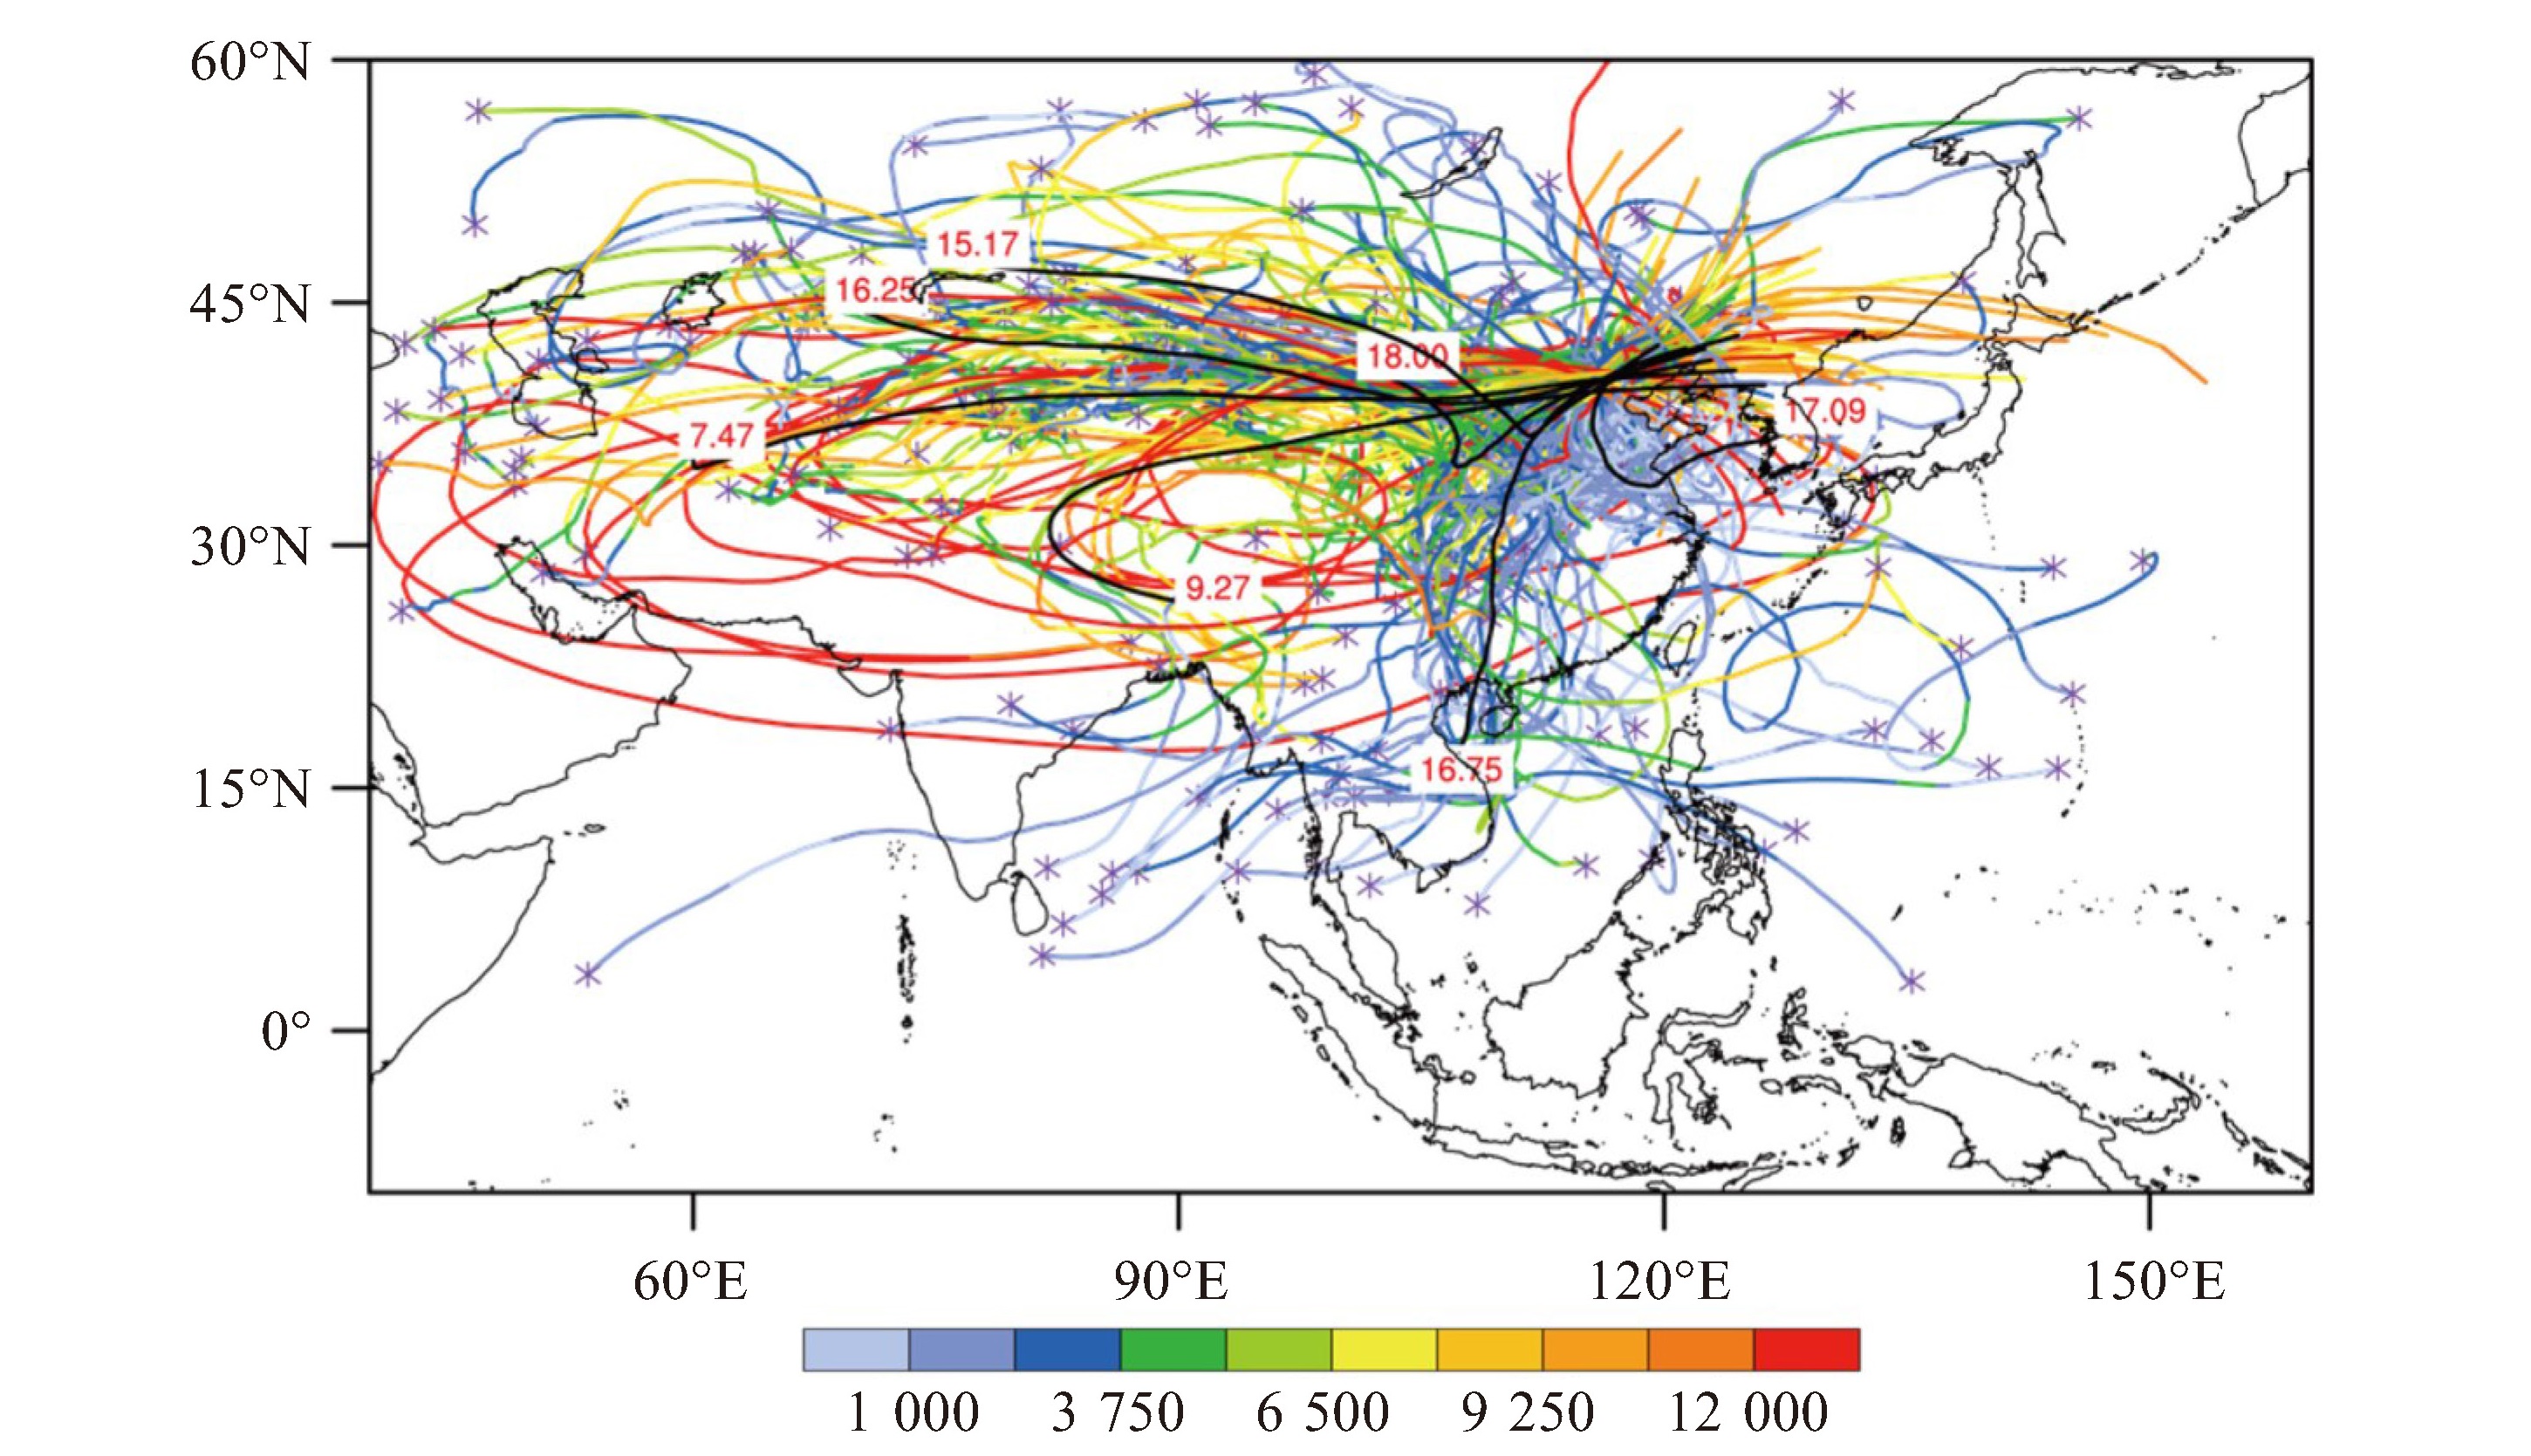
图 1 2009—2013年暖季(5—9月)北京地区暴雨日目标气块轨迹
彩色轨迹线:目标气块轨迹(间隔150条轨迹绘制);黑色粗实线轨迹:聚类后轨迹;聚类数:7(红色数字表示每一类轨迹所占比例,单位:%);轨迹颜色表示距离地表高度(单位:m);紫色星号“*”表示轨迹初始点。

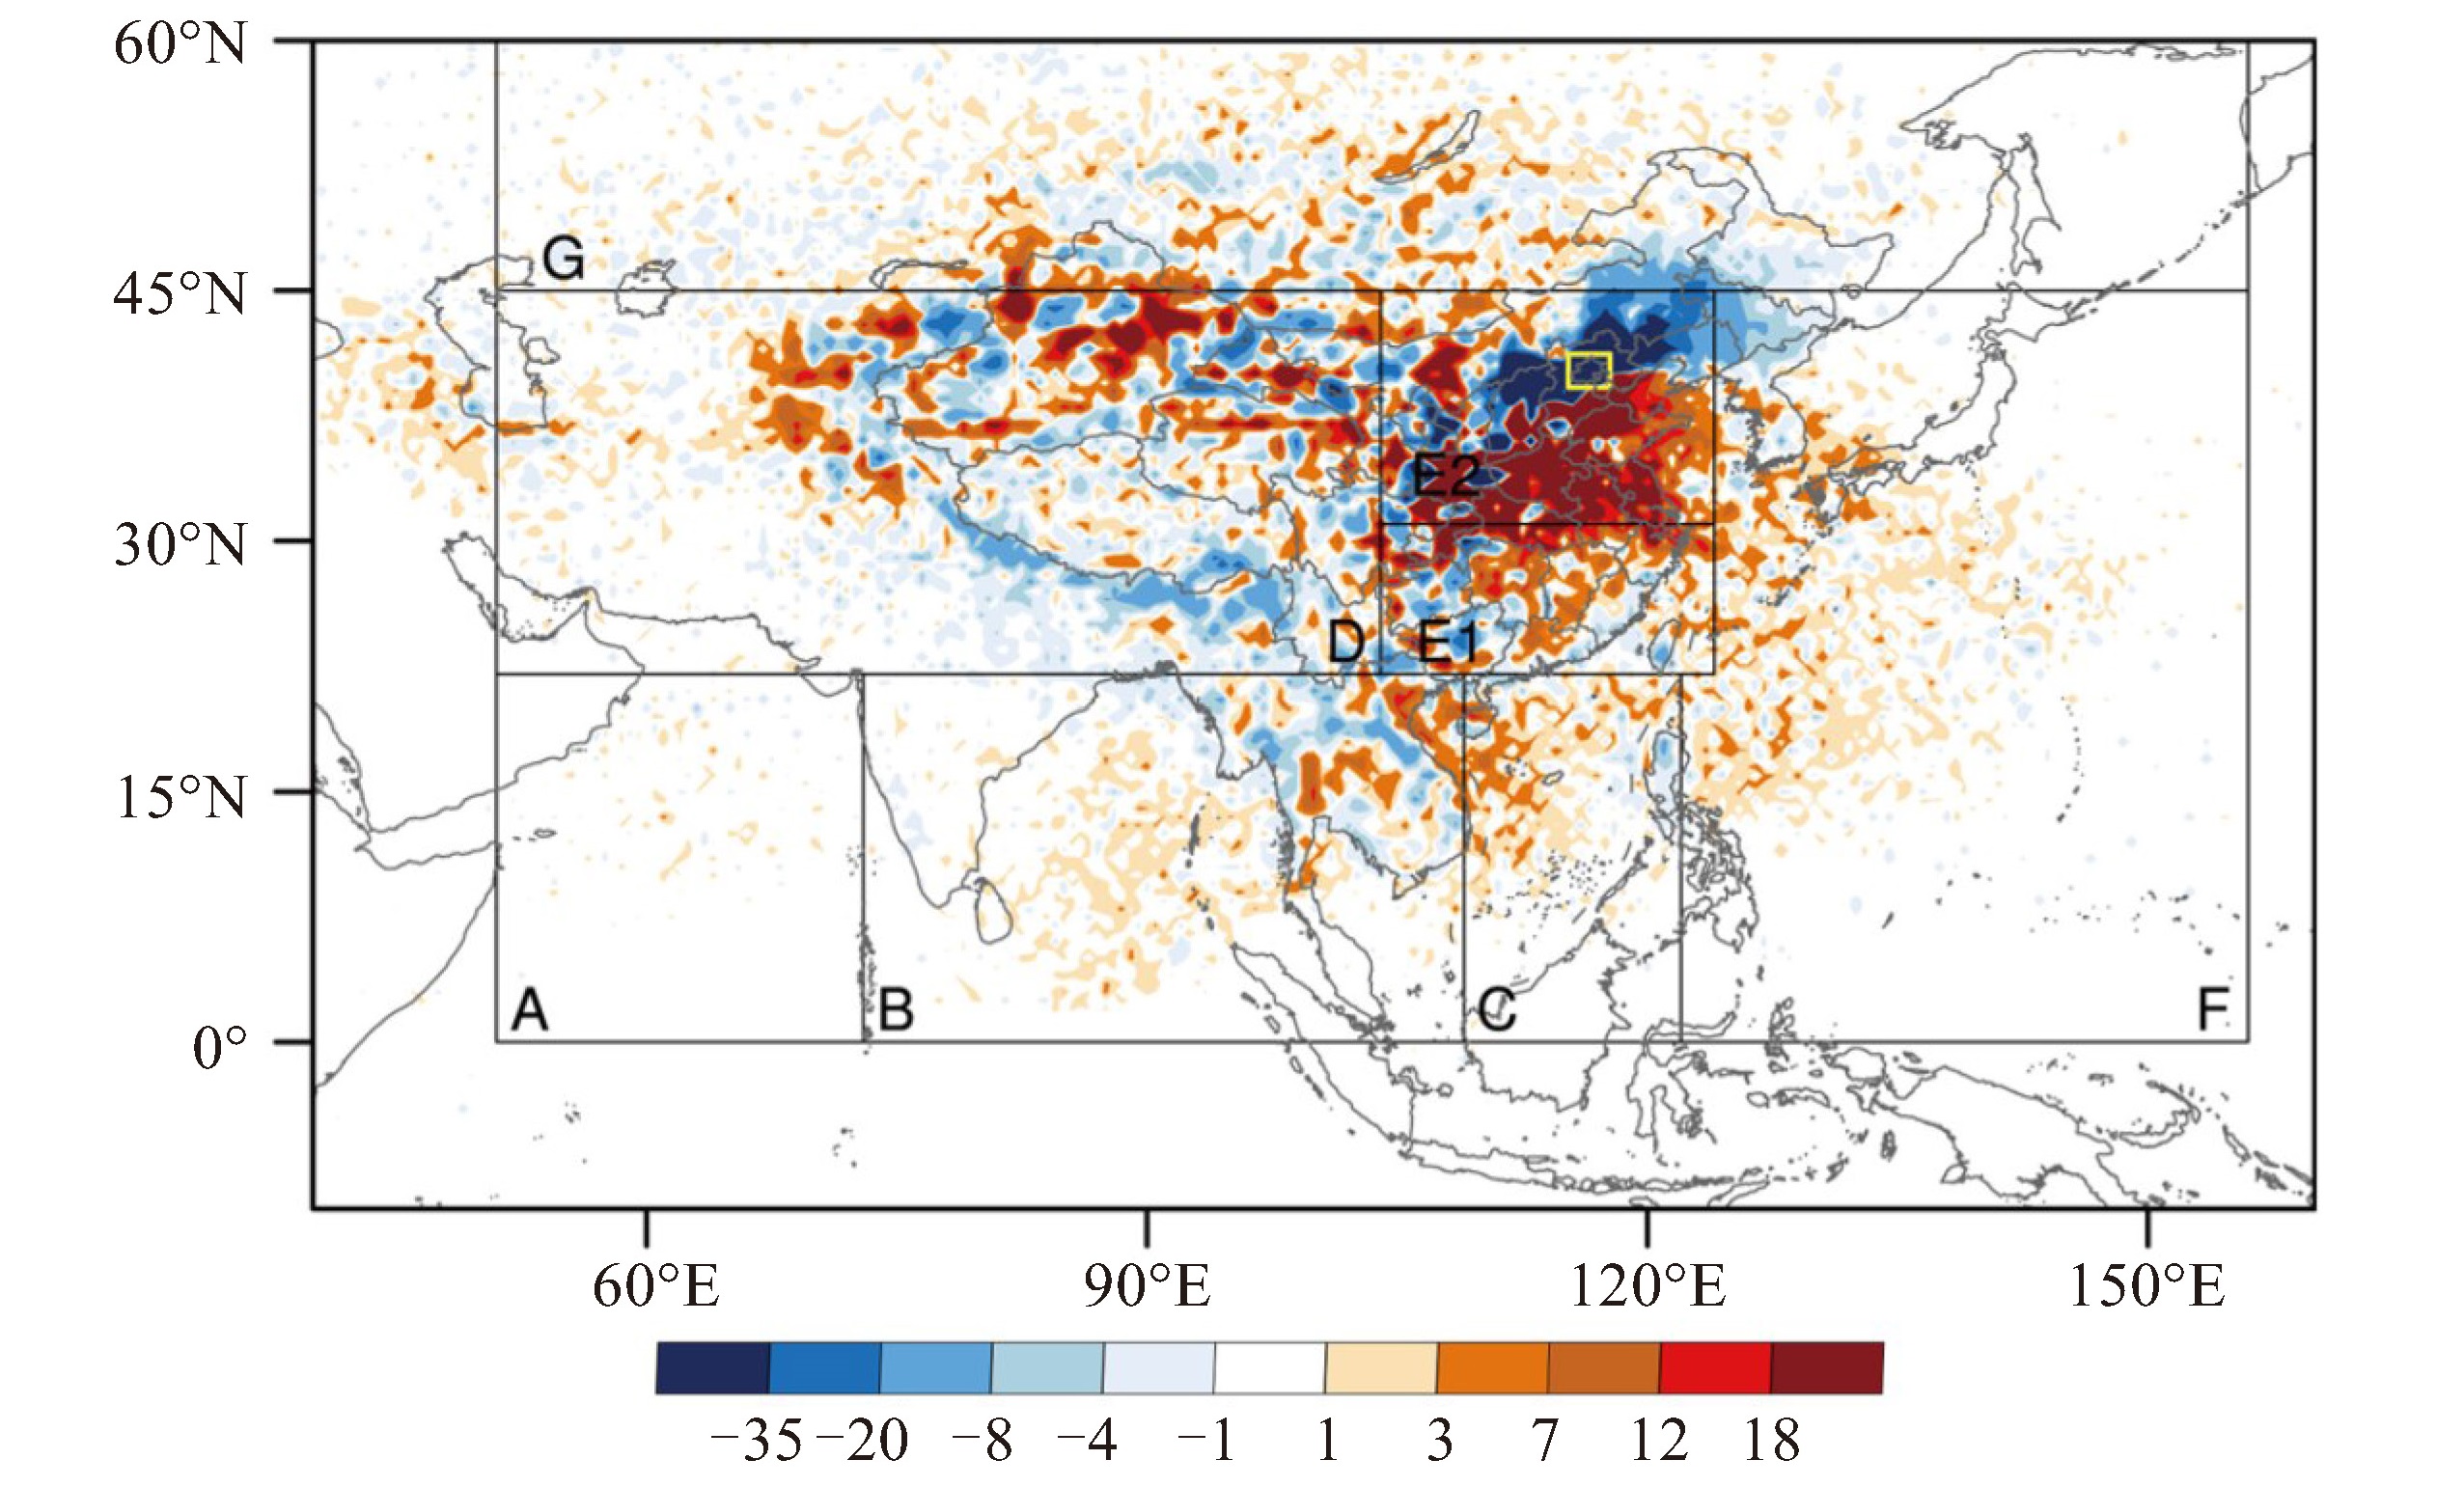
图 2 2009—2013年暖季北京地区暴雨日目标气块行进过程中的E-P图(单位:mm),其中,暖色调代表水汽净摄取,冷色调代表水汽净释放(降水)
黑色方框指示重点考察的水汽源区:阿拉伯海地区(A), 印度半岛-孟加拉湾-中南半岛地区(B),中国南海(C),亚洲西部-中国西北部-青藏高原地区(D),华南大陆及沿海地区(E1),华北和华中大陆及沿海地区(E2),西北太平洋地区(F),俄罗斯南部和蒙古地区(G),以及北京降水区域(T,黄色方框)。

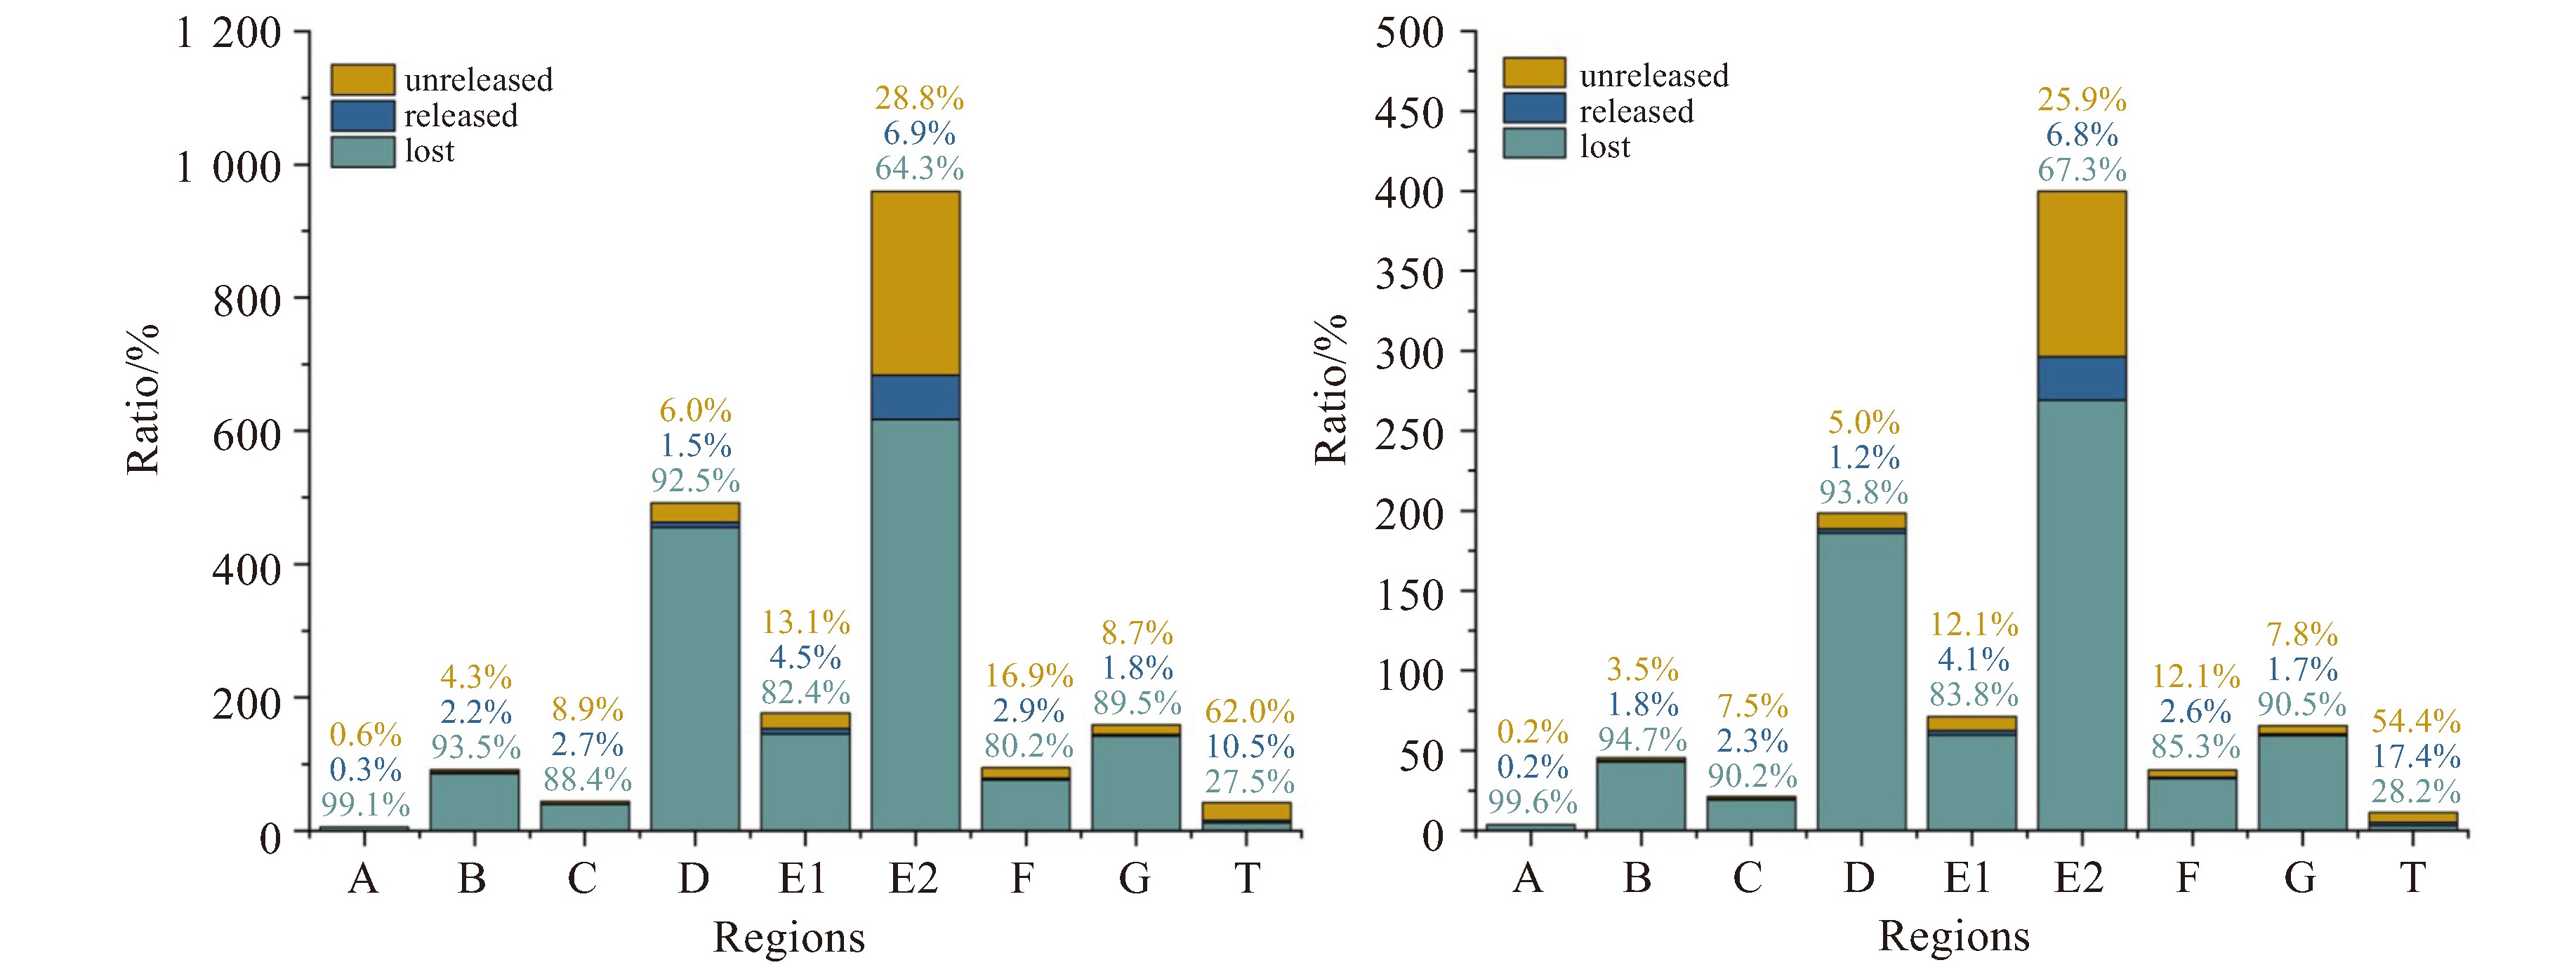
图 4 2009—2013年暖季北京地区暴雨日各水汽源区整层大气(a)和边界层内(b)水汽总摄取量和不同组成部分占目标降水区水汽总释放量百分比的直方图
蓝色代表沿途损失部分,深蓝色代表在目标降水区域释放部分,土黄色代表到达目标区域但未释放部分;各直方图上面不同颜色数字代表不同组成部分占该源区水汽总摄取量的比例。
表 1 2009—2013年暖季(5—9月)北京地区暴雨日日数、每个暴雨日目标气块的平均数目以及所有暴雨日目标气块总数
日数/天 平均目标气块数/个 目标气块总数/个 暴雨日 45 923 41541  下载: 导出CSV
-
[1] PENDERGRASS A G, KNUTTI R. The uneven nature of daily precipitation and its change[J]. Geophysical Research Letters, 2018, 45(21): 11 980-11 988. [2] SUPANTHA P, Subimal G, MICKY M, et al. Increased spatial variability and intensification of extreme monsoon rainfall due to urbanization[J]. Scientific Reports, 2018, 8: 3918. [3] SONG X, ZHANG J, AGHAKOUCHAK A, et al. Rapid urbanization and changes in spatiotemporal characteristics of precipitation in Beijing metropolitan area[J]. Jounal of Geophysical Research: Atmospheres, 2014, 119: 11 250-11 271. [4] GEERT L, ERIK V M. Increase in hourly precipitation extremes beyond expectations from temperature changes[J]. Wature Geoscienle, 2008, 1: 511-514. [5] BRUBAKER K L, ENTEKHABI D, EAGLESON P S. Estimation of continental precipitation recycling[J]. Journal of Climate, 1993, 6: 1 077-1 089. [6] BONNE J L, DELMOTTE V M, CATTANI O, et al. The isotopic composition of water vapour and precipitation in Ivittuut, southern Greenland[J]. Atmospheric Chemistry and Physics Discussions, 2014, 14: 4 419-4 439. [7] LONGINELLI A, SELMO E. Isotopic composition of precipitation in Italy: A first overall map[J]. Journal of Hydrometeorology, 2003, 270 (1-2): 75-88. [8] SUN B, WANG H J. Water vapor transport paths and accumulation during widespread snowfall events in Northeastern China[J]. Journal of Climate, 2013, 26: 4 550-4 566. [9] MARTINEZ J A, DOMINGUEZ F. Sources of atmospheric moisture for the La Plata River Basin[J]. Journal of Climate, 2014, 27(17): 6 737-6 753. [10] NIETO R, CASTILLO R, DRUMOND A, et al. A catalog of moisture sources for continental climatic regions[J]. Water Resources Research, 2014, 50(6): 5 322-5 328. [11] BRIOUDE J, ARNOLD D, STOHL A, et al. The Lagrangian particle dispersion model FLEXPART-WRF version 3.1[J]. Geoscientific Model Development, 2013, 6(3): 1 889-1 904. [12] VISTEA E, SORTEBERGA A. Moisture transport into the Ethiopian highlands[J]. Intemational Journal of Climatology, 2013, 33(1): 249- 263. [13] GIMENO L, NIETO R, TRIGO R M, et al. Where does the Iberian Peninsula moisture come from? An Answer Based on a Lagrangian approach[J]. Journal of Hyolrometeorology, 2010, 11(2): 421- 436. [14] STOHL A, JAMES P. A Lagrangian analysis of the atmospheric branch of the global water cycle. Part Ⅰ: Method description, validation, and demonstration for the August 2002 flooding in central Europe[J]. Journal of Hyolrometeorology, 2004, 5(4): 656-678. [15] STOHL A, JAMES P. A Lagrangian analysis of the atmospheric branch of the global water cycle. Part Ⅱ: Moisture transports between earth's ocean basins and river catchments[J]. Journal of Hyolrometeorology, 2005, 6(6): 961-984. [16] CCORNWELL G C, XIAO H, BERG L K, et al. Simulated dust transport in the convective boundary layer[J]. Journal of Geophysical Rescarch: Atmospheres, 2021, 126(5). [17] ZABUKOVEC A, ANCELLET G, PENNER I, et al. Characterization of aerosol sources and optical properties in Siberia using airborne and spaceborne observations[J]. Atmosphere, 2021, 12(2): 244-244. [18] 陈镭, 周广强, 毛卓成, 等. 上海地区2017年三次短时重度污染过程变化特征及其气象影响因素[J]. 气象, 2020, 545(5): 89-100. [19] 余钟奇, 瞿元昊, 周广强, 等. 2018年秋冬季长江三角洲区域PM_(2.5)污染来源数值研究[J]. 中国环境科学, 2020, 40(10): 64-73. [20] LAL S, VENKATARAMANI S, CHANDRA N, et al. Transport effects on the vertical distribution of tropospheric ozone over western India [J]. Journal of Geophysical Rescarch: Atmospheres, 2014, 119 (16): 10 012-10 026. [21] ANGEVINE W M, BRIOUDE J, MCKEEN S, et al. Pollutant transport among California regions[J]. Journal of Geophysical Rescarch: Atmospheres, 2013, 118(12): 6 750-6 763. [22] HONRATH R E, HELMIG D, OWEN R C, et al. Nonmethane hydrocarbons at Pico Mountain, Azores: 2. Event-specific analyses of the impacts of mixing and photochemistry on hydrocarbon ratios[J]. Journal of Geophysical Rescarch: Atmospheres, 2008, 113(D20). [23] WARNEKE C, GOUW J A, STOHL A, et al. Biomass burning and anthropogenic sources of CO over New England in the summer 2004[J]. Journal of Geophysical Rescarch: Atmospheres, 2006, 111(D23). [24] HU Q, JIANG D, LANG X, et al. Moisture sources of summer precipitation over eastern China during 1979-2009: A Lagrangian transient simulation[J]. Intemational Journal of Climatology, 2021, 41: 1 162-1 178. [25] PERDIGON-MORALES J, ROMERO-CENTENO R, ORDONEZ P, et al. Influence of the Madden-Julian oscillation on moisture transport by the Caribbean low level jet during the midsummer drought in Mexico[J]. Atmospheric Research, 2021, 248. [26] PERRY L B, MATTHEWS T, GUY H, et al. Precipitation characteristics and moisture source regions on Mt. Everest in the Khumbu, Nepal [J]. One Earth, 2020, 3(5): 594-607. [27] 刘煜, 刘蓉, 王欣, 等. 黄河源区干湿演变条件下的水汽输送特征研究[J]. 高原气象, 2020, 1- 11. [28] 薛一迪, 崔晓鹏. "威马逊"(1409) 降水水汽来源和源区定量贡献分析[J]. 大气科学, 2020, 44(02): 341-355. [29] 崔晓鹏, 杨玉婷. 2022. "21·7" 河南暴雨水汽源地追踪和定量贡献分析[J]. 大气科学, 46(6): 1543-1556 [30] ALGARRA I, EIRAS-BARCA J, NIETO R, et al. Global climatology of nocturnal low-level jets and associated moisture sources and sinks [J]. Atmospheric Research, 2019, 229: 39-59. [31] DRUMOND A, STOJANOVIC M, NIETO R, et al. Linking anomalous moisture transport and drought episodes in the IPCC reference regions[J]. Bulletin of the American Meteorological Society, 2019, 100(8): 1 481-1 498. [32] FREMME A, SODEMANN H. The role of land and ocean evaporation on the variability of precipitation in the Yangtze River valley[J]. Hydrology and Earth System Science, 2019, 23(6): 2 525-2 540. [33] NIETO R, CIRIC D, VAZQUEZ M, et al. Contribution of the main moisture sources to precipitation during extreme peak precipitation months[J]. Advances in Water Resources, 2019, 131. [34] REBOITA M S, NIETO R, ROCHA R, et al. Characterization of moisture sources for Austral Seas and relationship with sea ice concentration[J]. Atmosphere, 2019, 10(10): 627. [35] 朱丽, 刘蓉, 王欣, 等. 基于FLEXPART模式对黄河源区盛夏降水异常的水汽源地及输送特征研究[J]. 高原气象, 2019, 38(03): 484- 496. [36] HUANG Y J, CUI X P. Moisture sources of an extreme precipitation event in Sichuan, China, based on the Lagrangian method[J]. Atmospheric Science Letters, 2015, 16(2): 177-183. [37] HUANG Y J, CUI X P. Moisture sources of torrential rainfall events in the Sichuan Basin of China during summers of 2009-13[J]. Journal of Hyolrometeorology, 2015, 16(4): 1 906-1 917. [38] 权晨, 陈斌, 赵天良, 等. 拉格朗日水汽源诊断方法在三江源区的应用[J]. 应用气象学报, 2016, 27(6): 688-697. [39] 陆婷婷, 崔晓鹏. 2022. 北京两次特大暴雨过程观测对比[J]. 大气科学, 46(1): 111-132. [40] 陈斌, 徐祥德, 施晓晖. 拉格朗日方法诊断2007年7月中国东部系列极端降水的水汽输送路径及其可能蒸发源区[J]. 气象学报, 2011, 69(5): 810-818. [41] DORLING S R, DAVIES T D, PIERCE C E. Cluster-analysis - a technique for estimating the synoptic meteorological controls on air and precipitation chemistry - results from Eskdalemuir, south Scotland[J]. Atmospheric Environment Part a-General Topics, 1992, 26(14): 2 583- 2 602. -

 点击查看大图
计量
- 文章访问数: 10
- HTML全文浏览量: 8
- PDF下载量: 3
- 被引次数: 0
 粤公网安备 4401069904700003号