


Ozone Forecasting Performance Evaluation and Error Source Analysis of GRACEs Model Under Different Synoptic Patterns in Guangdong
-
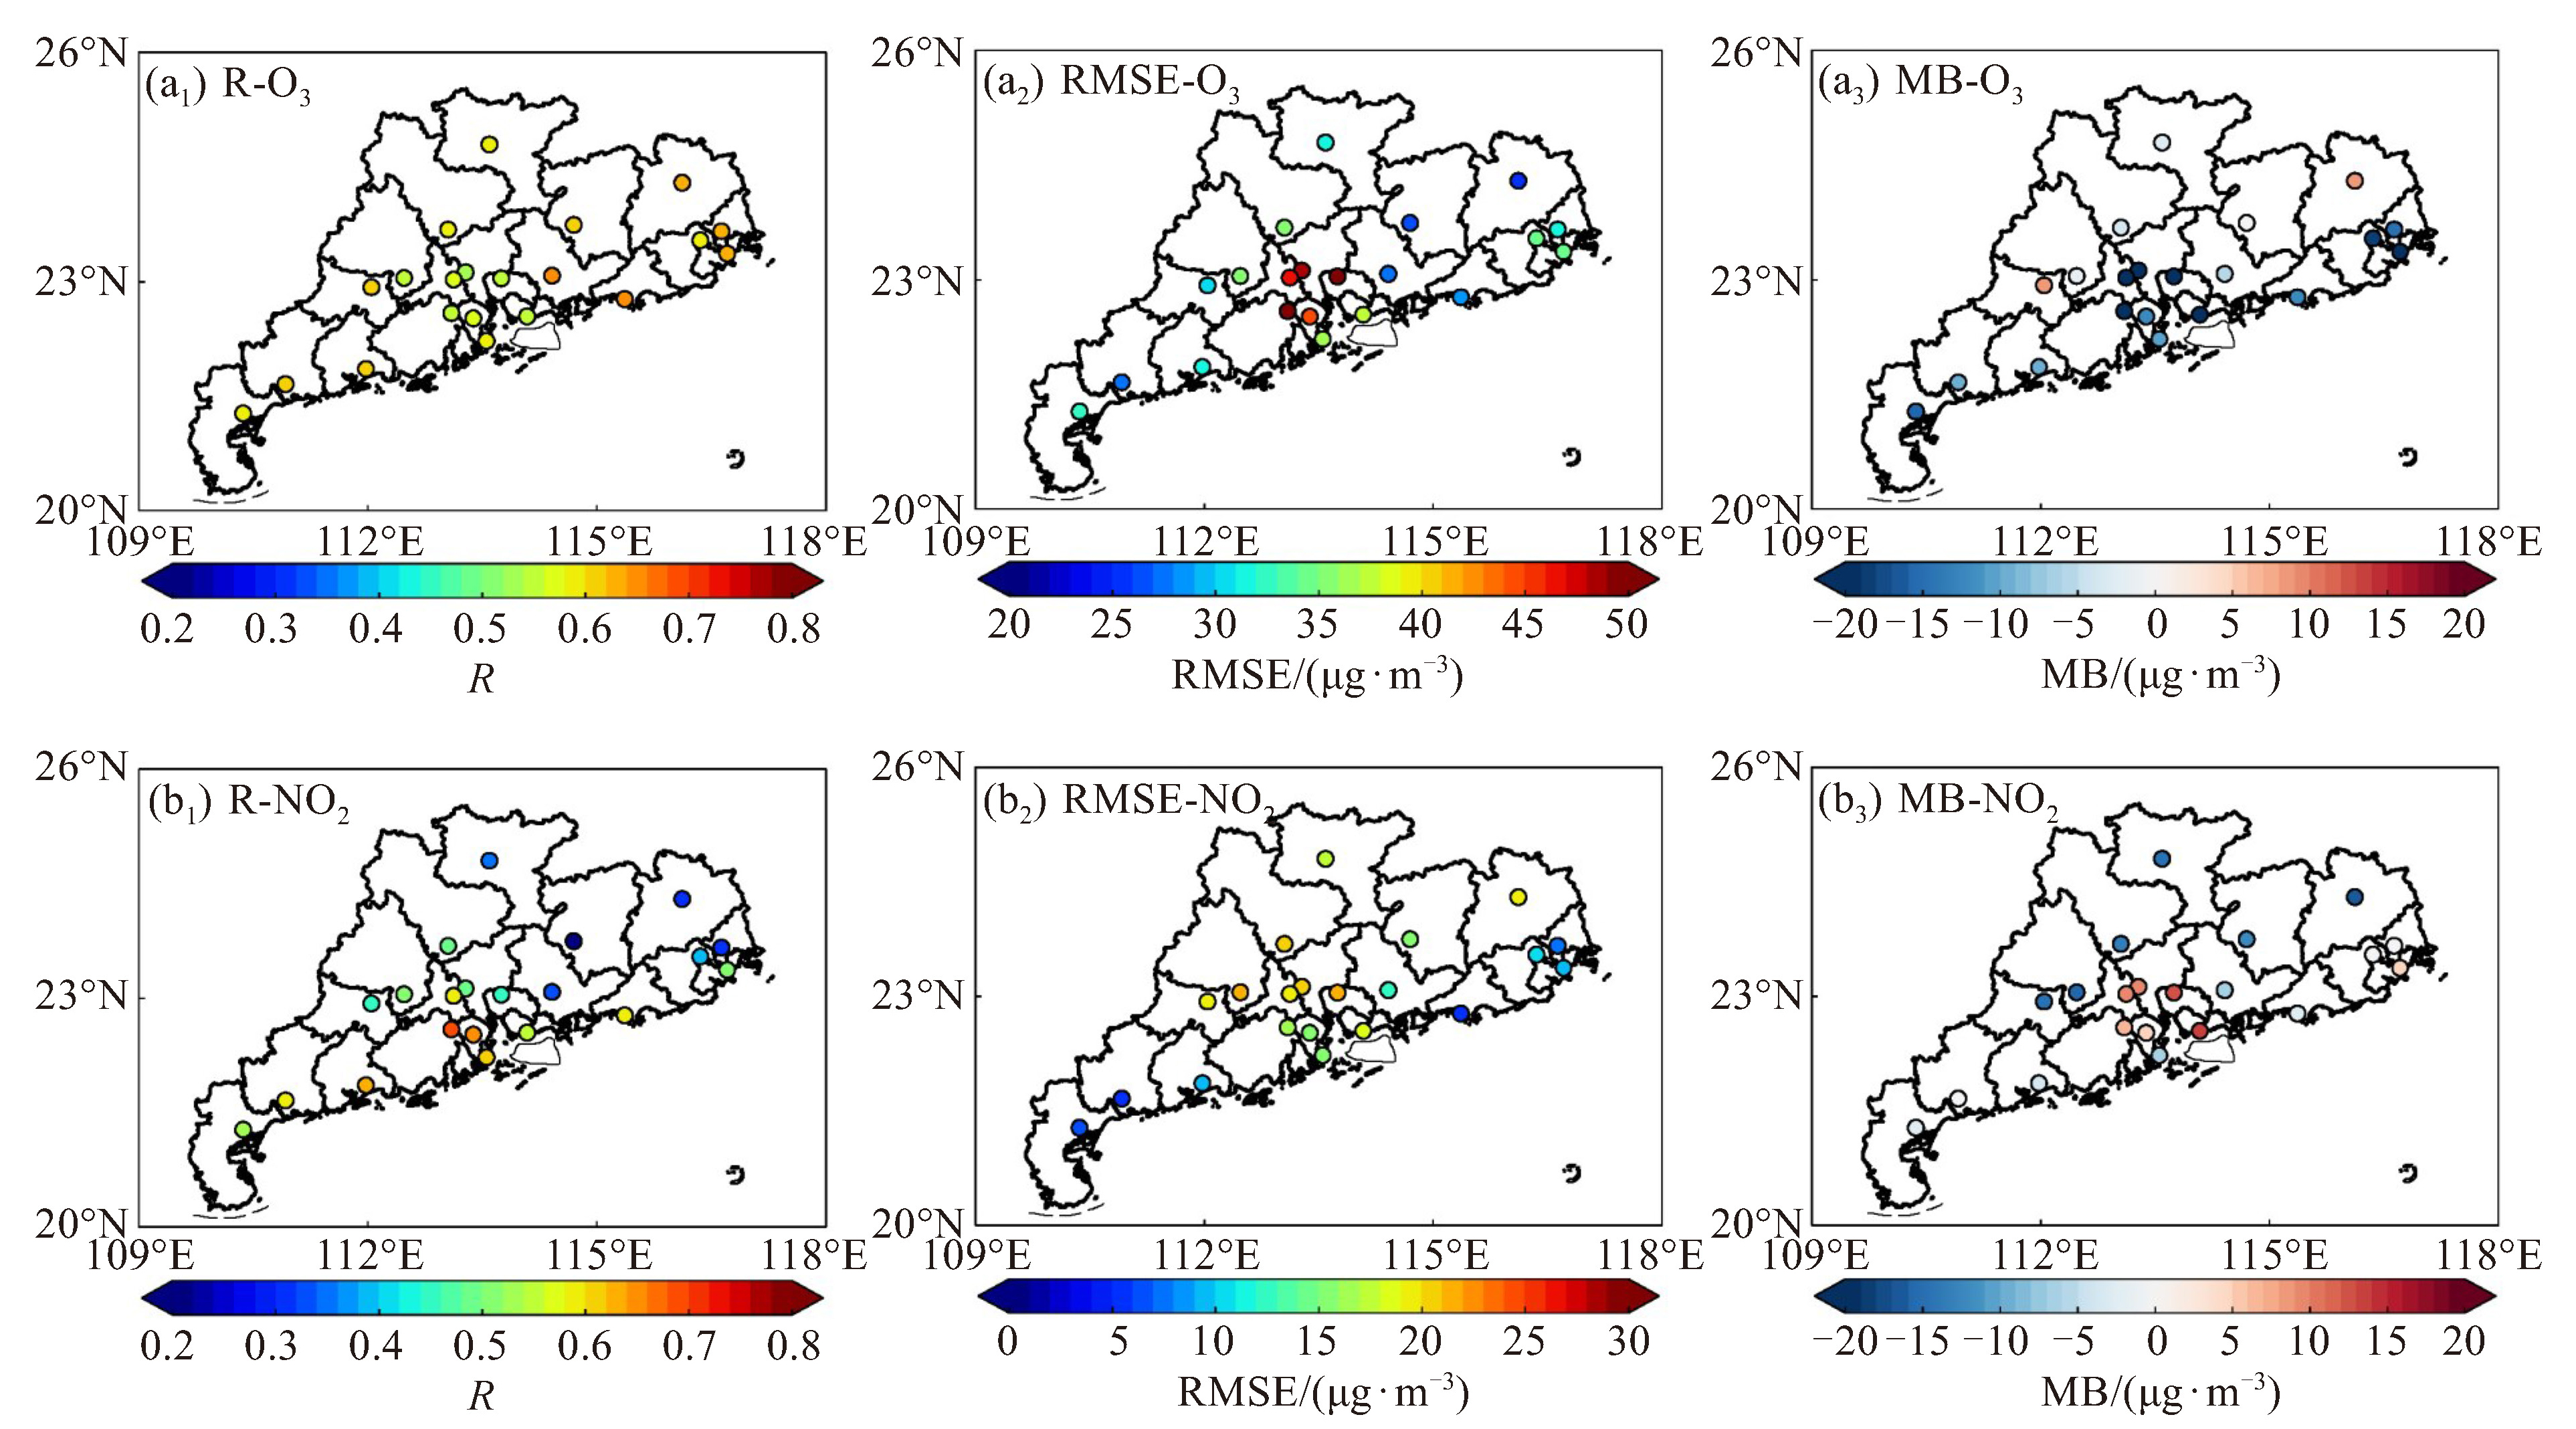
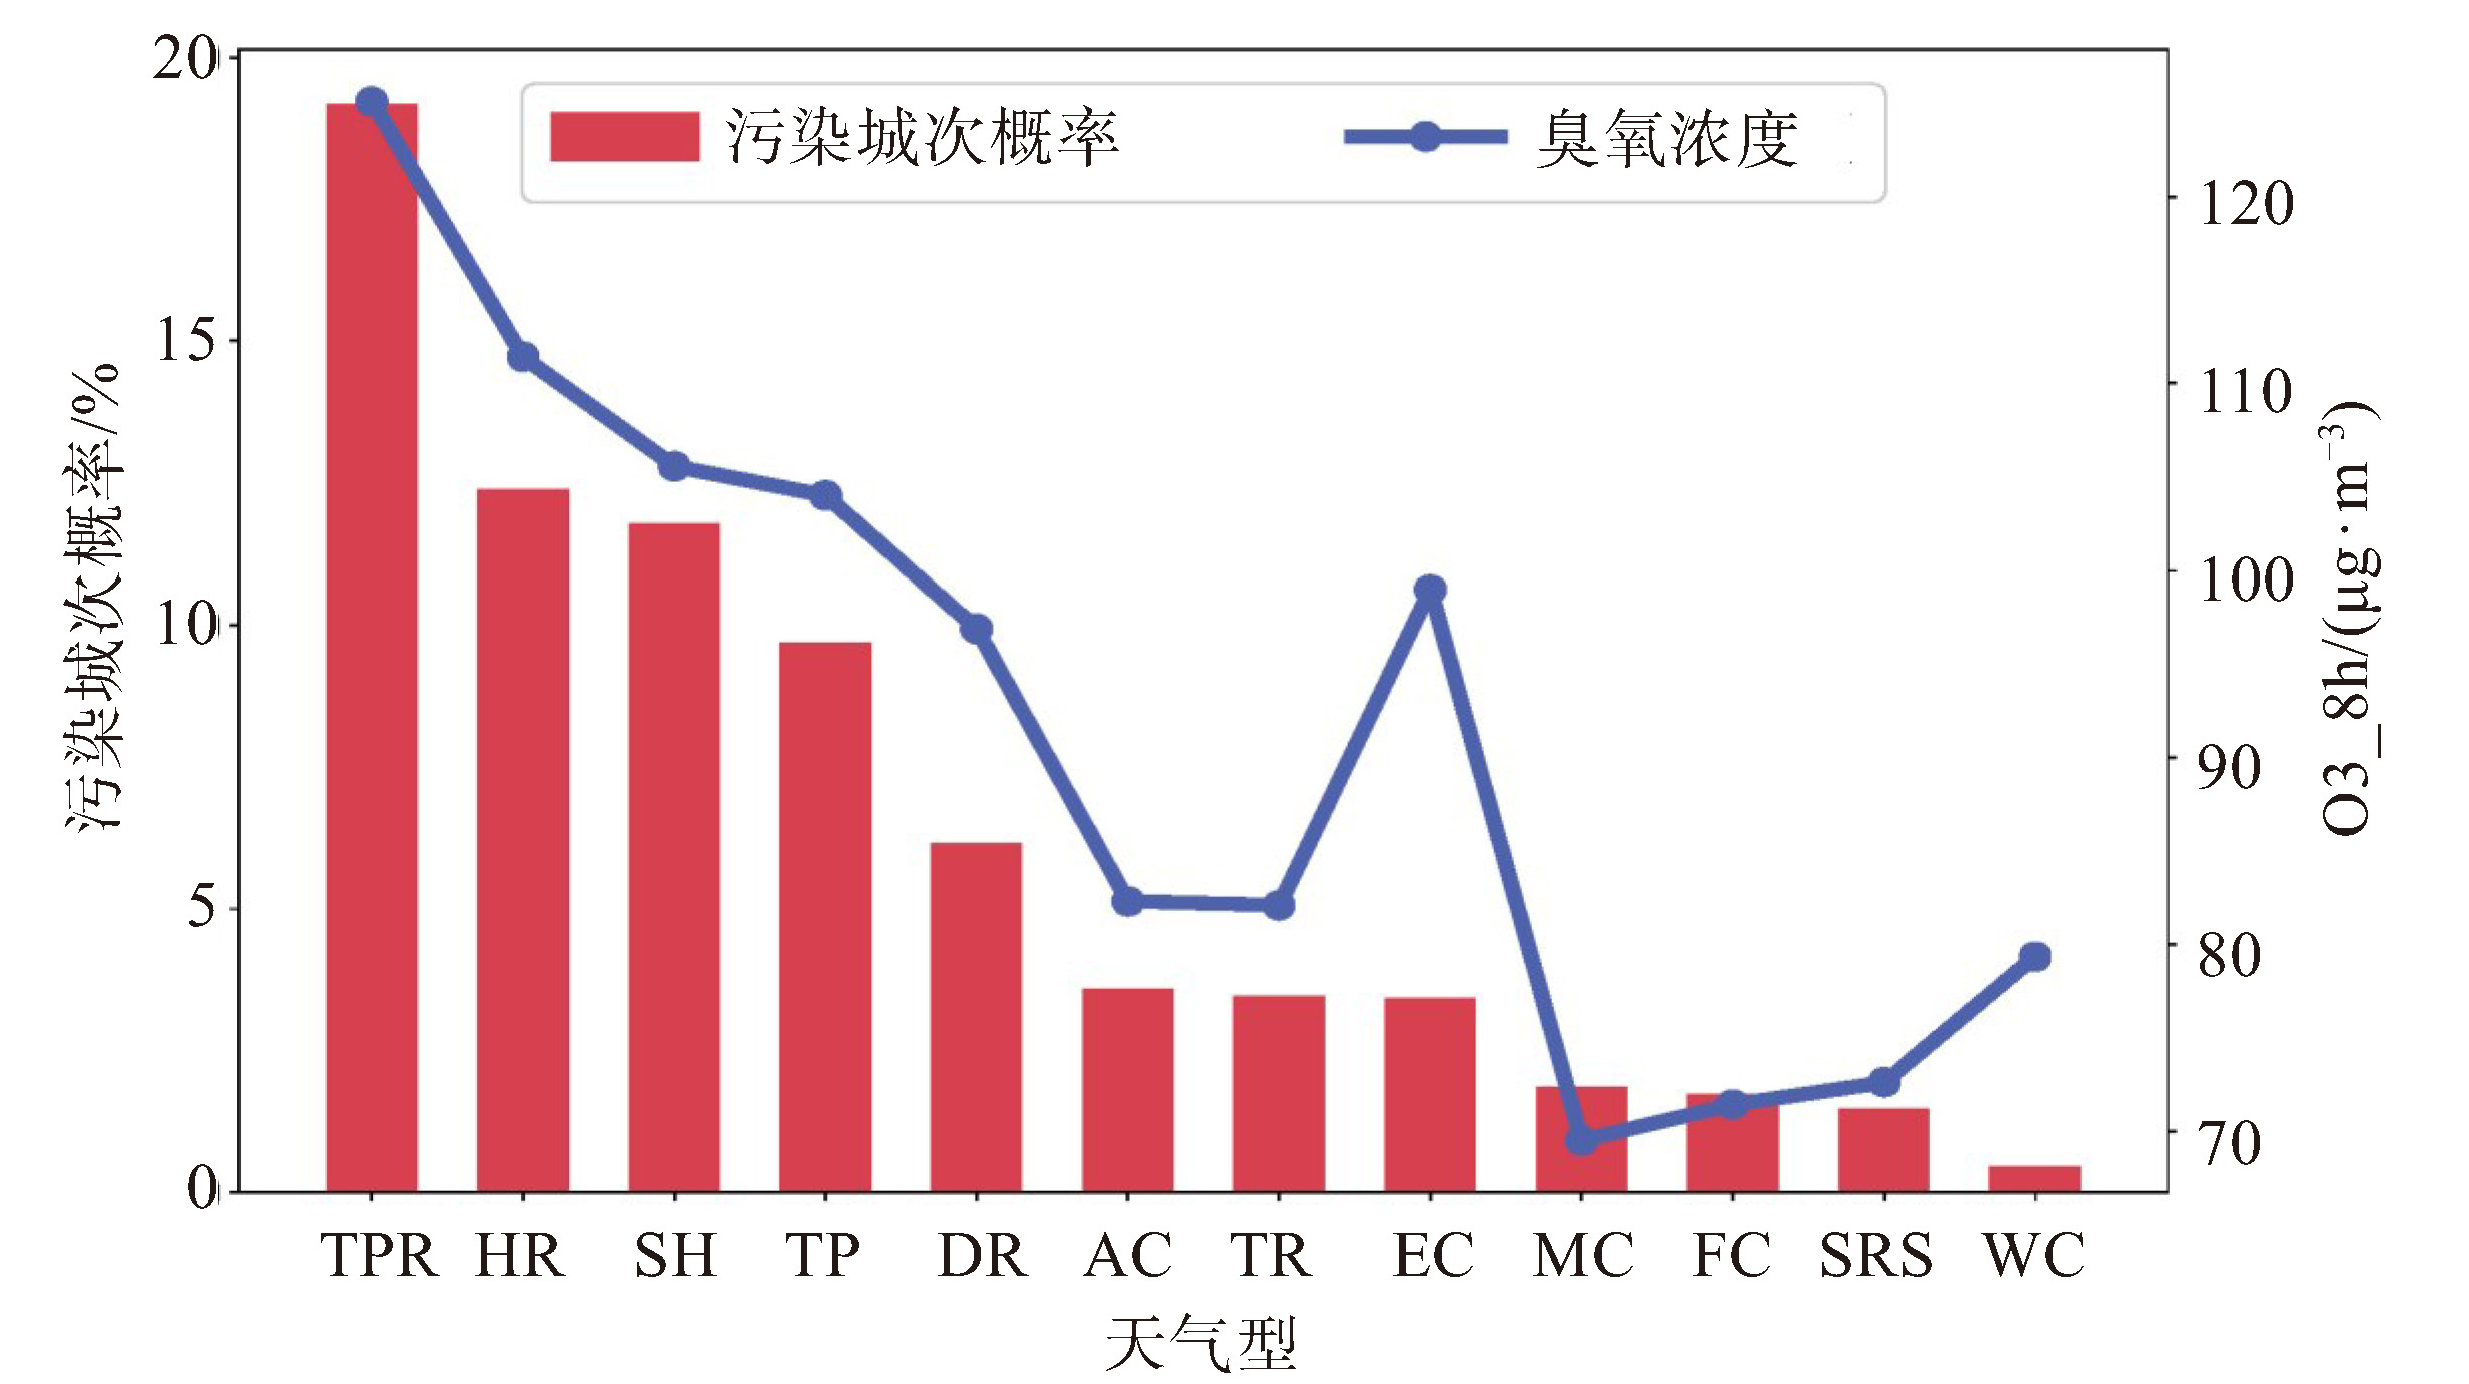
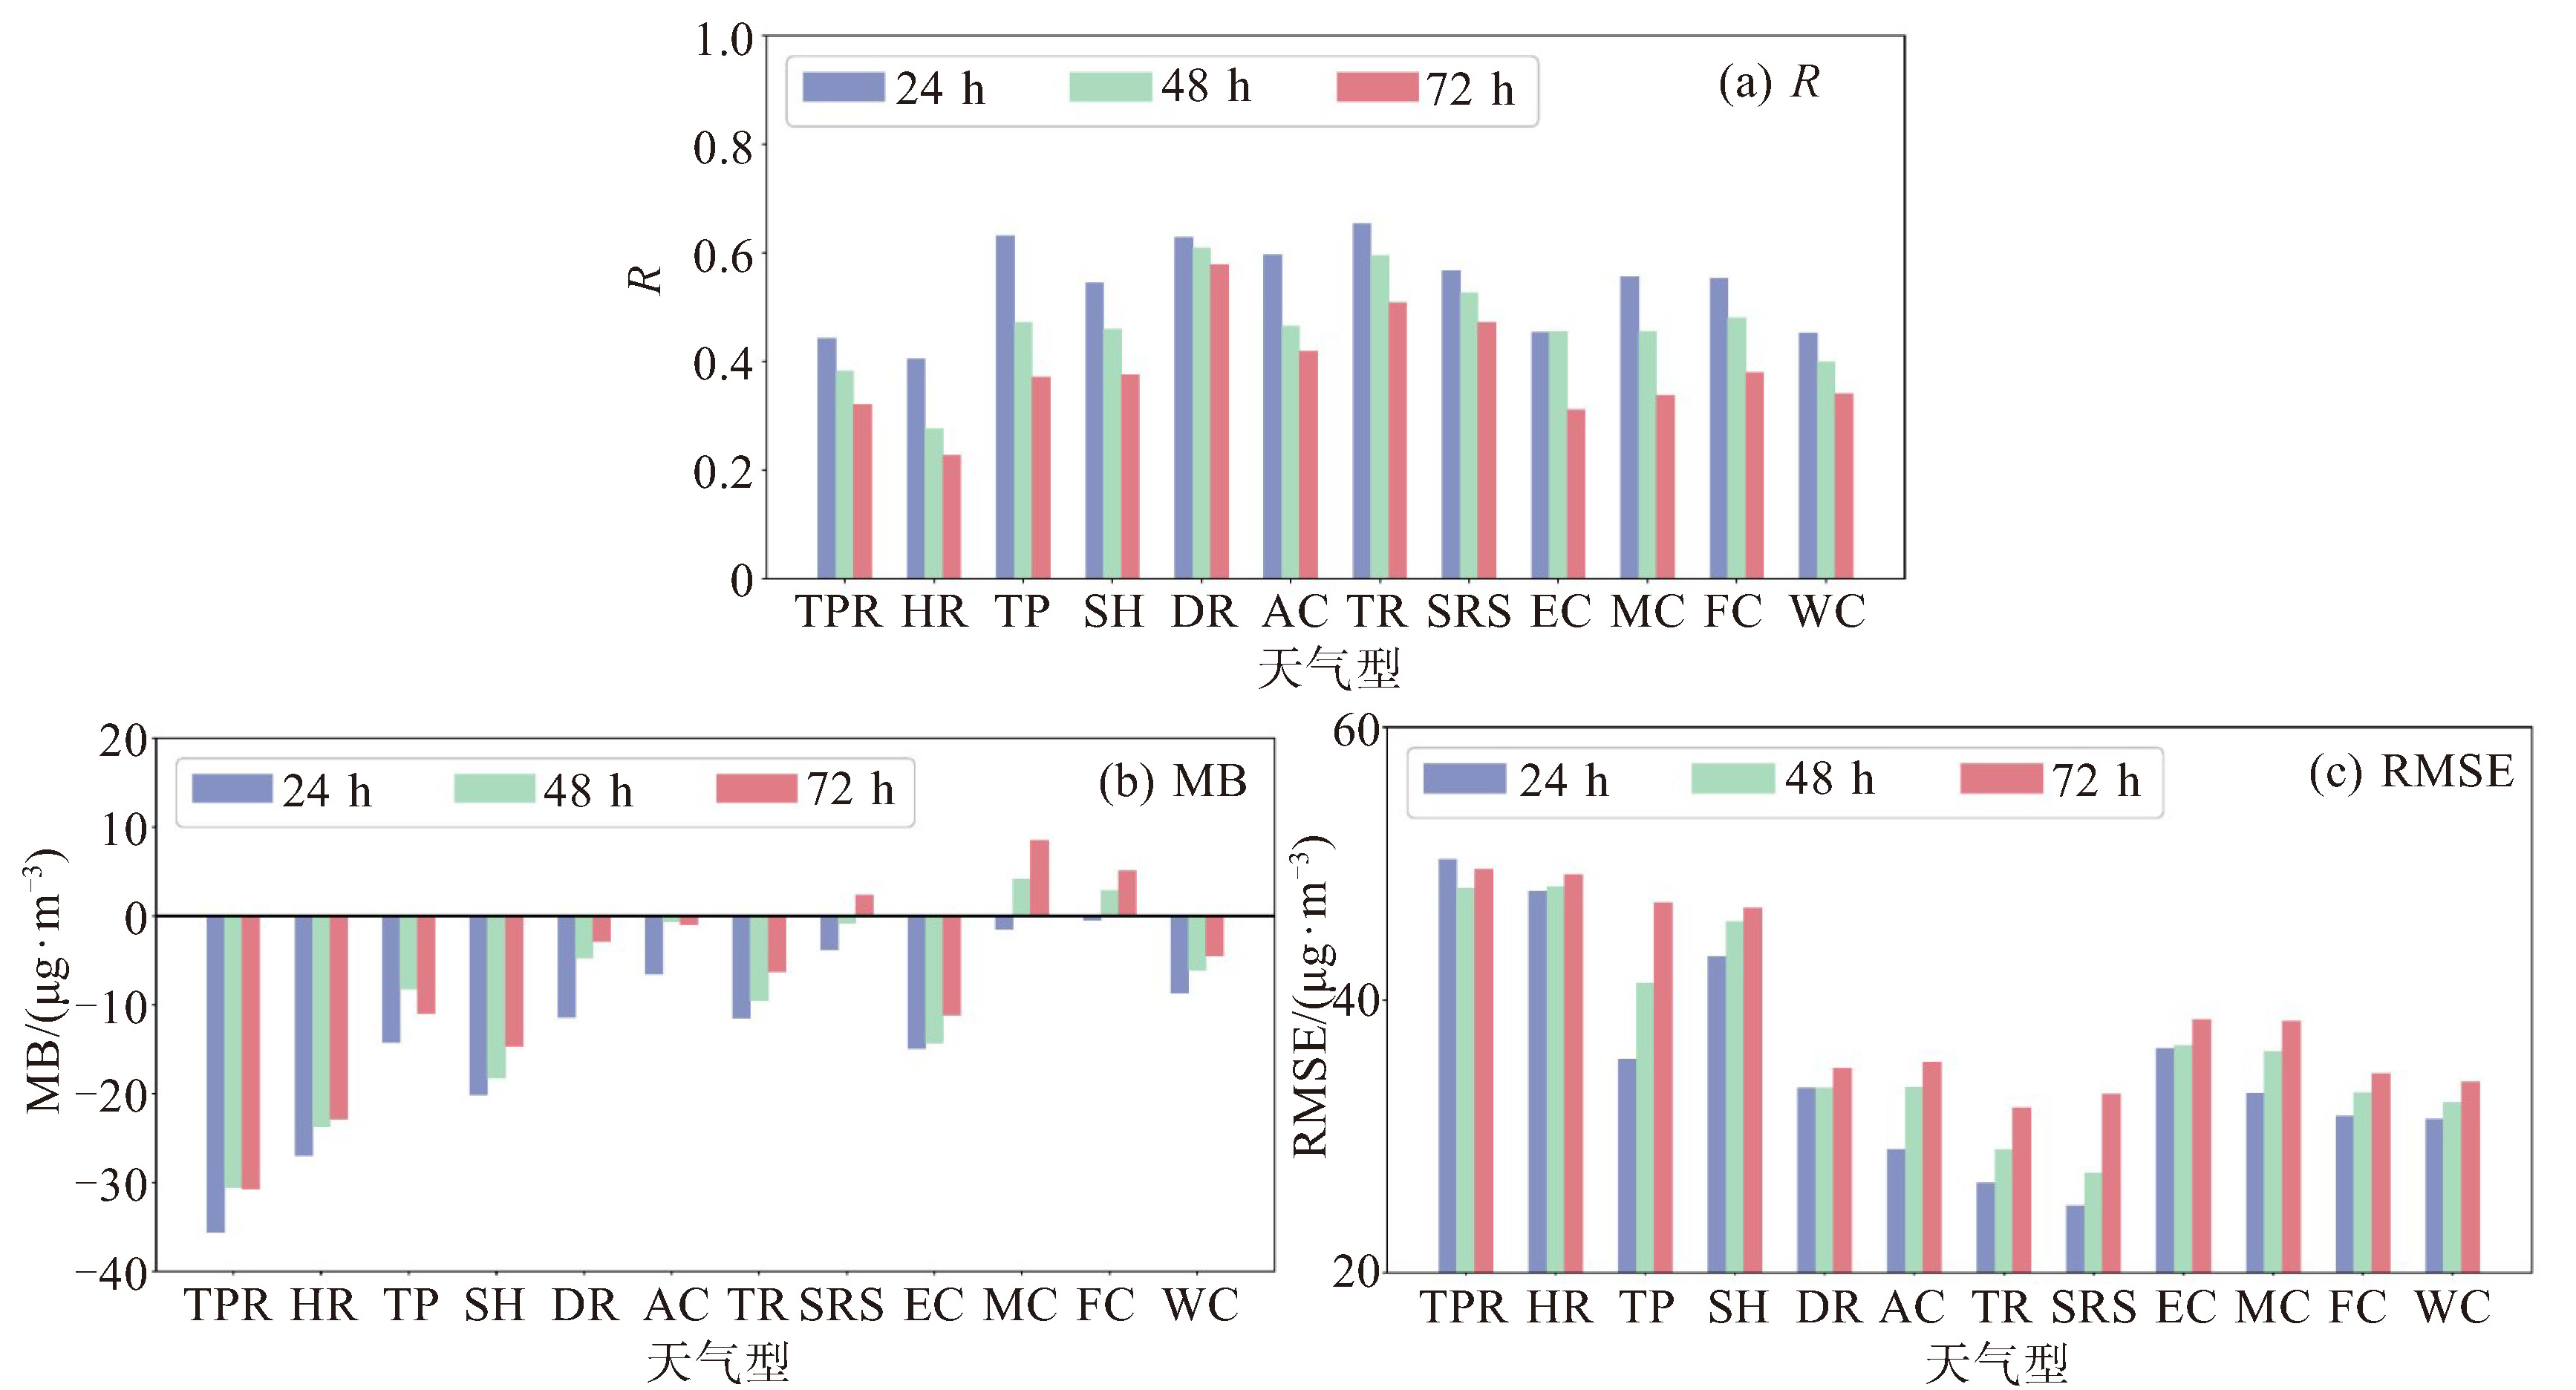
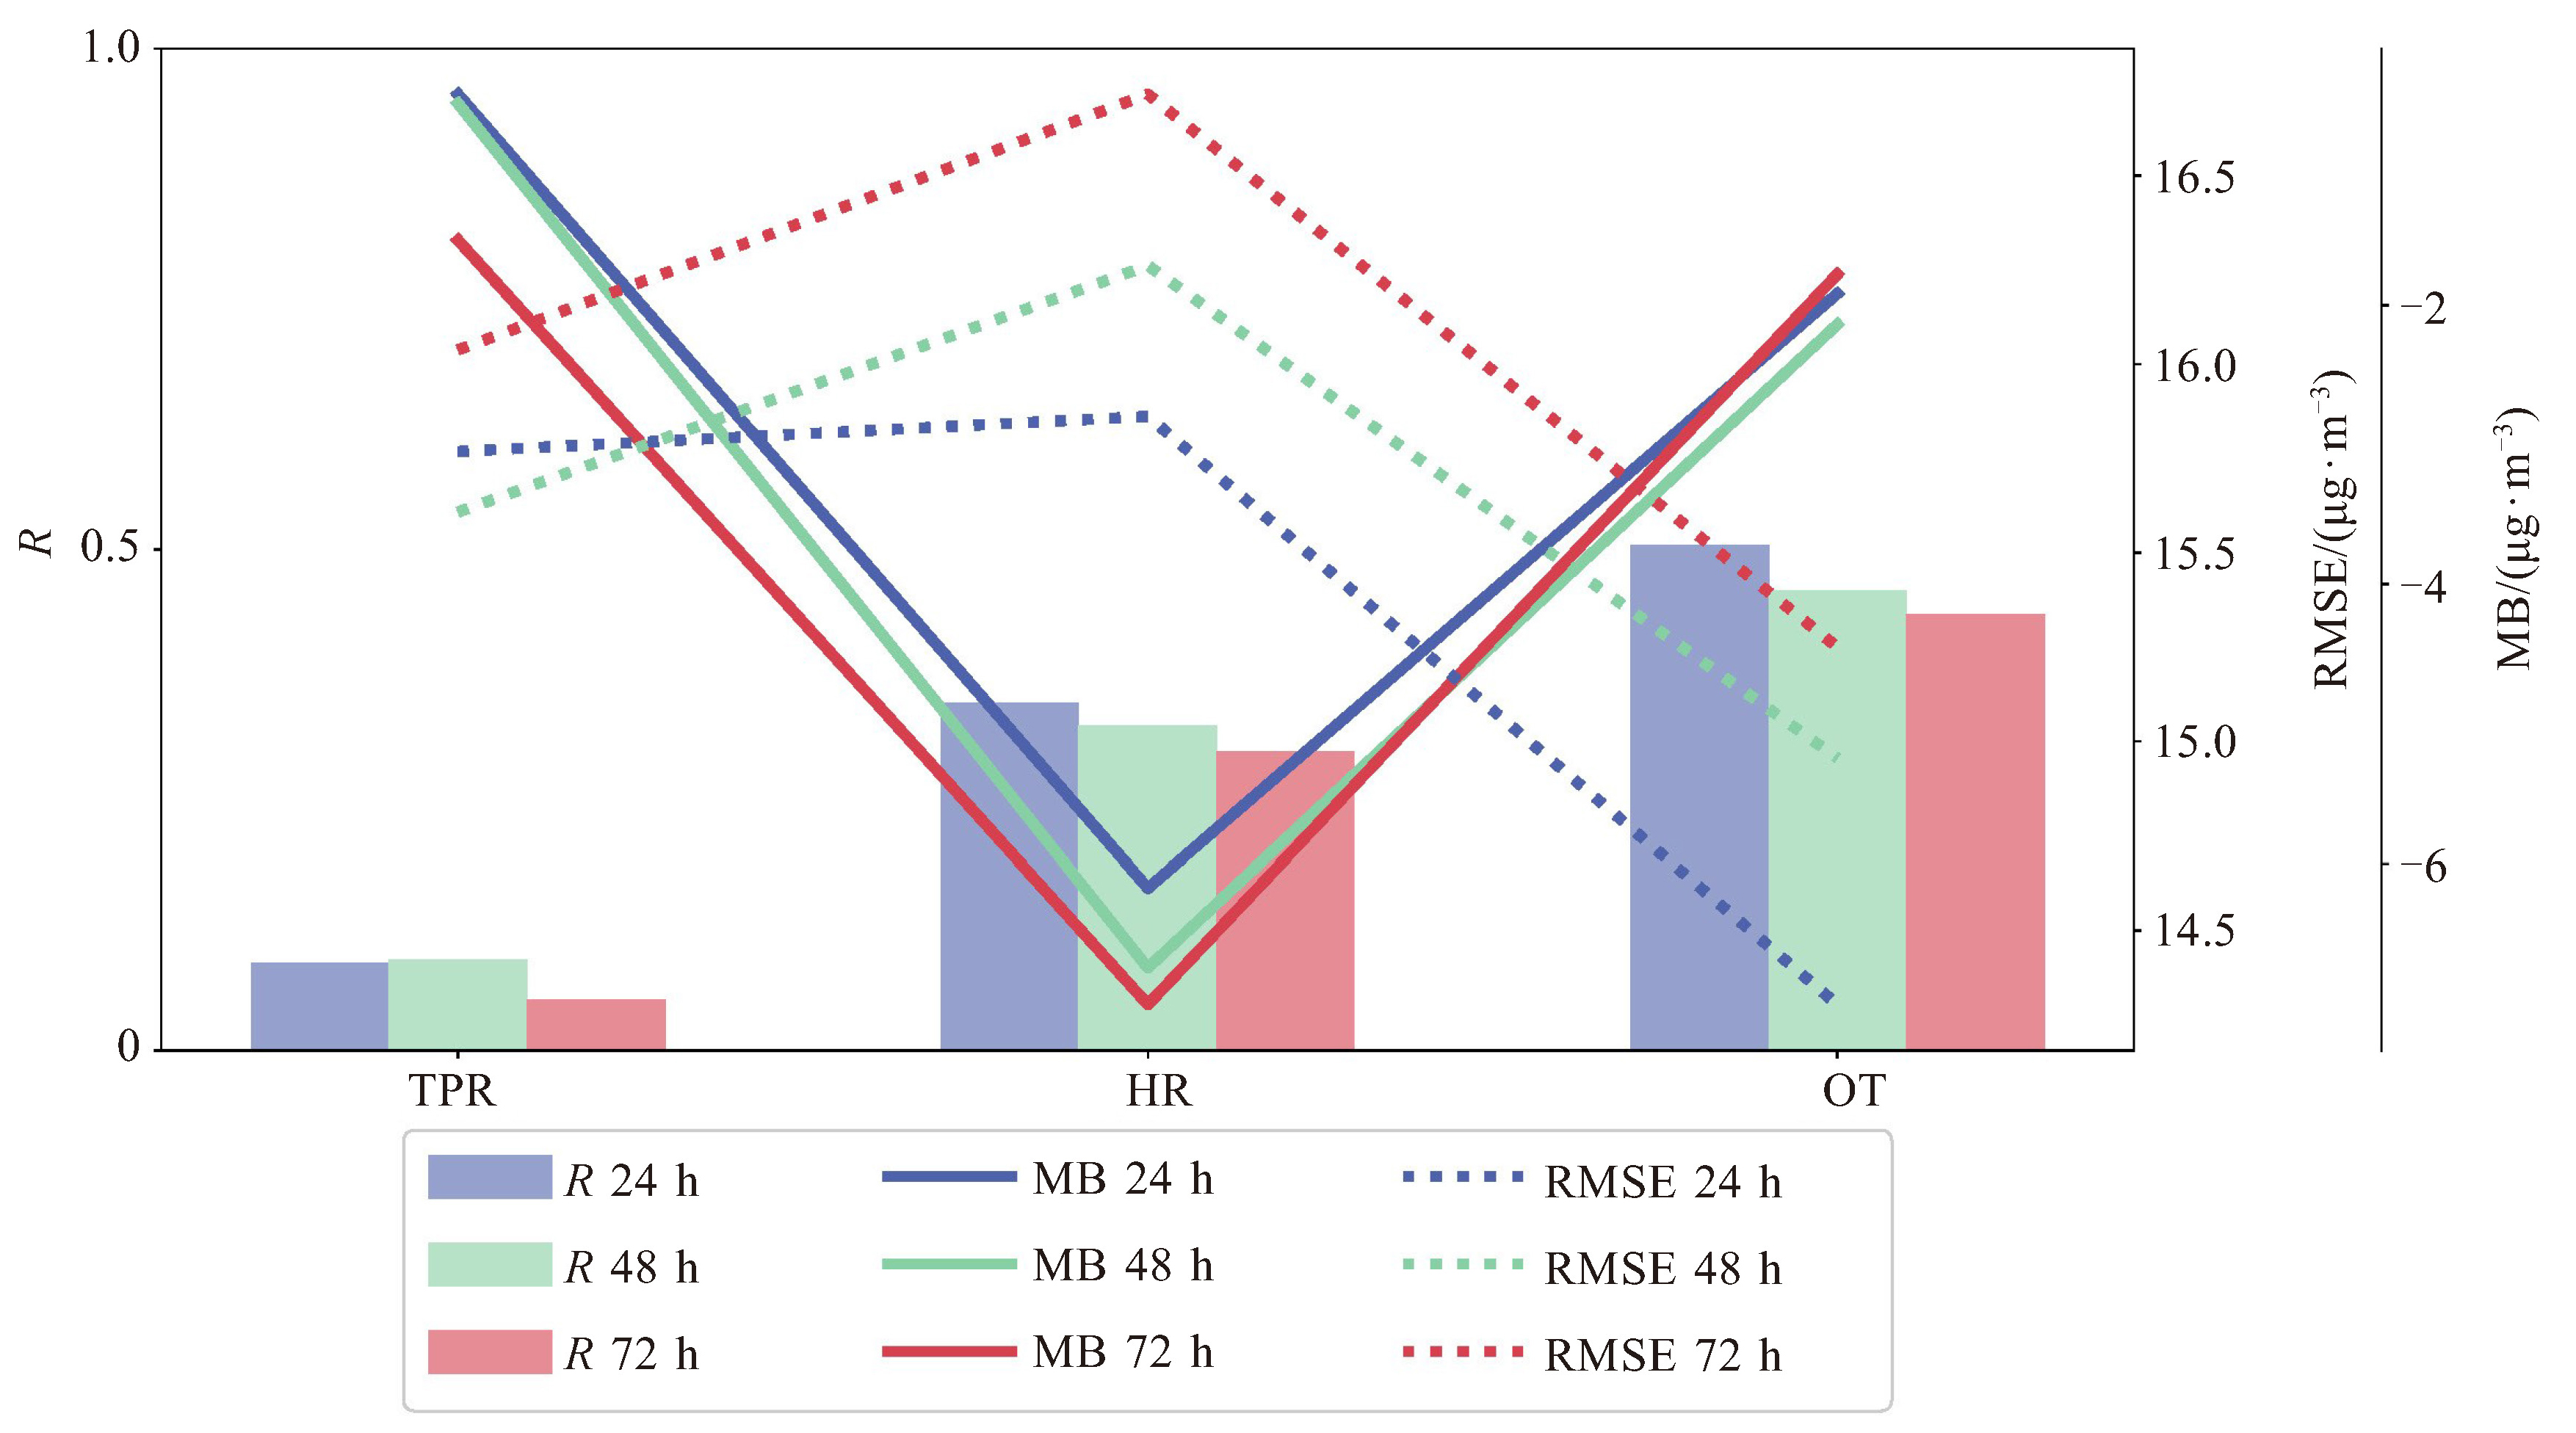
摘要: 利用2018—2020年广东省空气质量和气象要素监测数据、再分析资料、CMA模式预报资料和客观天气分型方法,开展不同天气型下华南区域大气成分数值模式系统(GRACEs)臭氧预报性能评估及其误差来源分析。结果表明:(1)GRACEs模式对O3_8h浓度趋势预报较好,但对O3_8h及其前体物NO2浓度预报值总体偏低,其中NO2浓度预报偏差更显著。(2)在台风外围+冷高压脊(TPR)和弱冷高压脊(HR)天气型下,臭氧平均浓度和臭氧污染城次概率最高,且模式对此类型天气下O3_8h浓度的预报能力亦最差。NO2预报偏差是导致O3_8h浓度预报偏差的重要原因,而CMA模式对边界层气象要素预报值的偏差可进一步导致O3_8h浓度预报偏低。(3)GRACEs模式对臭氧污染的漏报率较高,相对于整体预报水平,在TPR天气型下GRACEs模式对NO2浓度预报偏低程度更大,HR天气型下模式对2 m气温预报负偏差也更明显。(4)从空间分布来看,GRACEs模式对广东省东西两翼城市O3_8h浓度预报效果较好,而GRACEs模式对NO2浓度和CMA模式对全省21个城市2 m气温预报偏低的分布差异是导致O3_8h浓度预报效果分布差异的重要原因。Abstract: Based on the observed data of air quality and meteorological elements, reanalysis data and CMA model forecast products of Guangdong during 2018-2020, along with an objective classification method, this study conducts a comprehensive evaluation of the ozone forecasting performance and error source analysis of the Guangzhou Regional Atmospheric Composition and Environment Forecasting System (GRACEs). The key findings are as follows: (1) The GRACEs system forecast the trend of O3_8h concentration relatively well, but systematically underestimated both the concentrations of O3_8h and its precursor NO2, with the NO2 bias being particularly pronounced. (2) Under the control of typhoon periphery combined with cold high ridge (TPR) and weak cold high ridge (HR), the average ozone concentration and the rate of cities over standard were highest, while the model's skill in forecasting O3_8h was worst. The forecast deviation of NO2 concentration was an important reason for the O3_8h concentration bias, and the forecast deviation of boundary layer meteorological elements from CMA model might further lead to the underestimation of O3_8h concentration. (3) The GRACEs model had a high omission rate for ozone pollution. Compared with the overall dataset, a larger negative forecasting deviation of NO2 concentration appeared under the control of TPR, and the negative bias in 2 m temperature became more pronounced under the HR conditions. (4) As for the spatial distribution, GRACEs delivered superior O3_8h forecasts of O3_8h concentration over the eastern and western wings of Guangdong. The distinct patterns of the negative NO2 concentration forecasting deviation by GRACEs and 2 m temperature by the CMA model were the important reasons for the distribution difference of O3_8h concentration forecast skill.
-

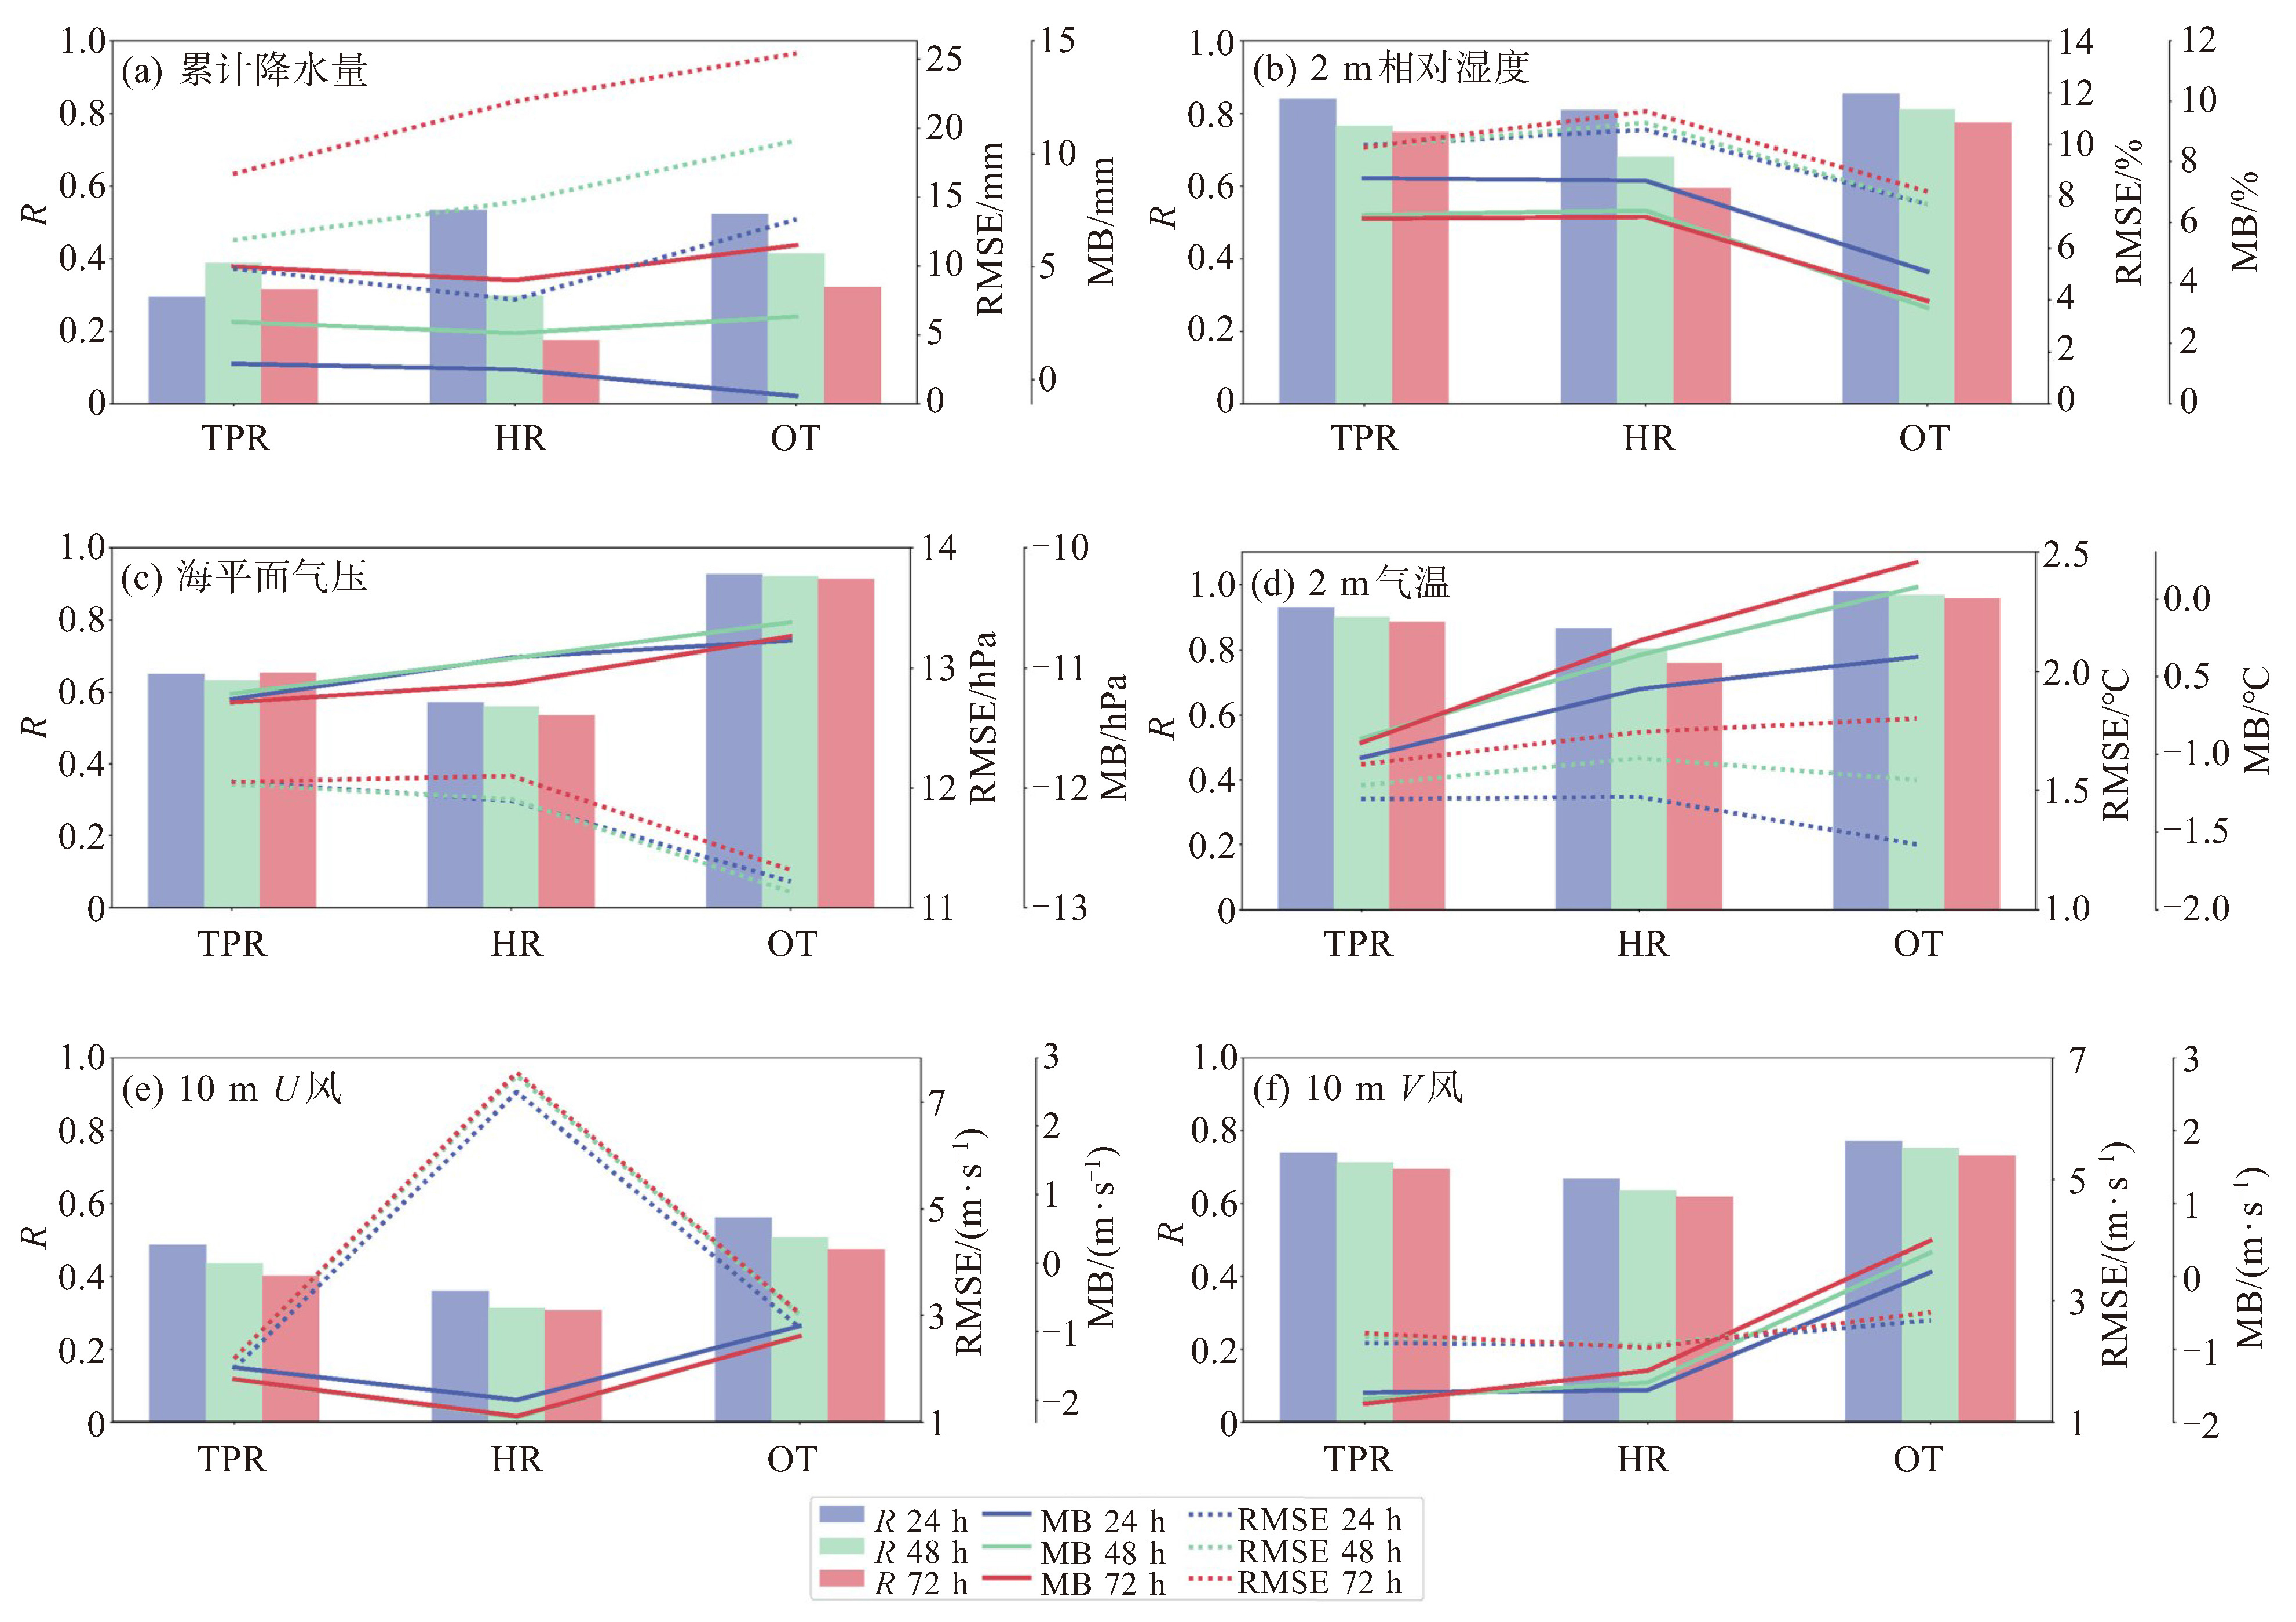
图 6 2018—2020不同天气型下广东省CMA模式累计降水量(a)、2m相对湿度(b)、海平面气压(c)、2 m气温(d)、10 m U风(e)和10 m V风(f)预报效果评估

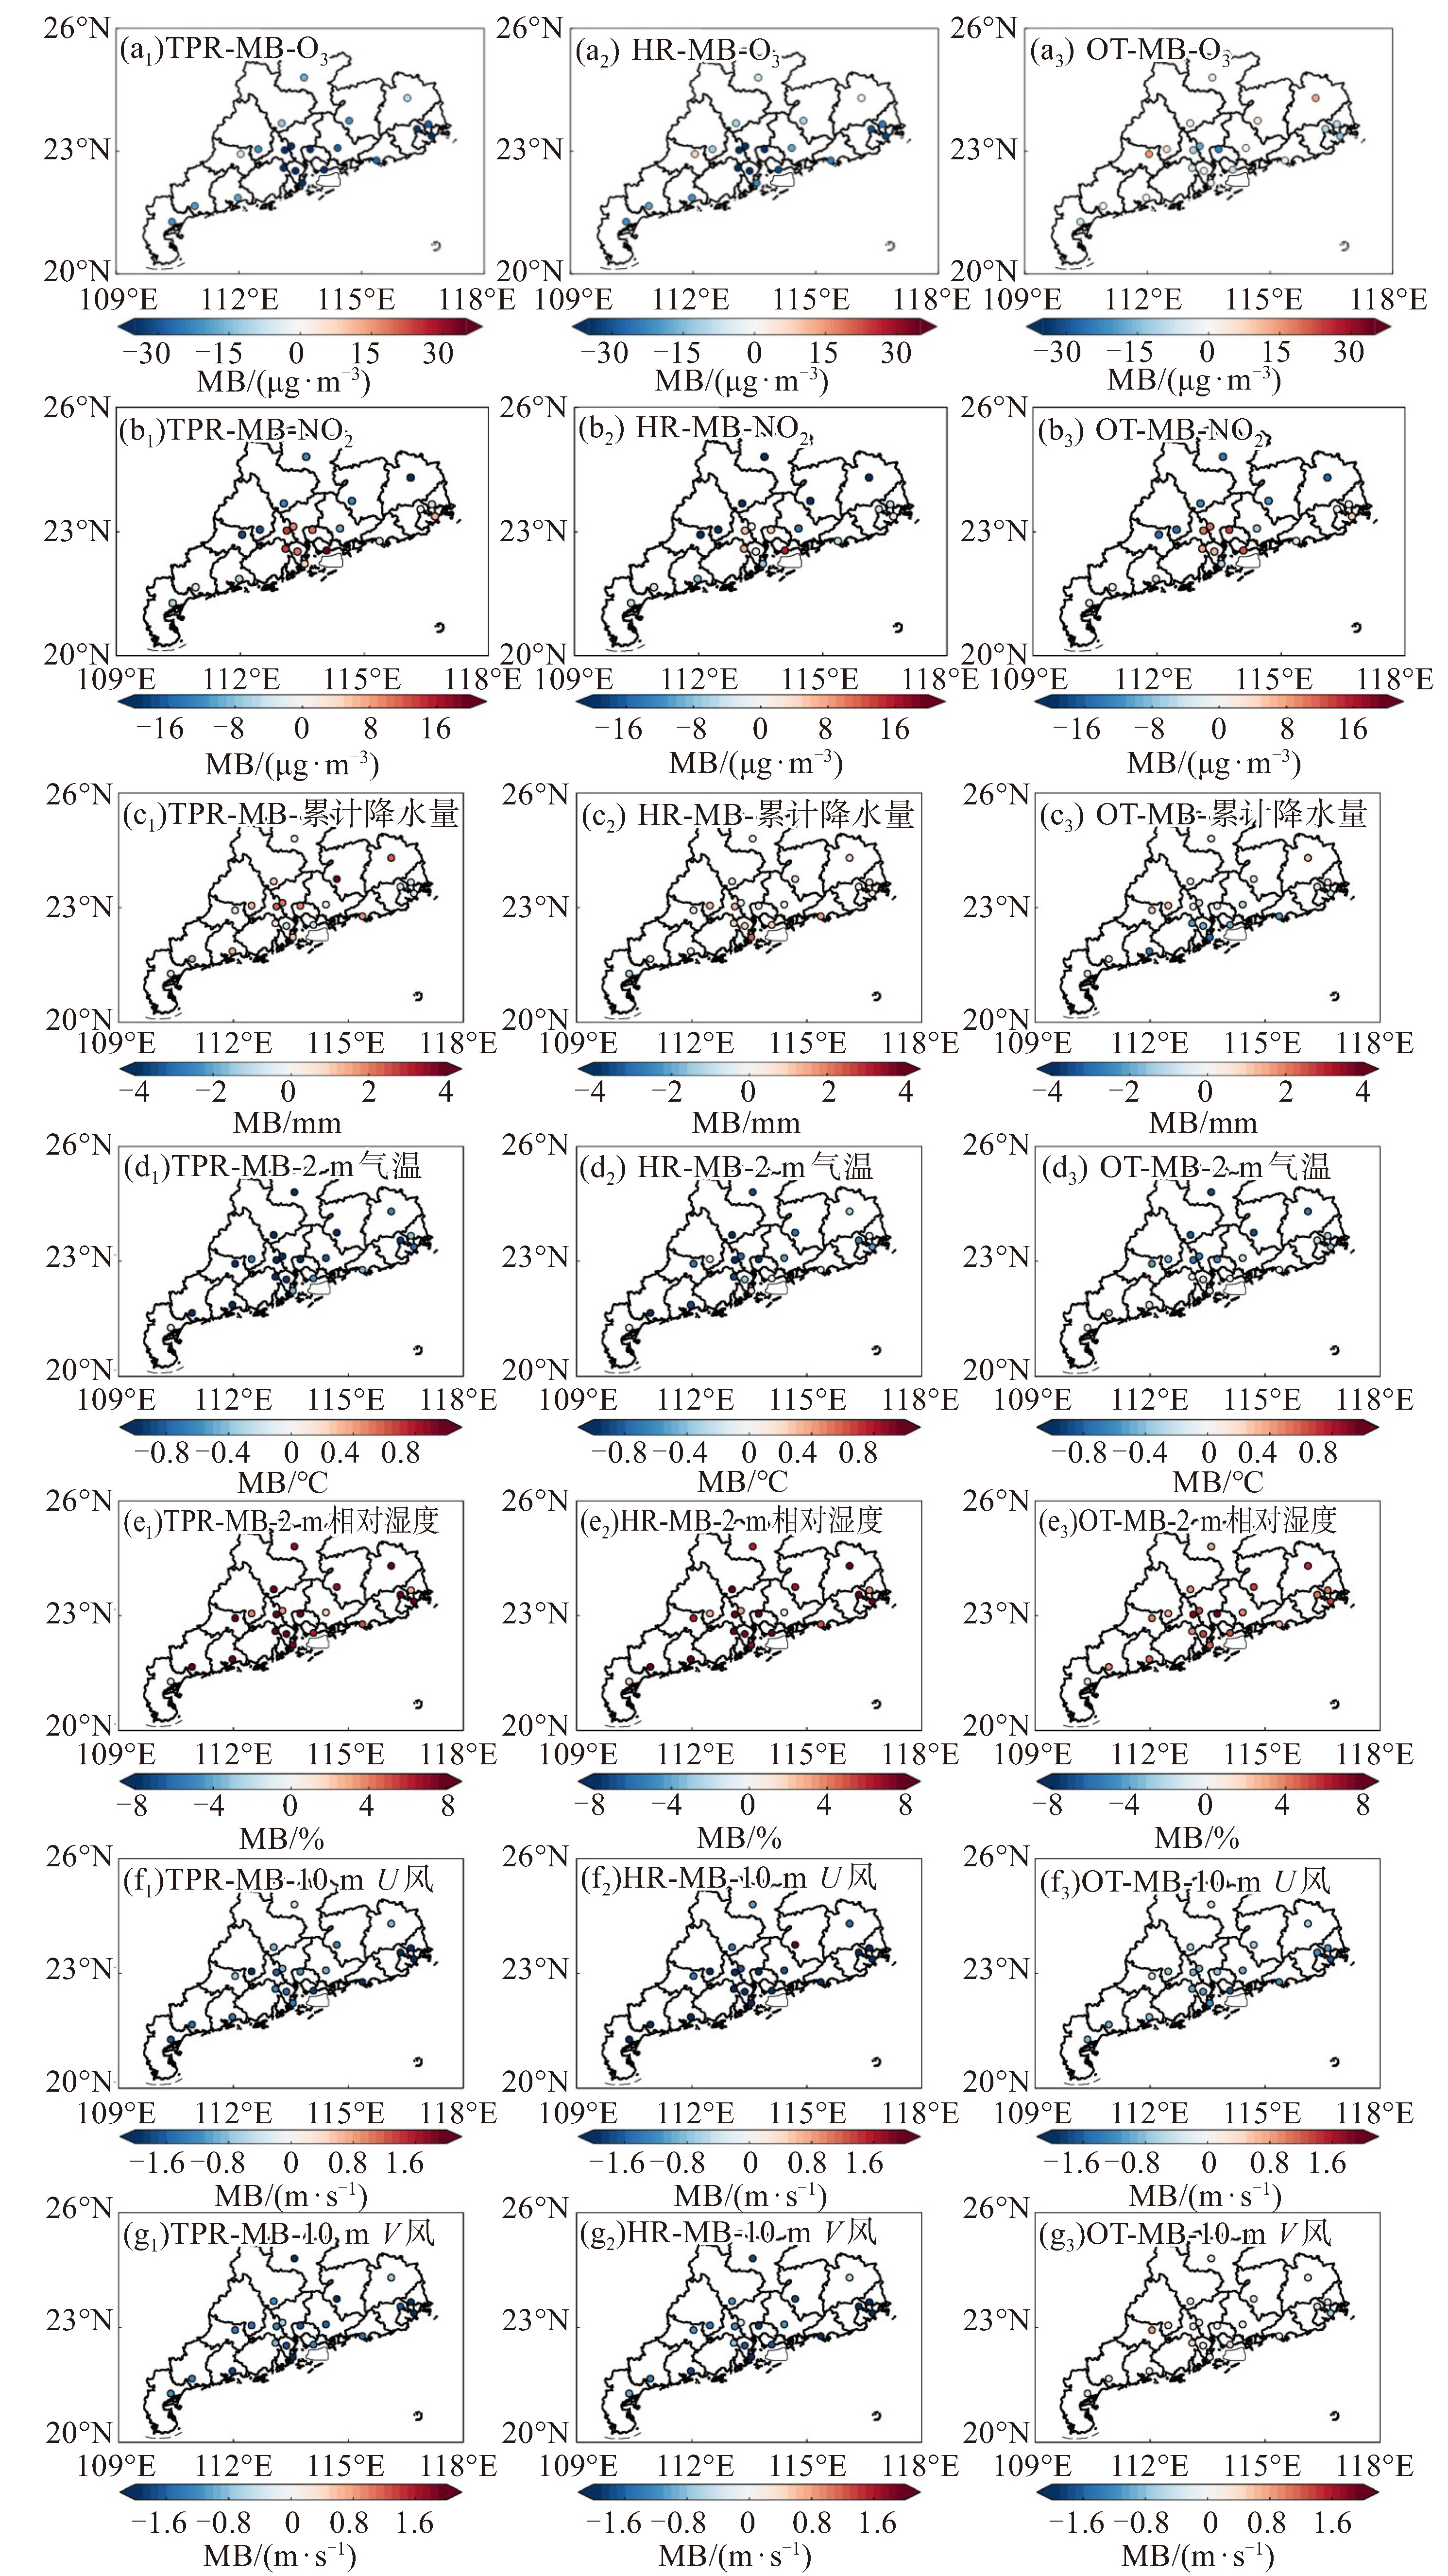
图 7 2018—2020年不同天气型下广东省21个城市GRACEs模式O3_8h浓度(a)、NO2浓度(b)和CMA模式累计降水量(c)、2 m气温(d)、2 m相对湿度(e)、10 m U风(e)和10 m V风(f)预报偏差分布。从左至右分别代表TPR、HR和OT天气型。

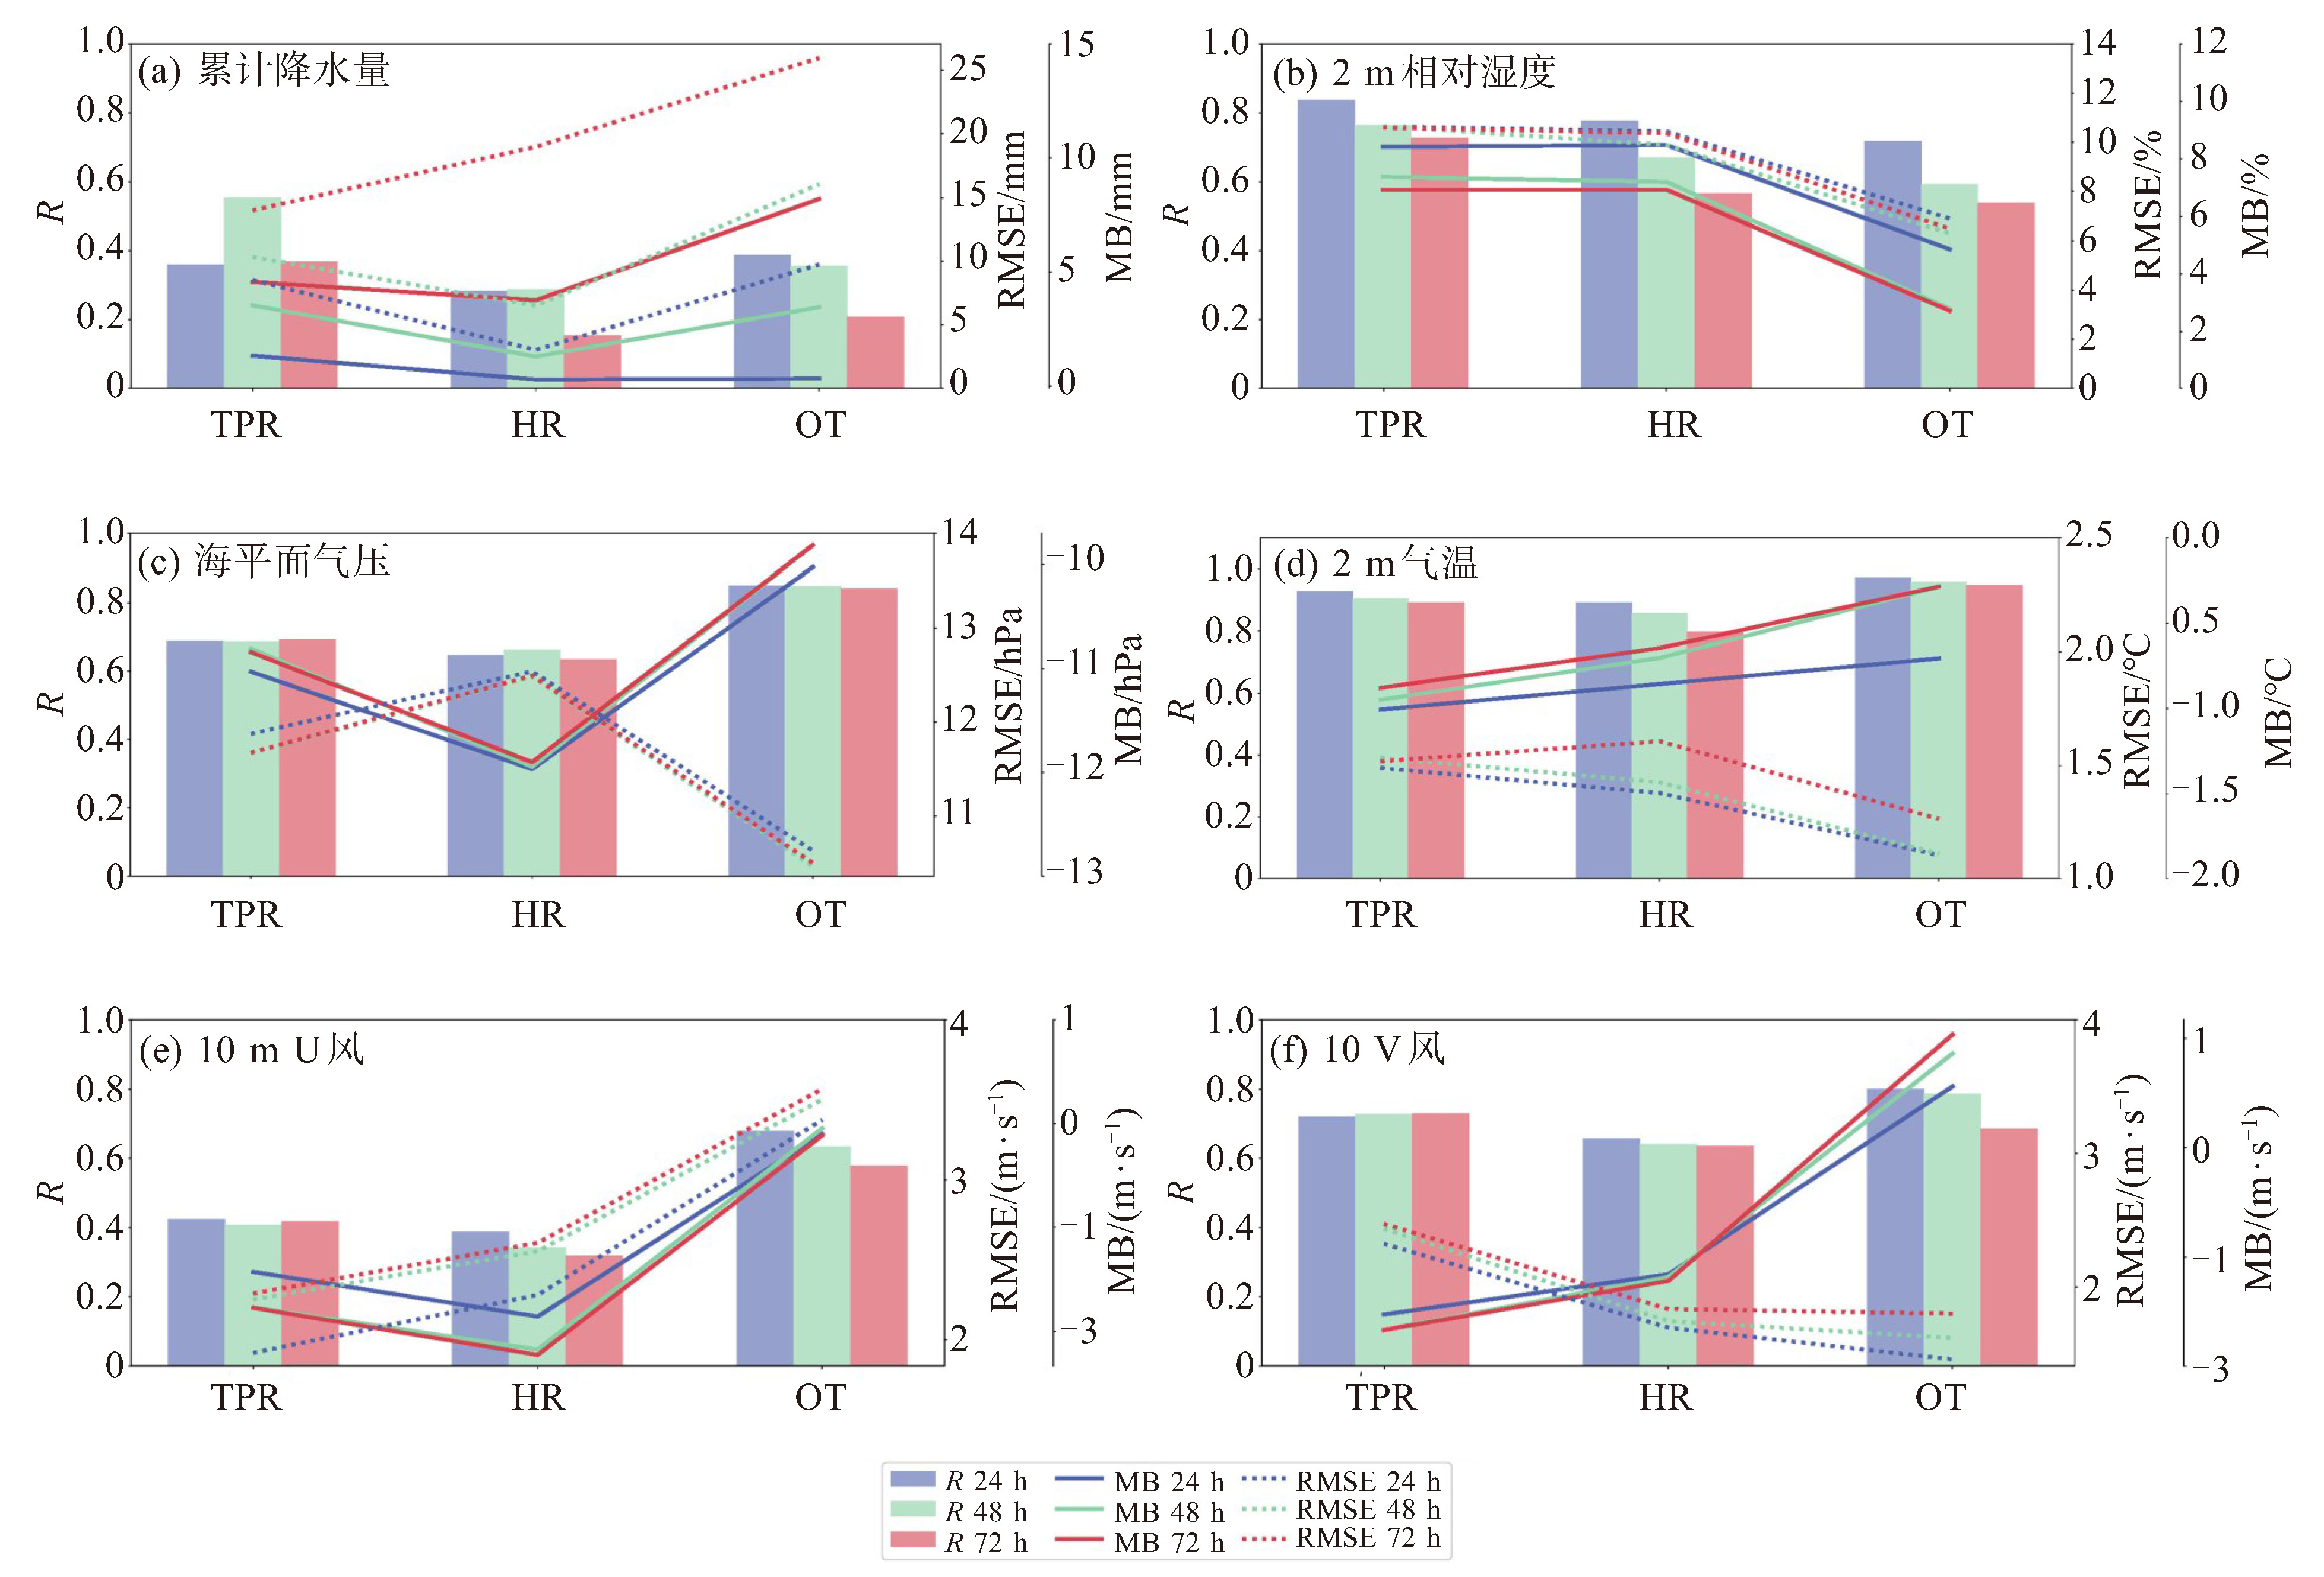
图 9 2018—2020年漏报情况下广东省CMA模式累计降水量(a)、2 m相对湿度(b)、海平面气压(c)、2 m气温(d)、10 m U风(e)和10 m V风(f)预报效果评估

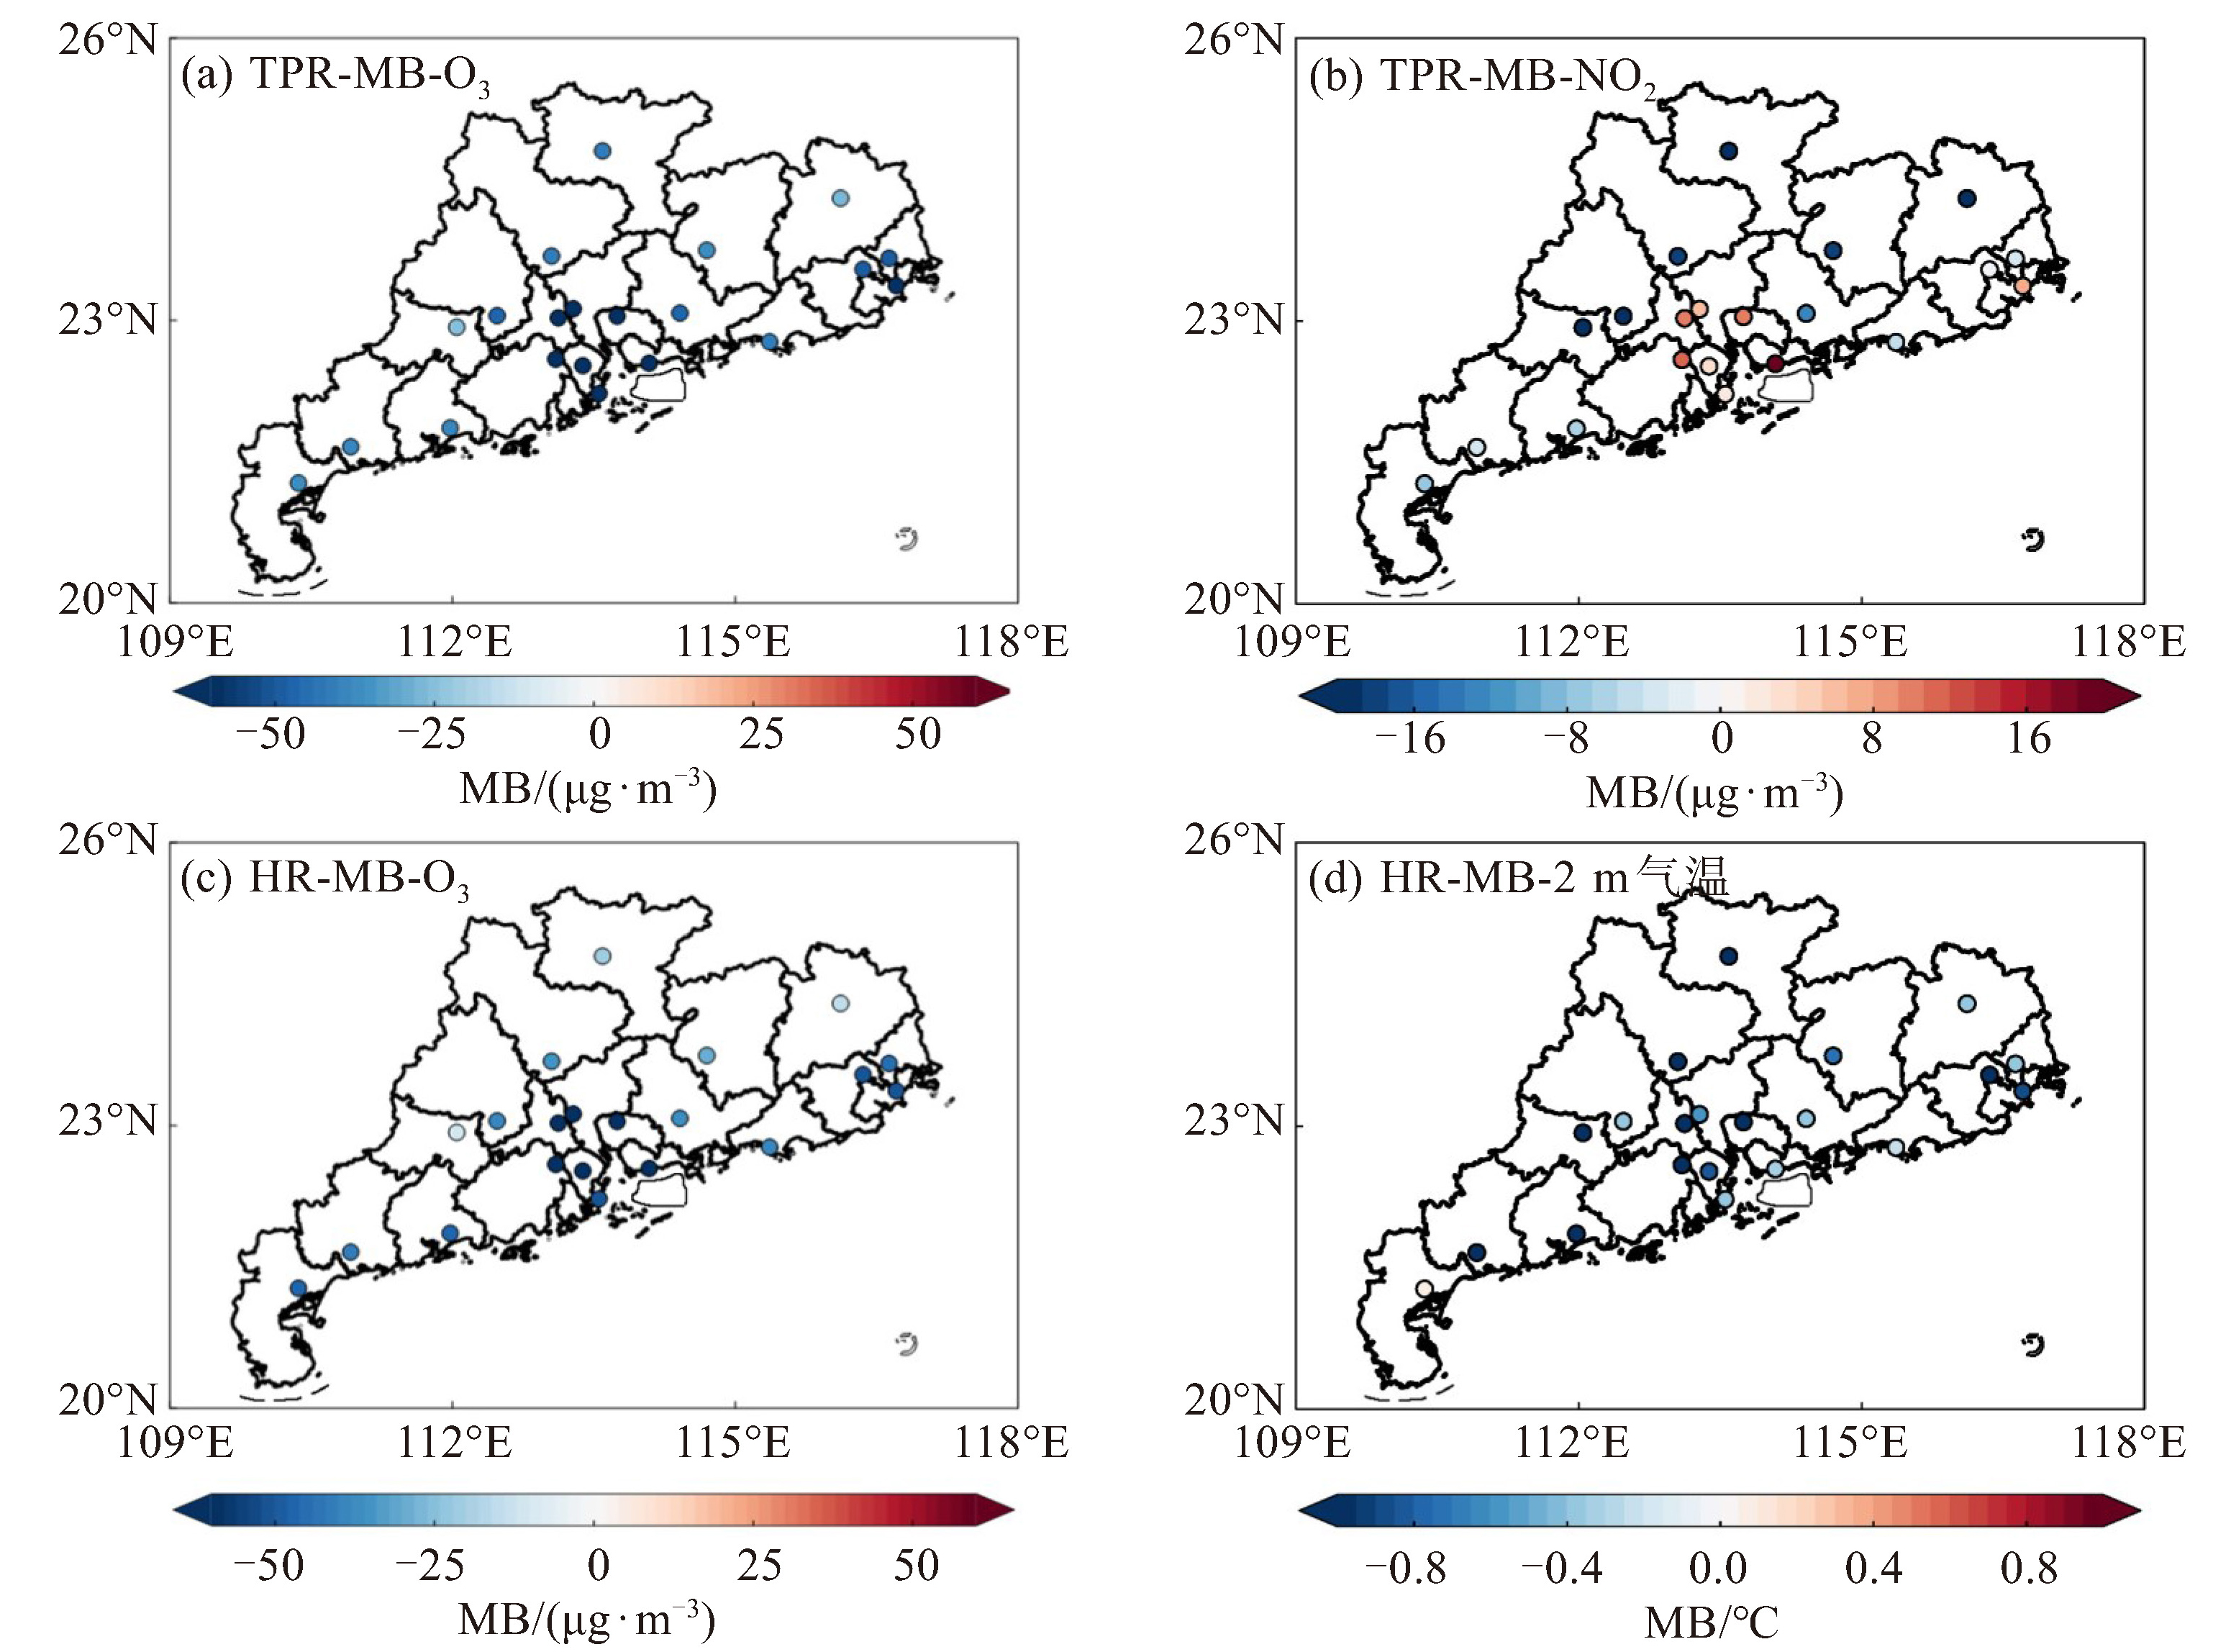
图 10 2018—2020年漏报情况下广东省21个城市TPR天气型GRACEs模式O3_8h(a)、NO2(b)预报值偏差和HR天气型GRACEs模式O3_8h浓度(c)、CMA模式2 m气温(d)预报偏差分布
表 1 CMA模式和CMAQ模式的网格设置
CMA模式 CMAQ模式 嵌套区域 网格数 网格距/km 中心经纬度 嵌套区域 网格数 网格距/km 中心经纬度 1 283×184 27 121.86 °E, 23.05 °N 1 182×138 27 121.86 °E, 23.05 °N 2 233×163 9 117.55 °E, 23.02 °N 2 98×74 9 117.55 °E, 23.02 °N 3 172×130 3 113.38 °E, 22.93 °N 3 152×110 3 113.38 °E, 22.93 °N  下载: 导出CSV
表 2 2018—2020年广东省GRACEs模式预报结果检验
要素 平均浓度/(μg·m-3) R RMSE/(μg·m-3) MB/(μg·m-3) 24 h 48 h 72 h 24 h 48 h 72 h 24 h 48 h 72 h O3_8h 90 0.60 0.51 0.43 35.9 37.8 40.0 -11.8 -7.9 -6.2 NO2 25 0.48 0.43 0.41 14.6 15.2 15.5 -2.4 -2.7 -2.4
下载: 导出CSV
表 3 2018—2020年广东省GRACEs模式臭氧污染漏报率
天气型 污染总城次/个 24 h 48 h 72 h TPR 290 99.3% 97.3% 97.6% HR 126 99.0% 95.8% 96.9% OT 668 90.8% 85.1% 88.2%
下载: 导出CSV
-
[1] 程育恺, 戴海夏, 张蕴晖, 等. 长三角地区2017-2020年臭氧浓度时空分布与人群健康效益评估[J]. 环境科学, 2023, 44(2): 719-729. [2] 王效科, 张丹红, 耿春梅, 等. 臭氧污染对我国粮食安全影响及其减缓应对措施[J]. 环境科学学报, 2022, 42(5): 37-48. [3] LEFOHN A S, MALLEY C S, SMITH L, et al. Tropospheric ozone assessment report: Global ozone metrics for climate change, human health, and crop/ecosystem research[J]. Elem Sci Anth, 2018, 6: 28. [4] 沈劲, 杨土士, 晏平仲, 等. 广东省臭氧污染特征及其成因分析[J]. 环境科学与技术, 2020, 43(12): 90-95. [5] 陆克定, 张远航, 苏杭, 等. 珠江三角洲夏季臭氧区域污染及其控制因素分析[J]. 中国科学: 化学, 2010, 40(4): 407-420. [6] 沈劲, 陈多宏, 汪宇, 等. 基于情景分析的珠三角臭氧与前体物排放关系研究[J]. 生态环境学报, 2018, 27(10): 1 925-1 932. [7] 张蕊, 孙雪松, 王裕, 等. 北京时城区夏季大气VOCs变化特征及臭氧生成潜势[J]. 环境科学, 2023, 44(4): 1 954-1 961. [8] 伍永康, 陈伟华, 颜丰华, 等. 不同传输通道下珠江三角洲臭氧与前体物非线性响应关系[J]. 环境科学, 2022, 43(1): 160-169. [9] 李光耀, 陈强, 郭文凯, 等. 基于正交试验的臭氧及其前体物的非线性响应及控制方案[J]. 环境科学, 2021, 42(2): 616-623. [10] 李婷苑, 陈靖扬, 翁佳烽, 等. 广东省臭氧污染天气型及其变化特征[J]. 中国环境科学, 2022, 42(5): 2 015-2 024. [11] 沈劲, 李婷苑, 廖彤, 等. 广东省夏秋季臭氧污染与台风的关系分析[J]. 环境科学学报, 2023, 43(1): 152-160. [12] 常炉予, 许建明, 瞿元昊, 等. 上海市臭氧污染的大气环流客观分型研究[J]. 环境科学学报, 2019, 39(1): 169-179. [13] 赵伟, 吕梦瑶, 卢清, 等. 热带气旋对珠三角秋季臭氧污染的影响[J]. 环境科学, 2022, 43(6): 2 957-2 965. [14] OUYANG S S, DENG T, LIU R, et al. Impact of a subtropical high and a typhoon on a severe ozone pollution episode in the Pearl River Delta, China[J]. Atmos Chem Phys, 2022, 22: 10 751-10 767. [15] LI T Y, WU N G, CHEN J Y, et al. Vertical exchange and cross-regional transport of lower-tropospheric ozone over Hong Kong[J]. Atmos Res, 2023, 292: 106877. [16] DENG T, WANG T, WANG S, et al. Impact of typhoon periphery on high ozone and high aerosol pollution in the Pearl River Delta region[J]. Sci Total Environ, 2019, 668: 617-630. [17] 何超, 慕航, 杨璐, 等. 中国暖季近地面臭氧浓度空间格局演变及主要气象驱动因素[J]. 环境科学, 2021, 42(9): 4 168-4 179. [18] 邓雪娇, 周秀骥, 吴兑, 等. 珠江三角洲大气气溶胶对地面臭氧变化的影响[J]. 中国科学: 地球科学, 2011, 41(1): 93-102. [19] 刘建, 吴兑, 范绍佳, 等. 前体物与气象因子对珠江三角洲臭氧污染的影响[J]. 中国环境科学, 2017, 37(3): 813-820. [20] 丁丽佳, 杨婕俐, 陈新煜, 等. 潮州市区臭氧污染变化特征及与影响因子关系分析[J]. 热带气象学报, 2023, 39(4): 474-483. [21] EJIMOFOR C S, OKORO E C, SIVLA W T. Effects of elevated humidity on stratospheric ozone content in the tropics[J]. Int J Phys Sci, 2021, 15(4): 182-193. [22] 李婷苑, 陈靖扬, 龚宇, 等. 2022年广东省冬季一次臭氧污染过程的气象成因及潜在源区分析[J]. 环境科学, 2023, 44(7): 3 695-3 704. [23] 周德荣, 刘祎, 高健, 等. 中国东部地区典型臭氧污染过程防控敏感性及减排情景研究[J]. 大气科学学报, 2023, 46(5): 667-678. [24] 张小玲, 雷雨, 王聪聪, 等. 四川盆地城市群臭氧污染的时空精细演变特征的观测与模拟研究[J]. 中国环境科学, 2024, 44(1): 1-14. [25] 汪海恒, 沈傲, 许亦非, 等. 粤北地区一次臭氧污染过程分析及数值模拟[J]. 环境科学学报, 2022, 42(10): 49-61. [26] 邓涛, 邓雪娇, 吴兑, 等. 珠三角灰霾数值预报模式于业务运行评估[J]. 气象科技进展, 2012, 2(6): 38-44. [27] 李婷苑, 吴乃庚, 邓雪娇, 等. 华南区域大气成分数值模式GRACEs预报性能评估[J]. 热带气象学报, 2021, 37(2): 207-217. [28] 麦健华, 于玲玲, 邓涛, 等. 基于GRAPES-CMAQ的中山市空气质量预报系统预报效果评估[J]. 热带气象学报, 34(1): 78-86. [29] 邓雪娇, 邓涛, 麦博儒, 等. 华南区域大气成分业务数值预报GRACEs模式系统[J]. 热带气象学报, 2016, 32(6): 900-907. [30] LI Y, ZHAO X J, DENG X J, et al. The impact of peripheral circulation characteristics of typhoon on sustained ozone episodes over the Pearl River Delta region, China[J]. Atmos Chem Phys, 2022, 22(6): 3 861-3 873. [31] LI T Y, DENG X J, LI Y, et al. Transport paths and vertical exchange characteristics of haze pollution in Southern China[J]. Sci Total Environ, 2018, 625: 1 074-1 087. [32] WANG N, HUANG X, XU J W, et al. Typhoon-boosted biogenic emission aggravates cross-regional ozone pollution in China[J]. Sci Adv, 2022, 8(2): eabl6166. [33] HE G W, DENG T, WU D, et al. Characteristics of boundary layer ozone and its effect on surface ozone concentration in Shenzhen, China: A case study[J]. Sci Total Environ, 2021, 791(2): 148044. [34] LIU C X, HE C, WANG Y M, et al. Characteristics and mechanism of a persistent ozone pollution event in Pearl River Delta induced by typhoon and subtropical high[J]. Atmos Environ, 2023, 310(93): 119964. [35] JAÉN C, UDINA M, BECH J. Analysis of two heat wave driven ozone episodes in Barcelona and surrounding region: Meteorological and photochemical modeling[J]. Atmos Environ, 2021, 246: 118037. [36] CHEN L, ZHU J, LIAO H, et al. Meteorological influences on PM2.5 and O3 trends and associated health burden since China's clean air actions[J]. Sci Total Environ, 2020, 744: 140837. [37] 潘巧英, 李婷苑, 陈靖扬, 等. 基于GRAPES模式佛山市臭氧污染气象指数的构建和预报[J]. 环境科学学报, 2023, 43(1): 140-151. -

 点击查看大图
计量
- 文章访问数: 3
- HTML全文浏览量: 4
- PDF下载量: 0
- 被引次数: 0
 粤公网安备 4401069904700003号