


Macro- and Microphysical Characteristics of Extreme Rainfall Producing-convective Clouds Observed by the Nanjing Dual-polarimetric Radar During the 2020-2022 Warm Seasons
-
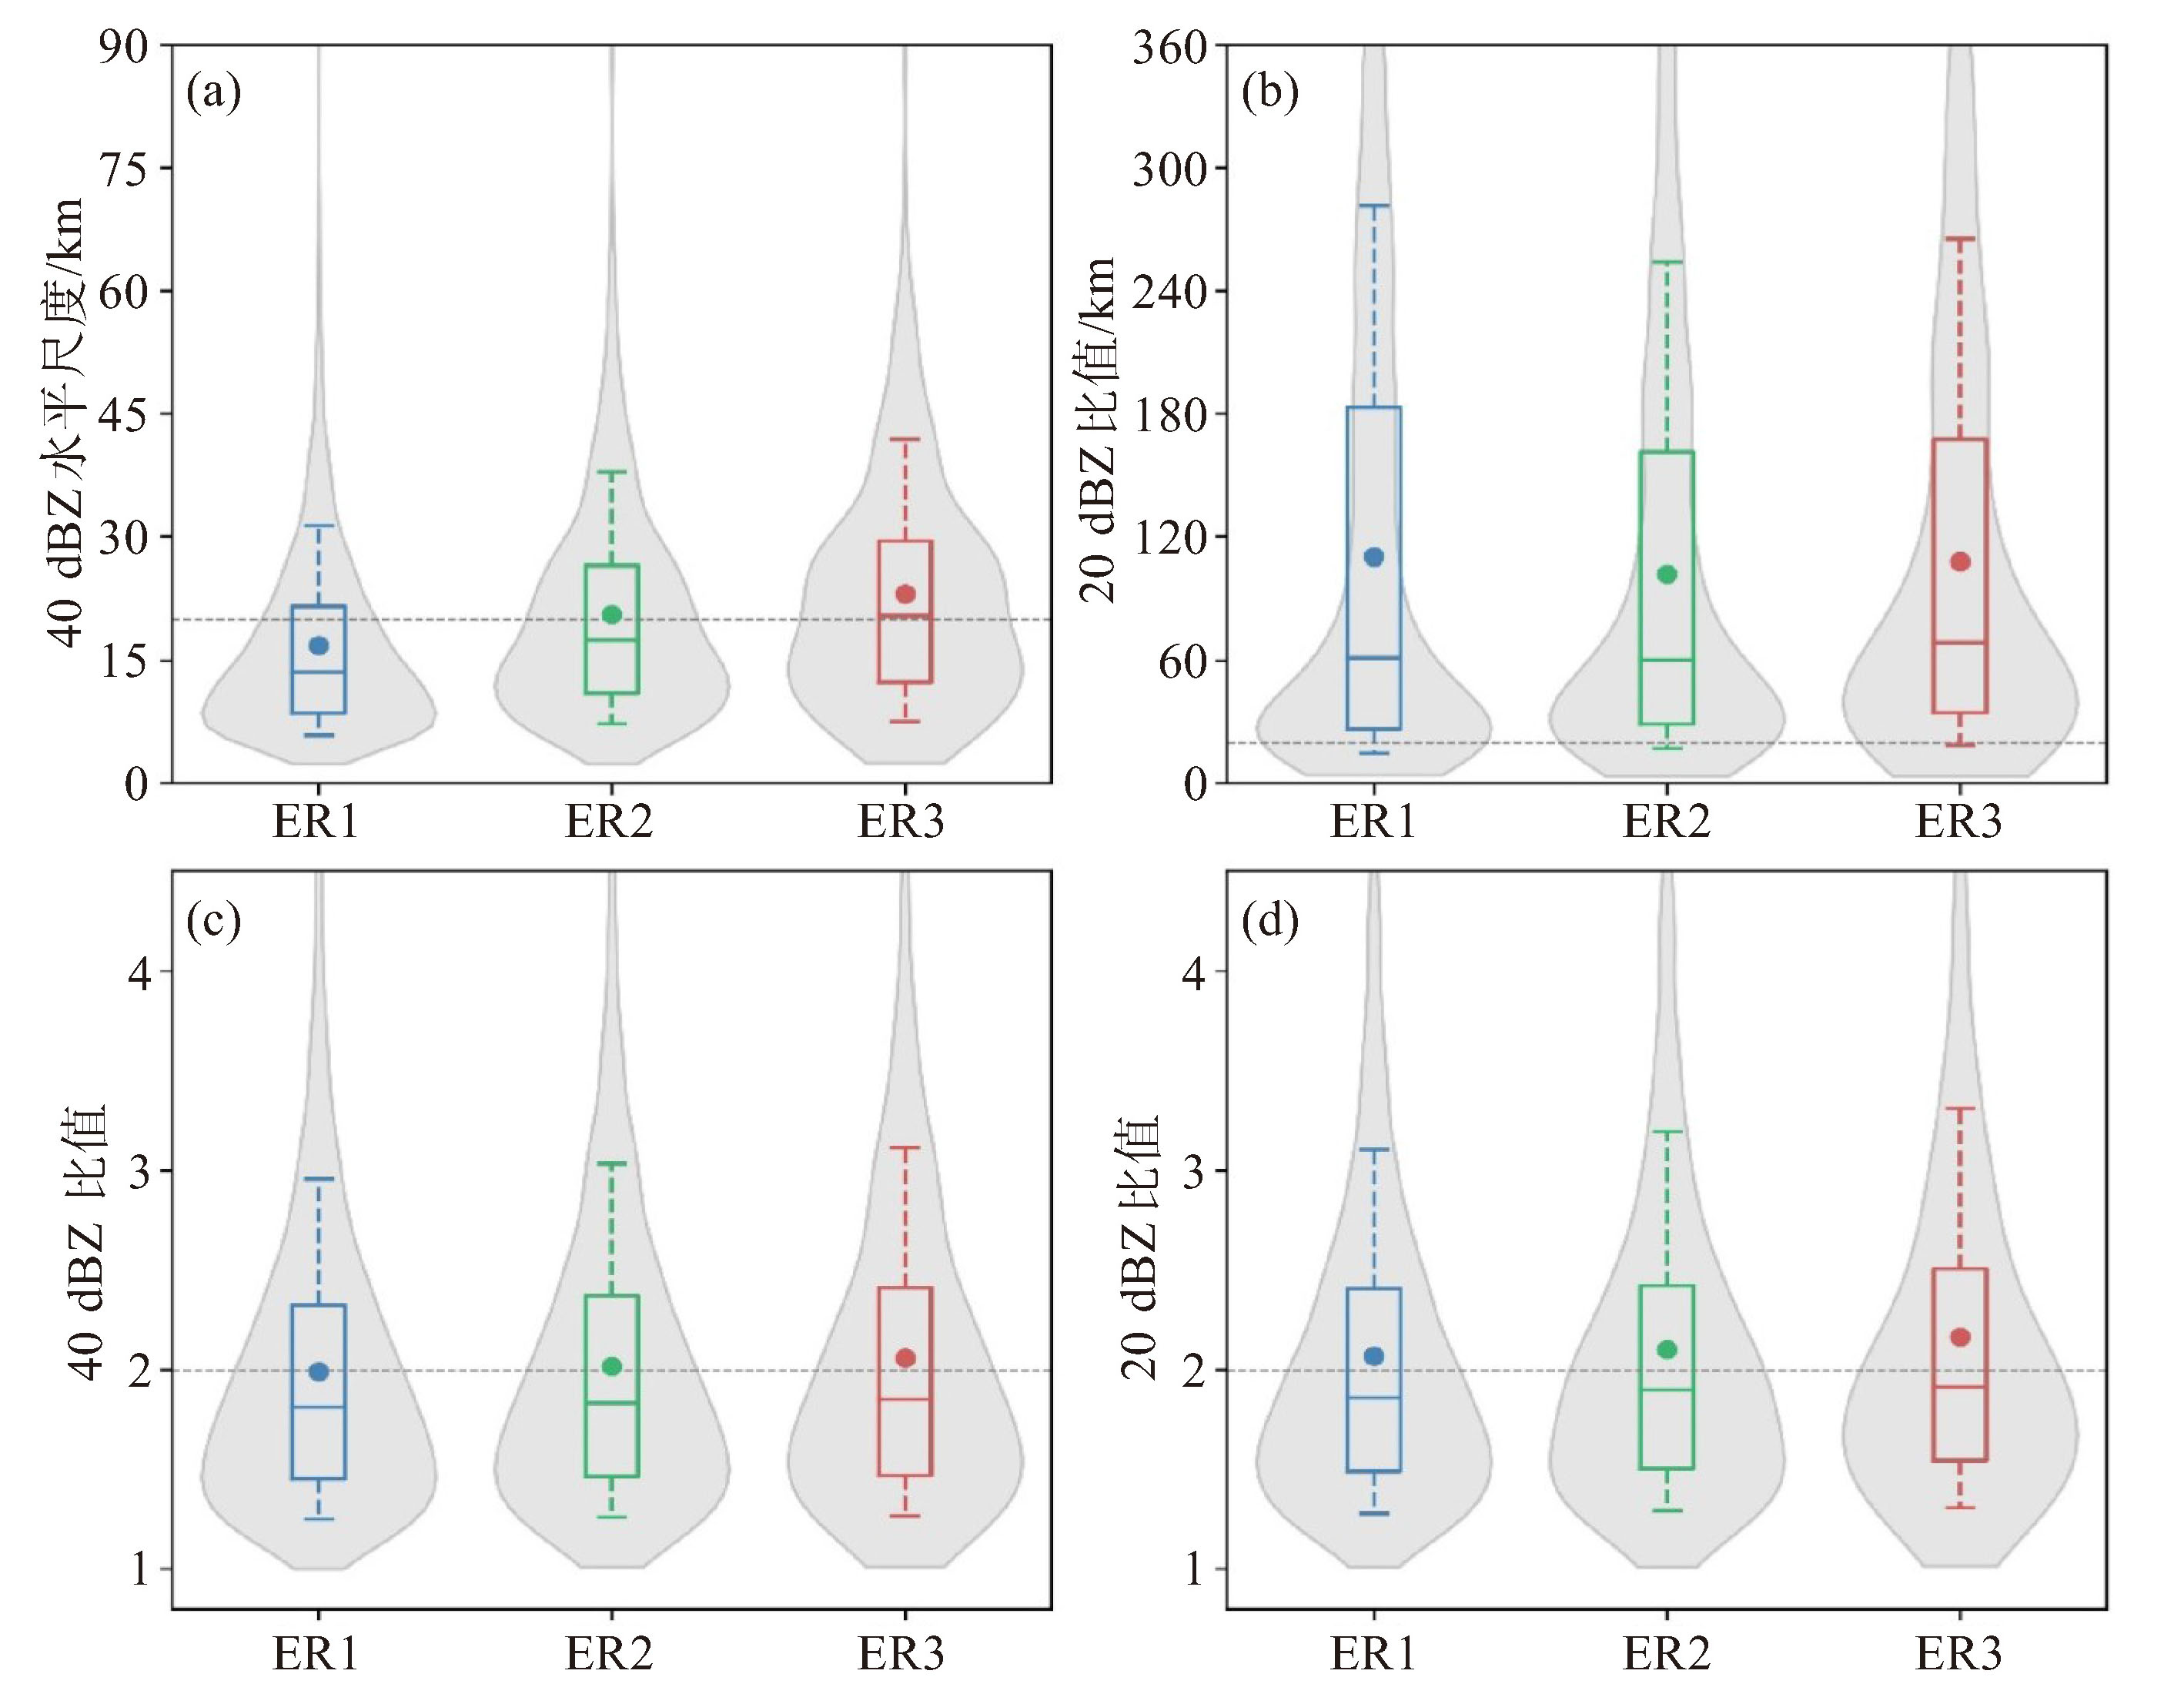
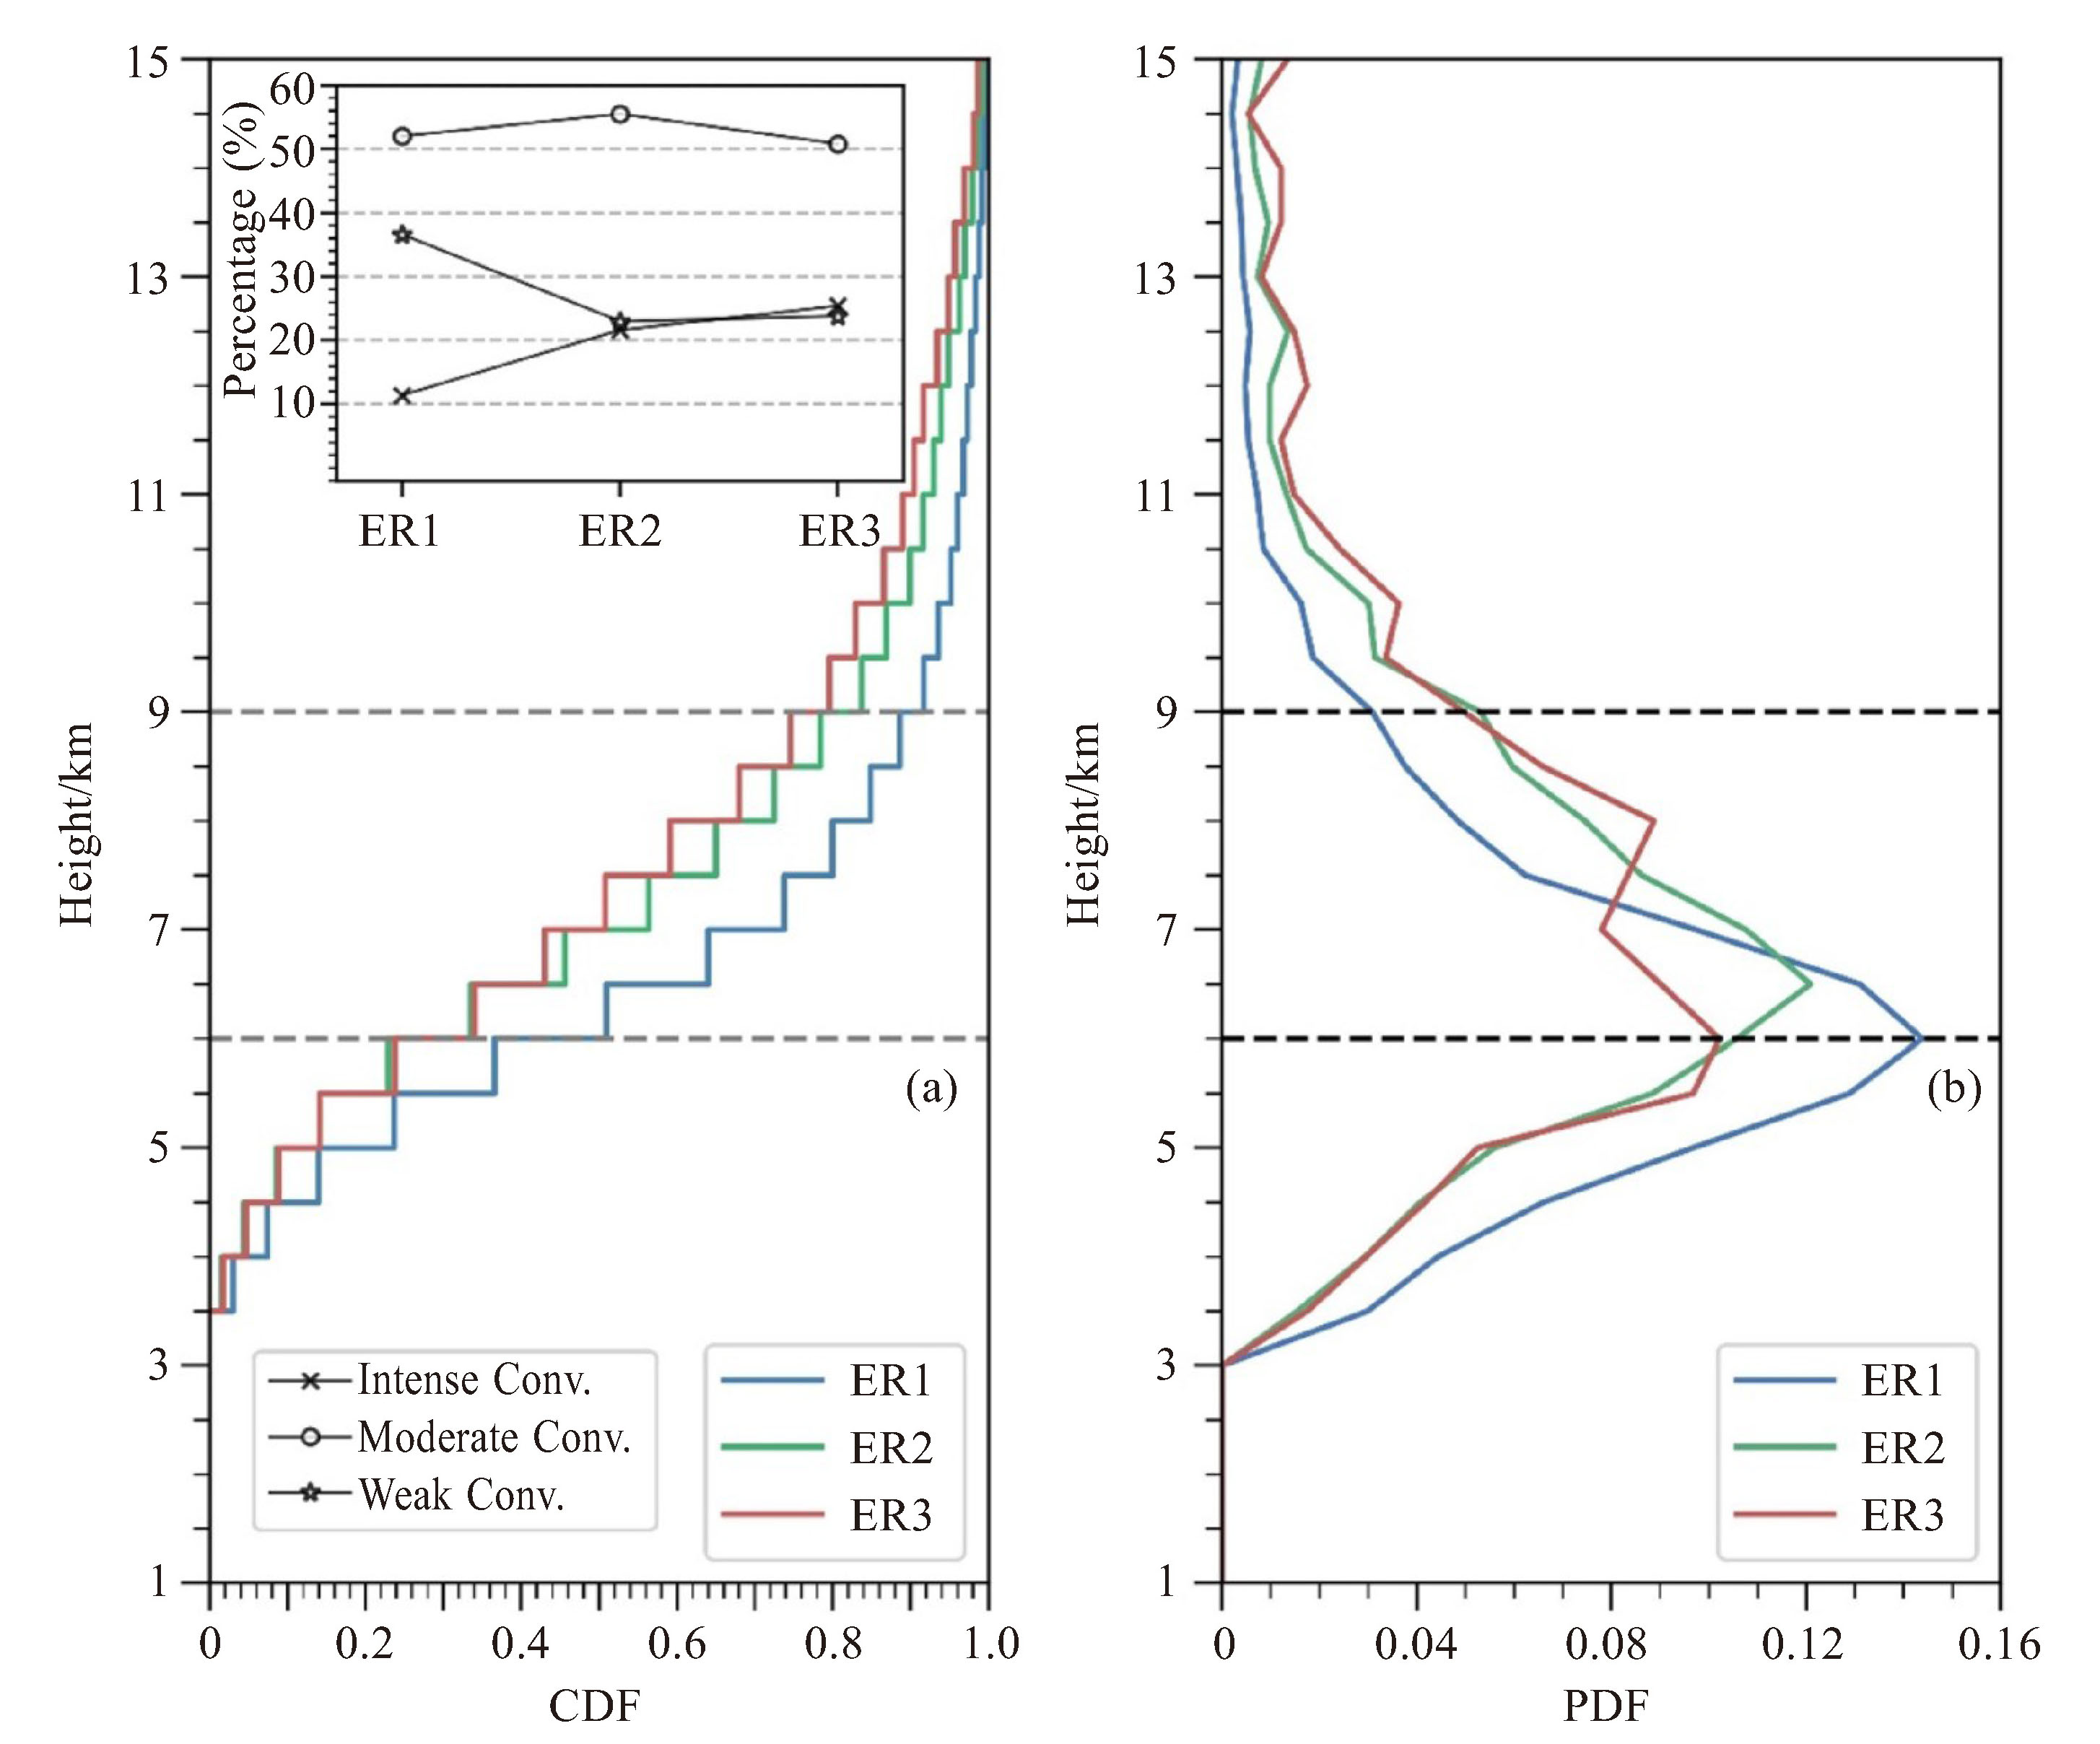
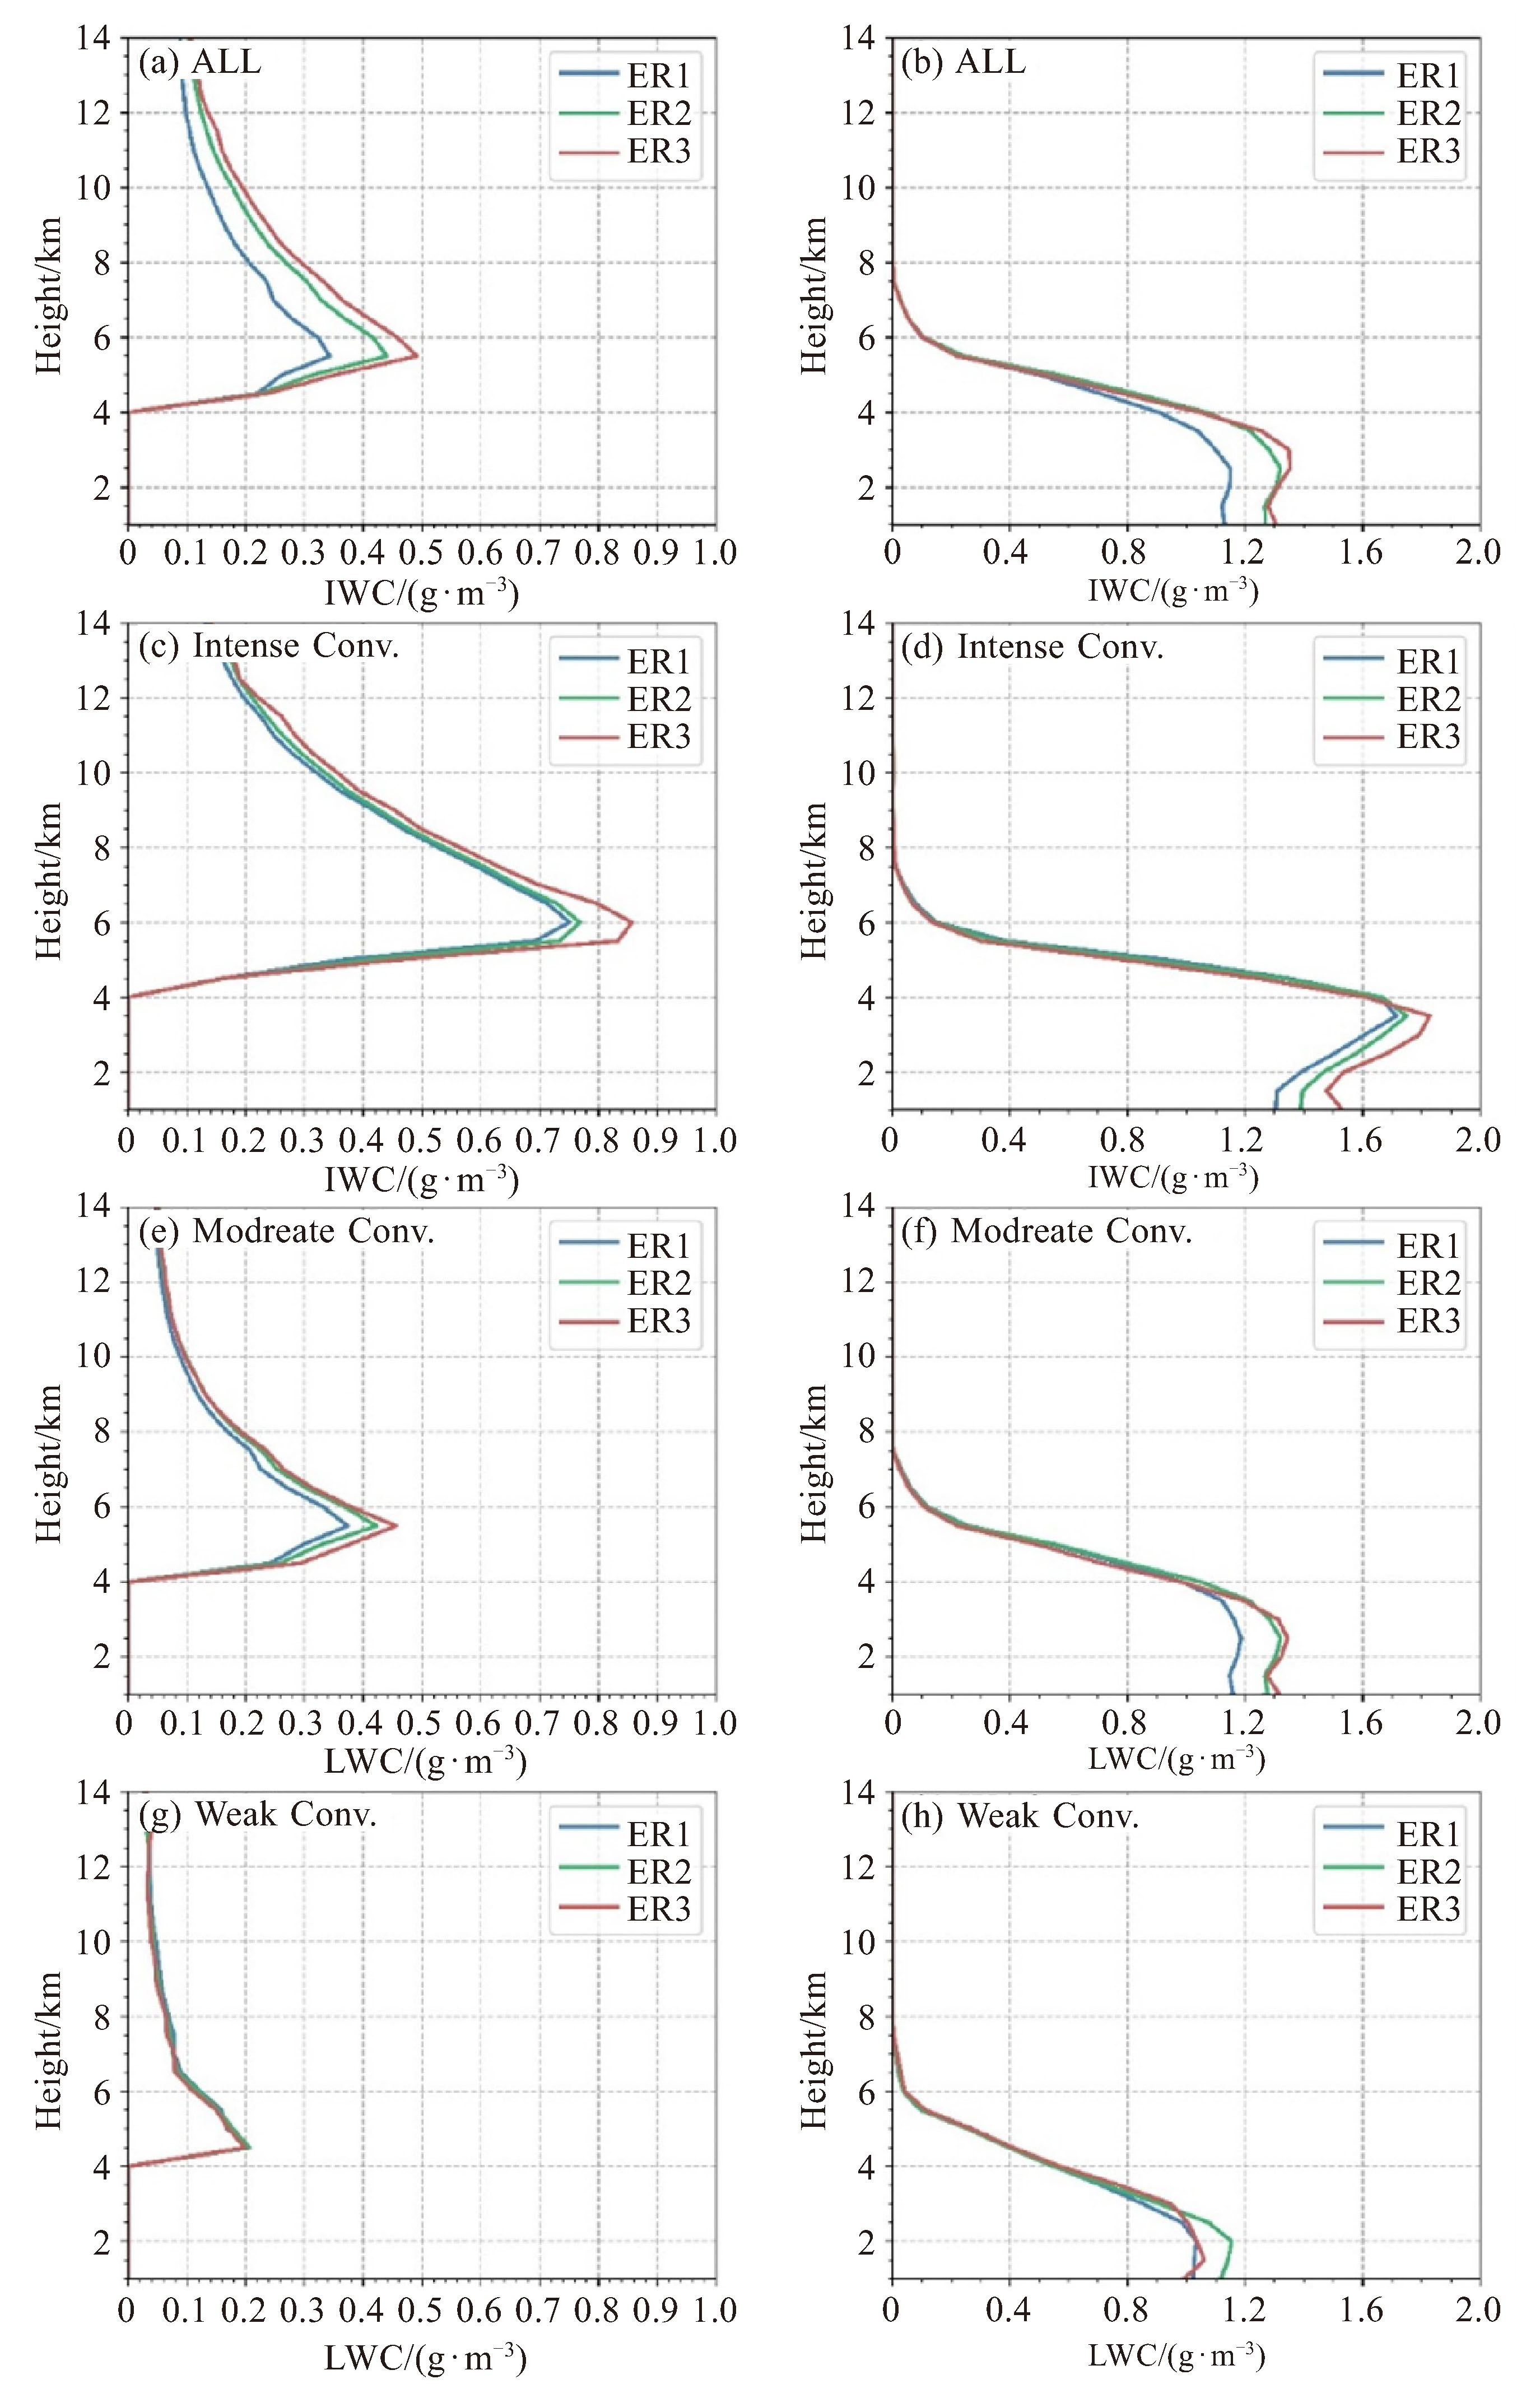
摘要: 全球变暖背景下极端降水发生频次升高,但不同地区不同程度极端降水的对流云宏微观特征的认识仍然不清晰。利用2020—2022年5—9月南京地区S波段双偏振雷达观测数据,定义“极端降水对流体” (Extreme Precipitation Feature,EPF),根据雨强极端程度分为三组EPF (ER1、ER2、ER3),进一步分为强对流、中等强度对流和弱对流EPF,分析其对流云宏微观特征。结果表明,随着极端雨强强度增强,EPF的40 dBZ区域水平尺寸增大,20 dBZ区域尺寸变化较小;强对流EPF占比明显上升(11.4%~25.4%),弱对流EPF占比显著下降(36.6%~23.8%);强对流和中等强度对流EPF的液水和冰水含量均显著增加,混合相和液相微物理过程都更加活跃。三种雨强阈值下,强对流EPF的液相微物理过程均以尺度分选、蒸发为主(43.9%~50.8%),弱对流EPF的液相微物理过程以碰并为主(76.9%~75.3%),雨滴谱分布介于海洋性与大陆性之间、但偏向海洋性对流,数浓度与雨滴粒径频次峰值类属海洋性对流,数浓度平均值高于大陆性对流、雨滴直径平均值大于海洋性对流。随雨强极端程度的升高,液相微物理过程中雨滴碰并的占比仅略有减少、破碎的占比略有上升,雨滴平均粒子大小和数浓度变化不明显。Abstract: Despite global warming increases extreme precipitation frequency, the understanding of the macro-and microphysical characteristics of extreme precipitation-producing convective clouds in different regions remains incomplete. This study utilizes dual-polarization radar and rain gauges data (May-September 2020-2022) in the Nanjing area to compare three rainfall intensity-based Extreme Precipitation Features(EPFs) groups (ER1, ER2, ER3). Each group is further categorized into EPFs with intense, moderate and weak convection. It is found that, as the rainfall extremity increases, the horizontal extent of 40 dBZ region in EPFs increases, whereas 20 dBZ regions exhibit minimal changes. The proportion of intense convection EPFs rises from 11.4% to 25.4%, while the proportion of weak convection declines from 36.6% to 23.8%. The liquid and ice water contents in intense and moderate convection EPFs increase significantly with more extreme rainfall, while both mixed - and liquid-phase processes become more active. In EPFs with intense convection, liquid-phase processes are mainly dominated by size sorting and evaporation, while EPFs with weak convection are governed by coalescence. The raindrop size distributions resemble maritime-like convection, with characteristics between "maritime-like" and "continental-like" convection. The peak values of concentration and droplets size belong to "maritimelike" convection, with raindrop size distributions featuring a mean size large than "maritime-like" droplets and a concentration much higher than "continental-like" raindrops. As the rainfall extremity increases, liquid-phase processes show a slightly decrease in raindrop coalescence and a slight increase in raindrop breakup. The average raindrops size and concentration of ER1 to ER3 exhibit minimal variation.
-

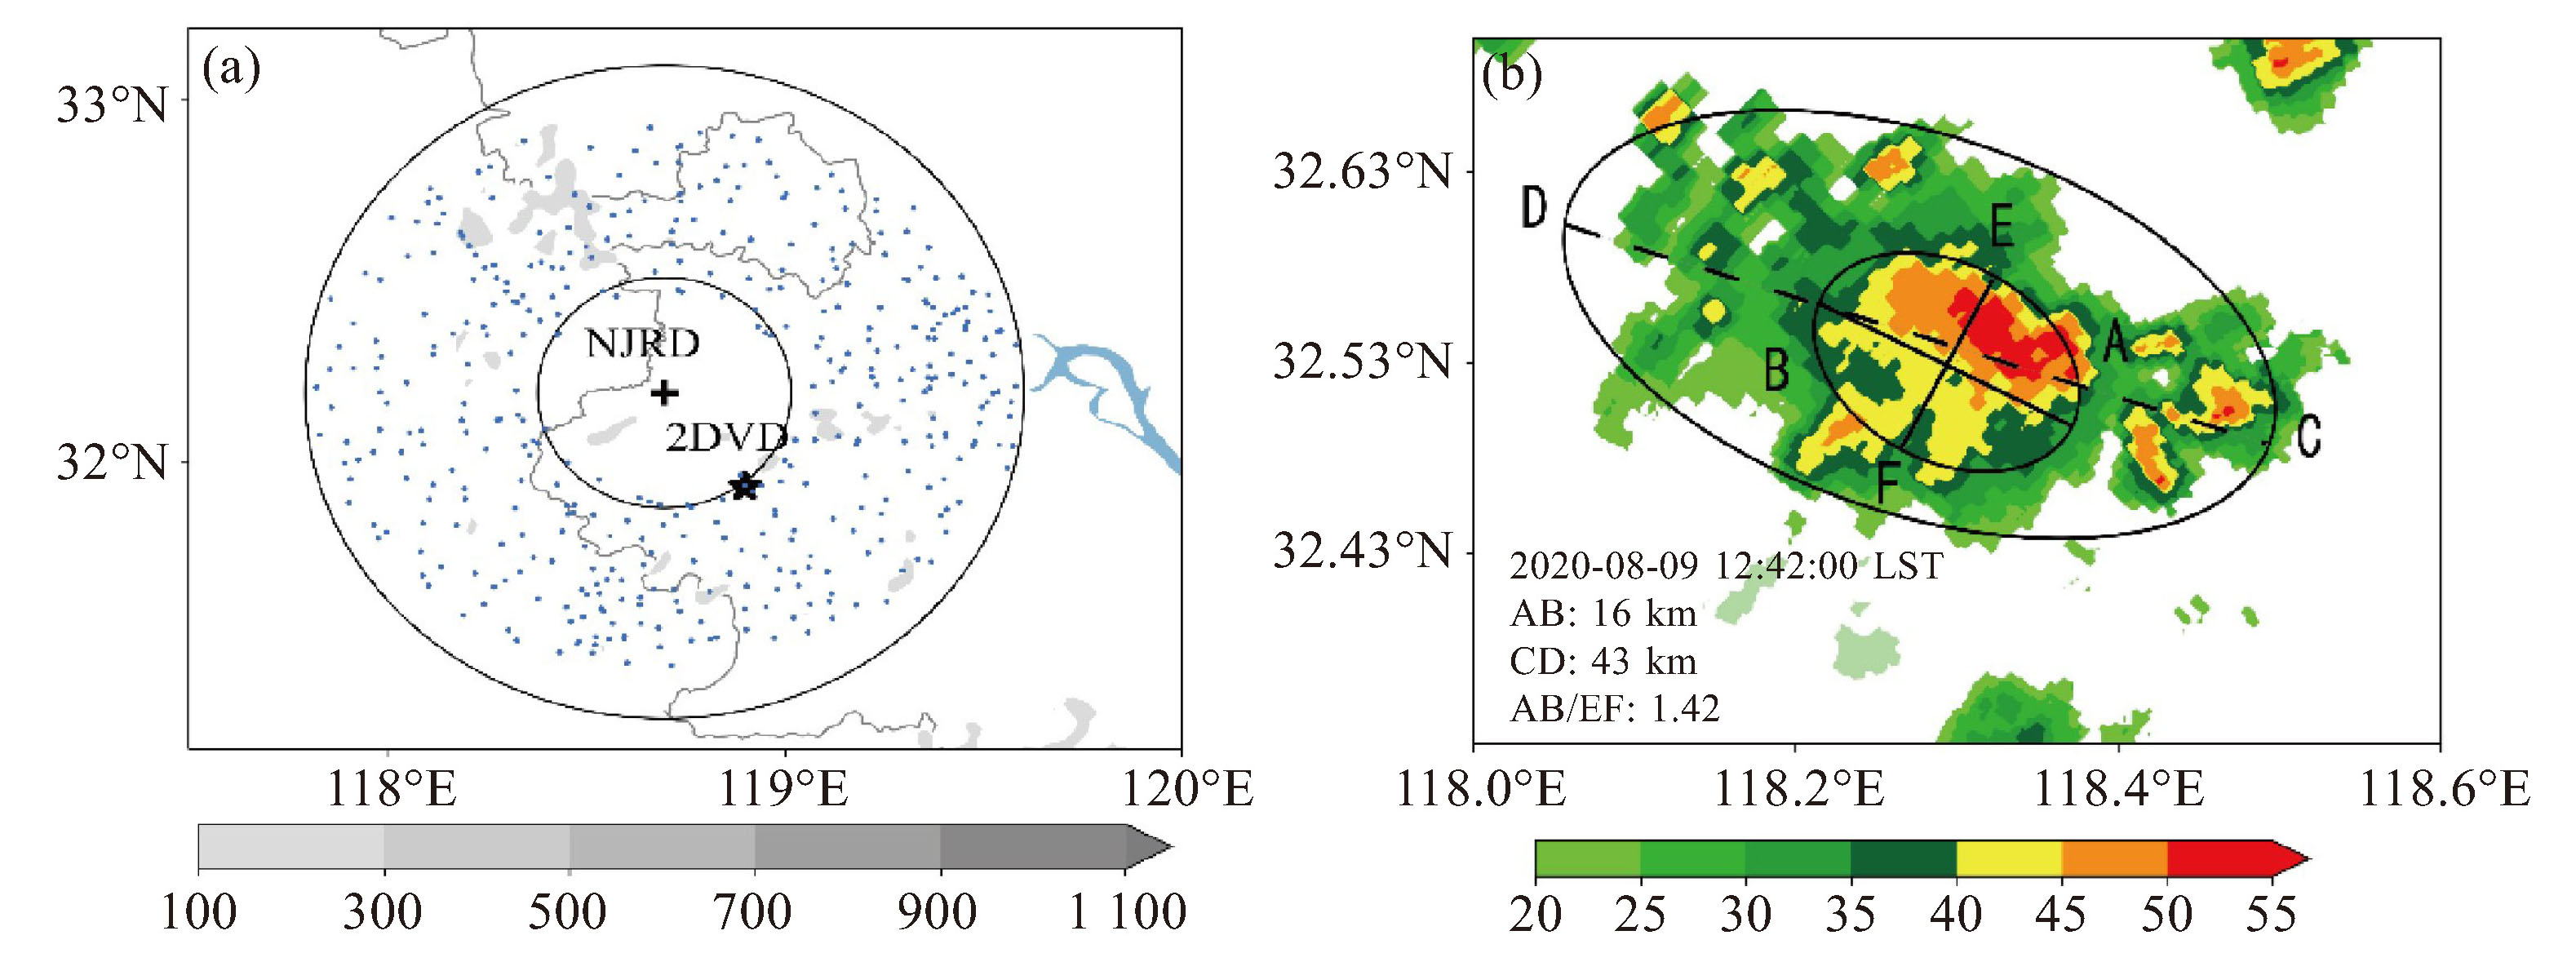
图 1 NJRD观测范围内地形高度(a, 灰色阴影;单位:m),“+”代表NJRD的位置,“*”代表二维雨滴谱仪位置,两个圆代表距离NJRD半径为30 km、85 km的圆,蓝点代表雨量计; 2020年8月9日12时42分(北京时)NJRD观测到的组合反射率水平分布图(b),分别对20 dBZ以及40 dBZ区域利用最小二乘法进行椭圆拟合,AB和CD分别为40 dBZ以及20 dBZ区域的长轴,EF为40 dBZ区域的短轴

图 2 小提琴图:40 dBZ水平尺度(a),20 dBZ水平尺度(b),40 dBZ区域长轴与短轴之比(c),20 dBZ区域长轴与短轴之比(d)
圆点表示平均值,盒须图从下至上的横线表示第10、25、50、75、90百分位,浅灰色阴影表示样本的分布密度。三种颜色代表不同雨强极端程度:ER1(蓝色),ER2(绿色),ER3(红色)。

图 3 MaxHt_40dBZ累积分布函数(a),上方小方框显示强对流、中对流和弱对流EPF比例(%);MaxHt_40dBZ概率密度函数(b)
蓝色、绿色、红色分别代表不同雨强极端程度:ER1,ER2,ER3。

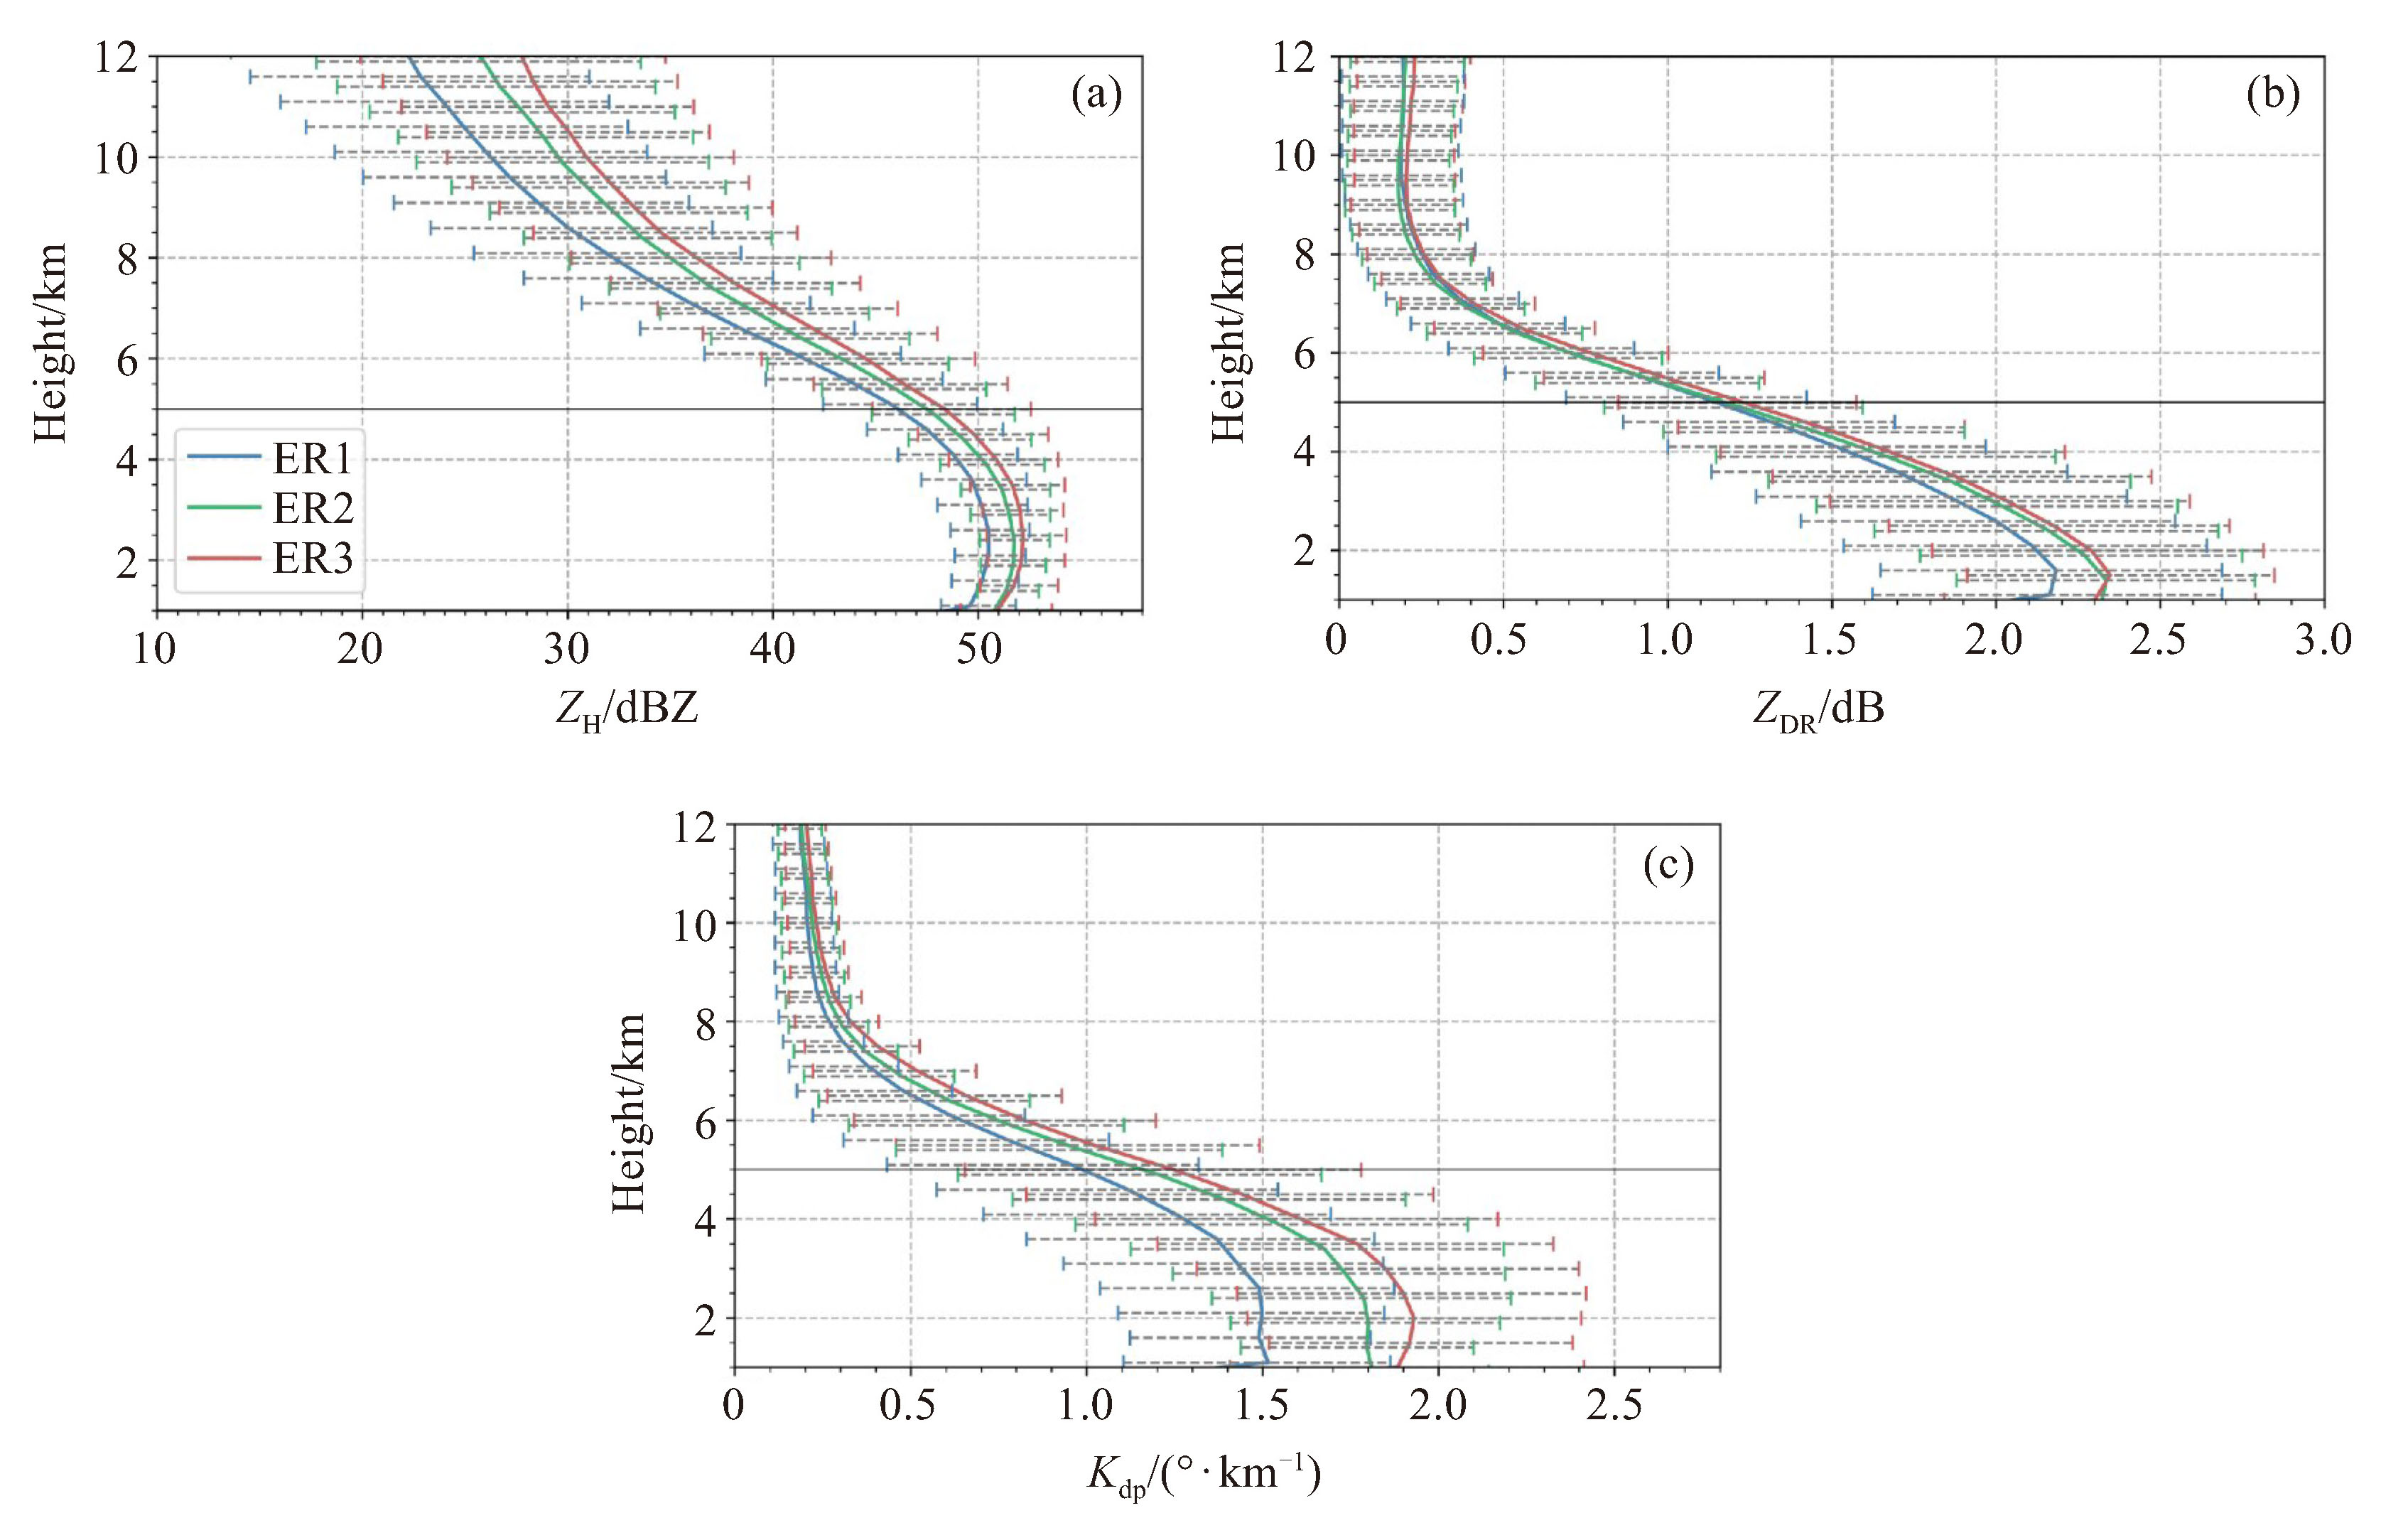
图 4 ZH、Zdr、Kdp的VP95及各高度上第25百分位至75百分位的范围
5 km高度的黑色实线代表 0 ℃线:蓝色、绿色、红色分别代表不同雨强极端程度ER1、ER2、ER3。

图 5 强对流(上)、中等强度对流(中)、弱对流(下)每个EPF的第95百分位ZH (dBZ)、Zdr (dB)、Kdr (°·km-1) 平均垂直廓线(VP95)
横线表示第25百分位至75百分位的范围;ER1、ER2、ER3分别用蓝色、绿色、红色表示。黑色实线代表 0 ℃高度。

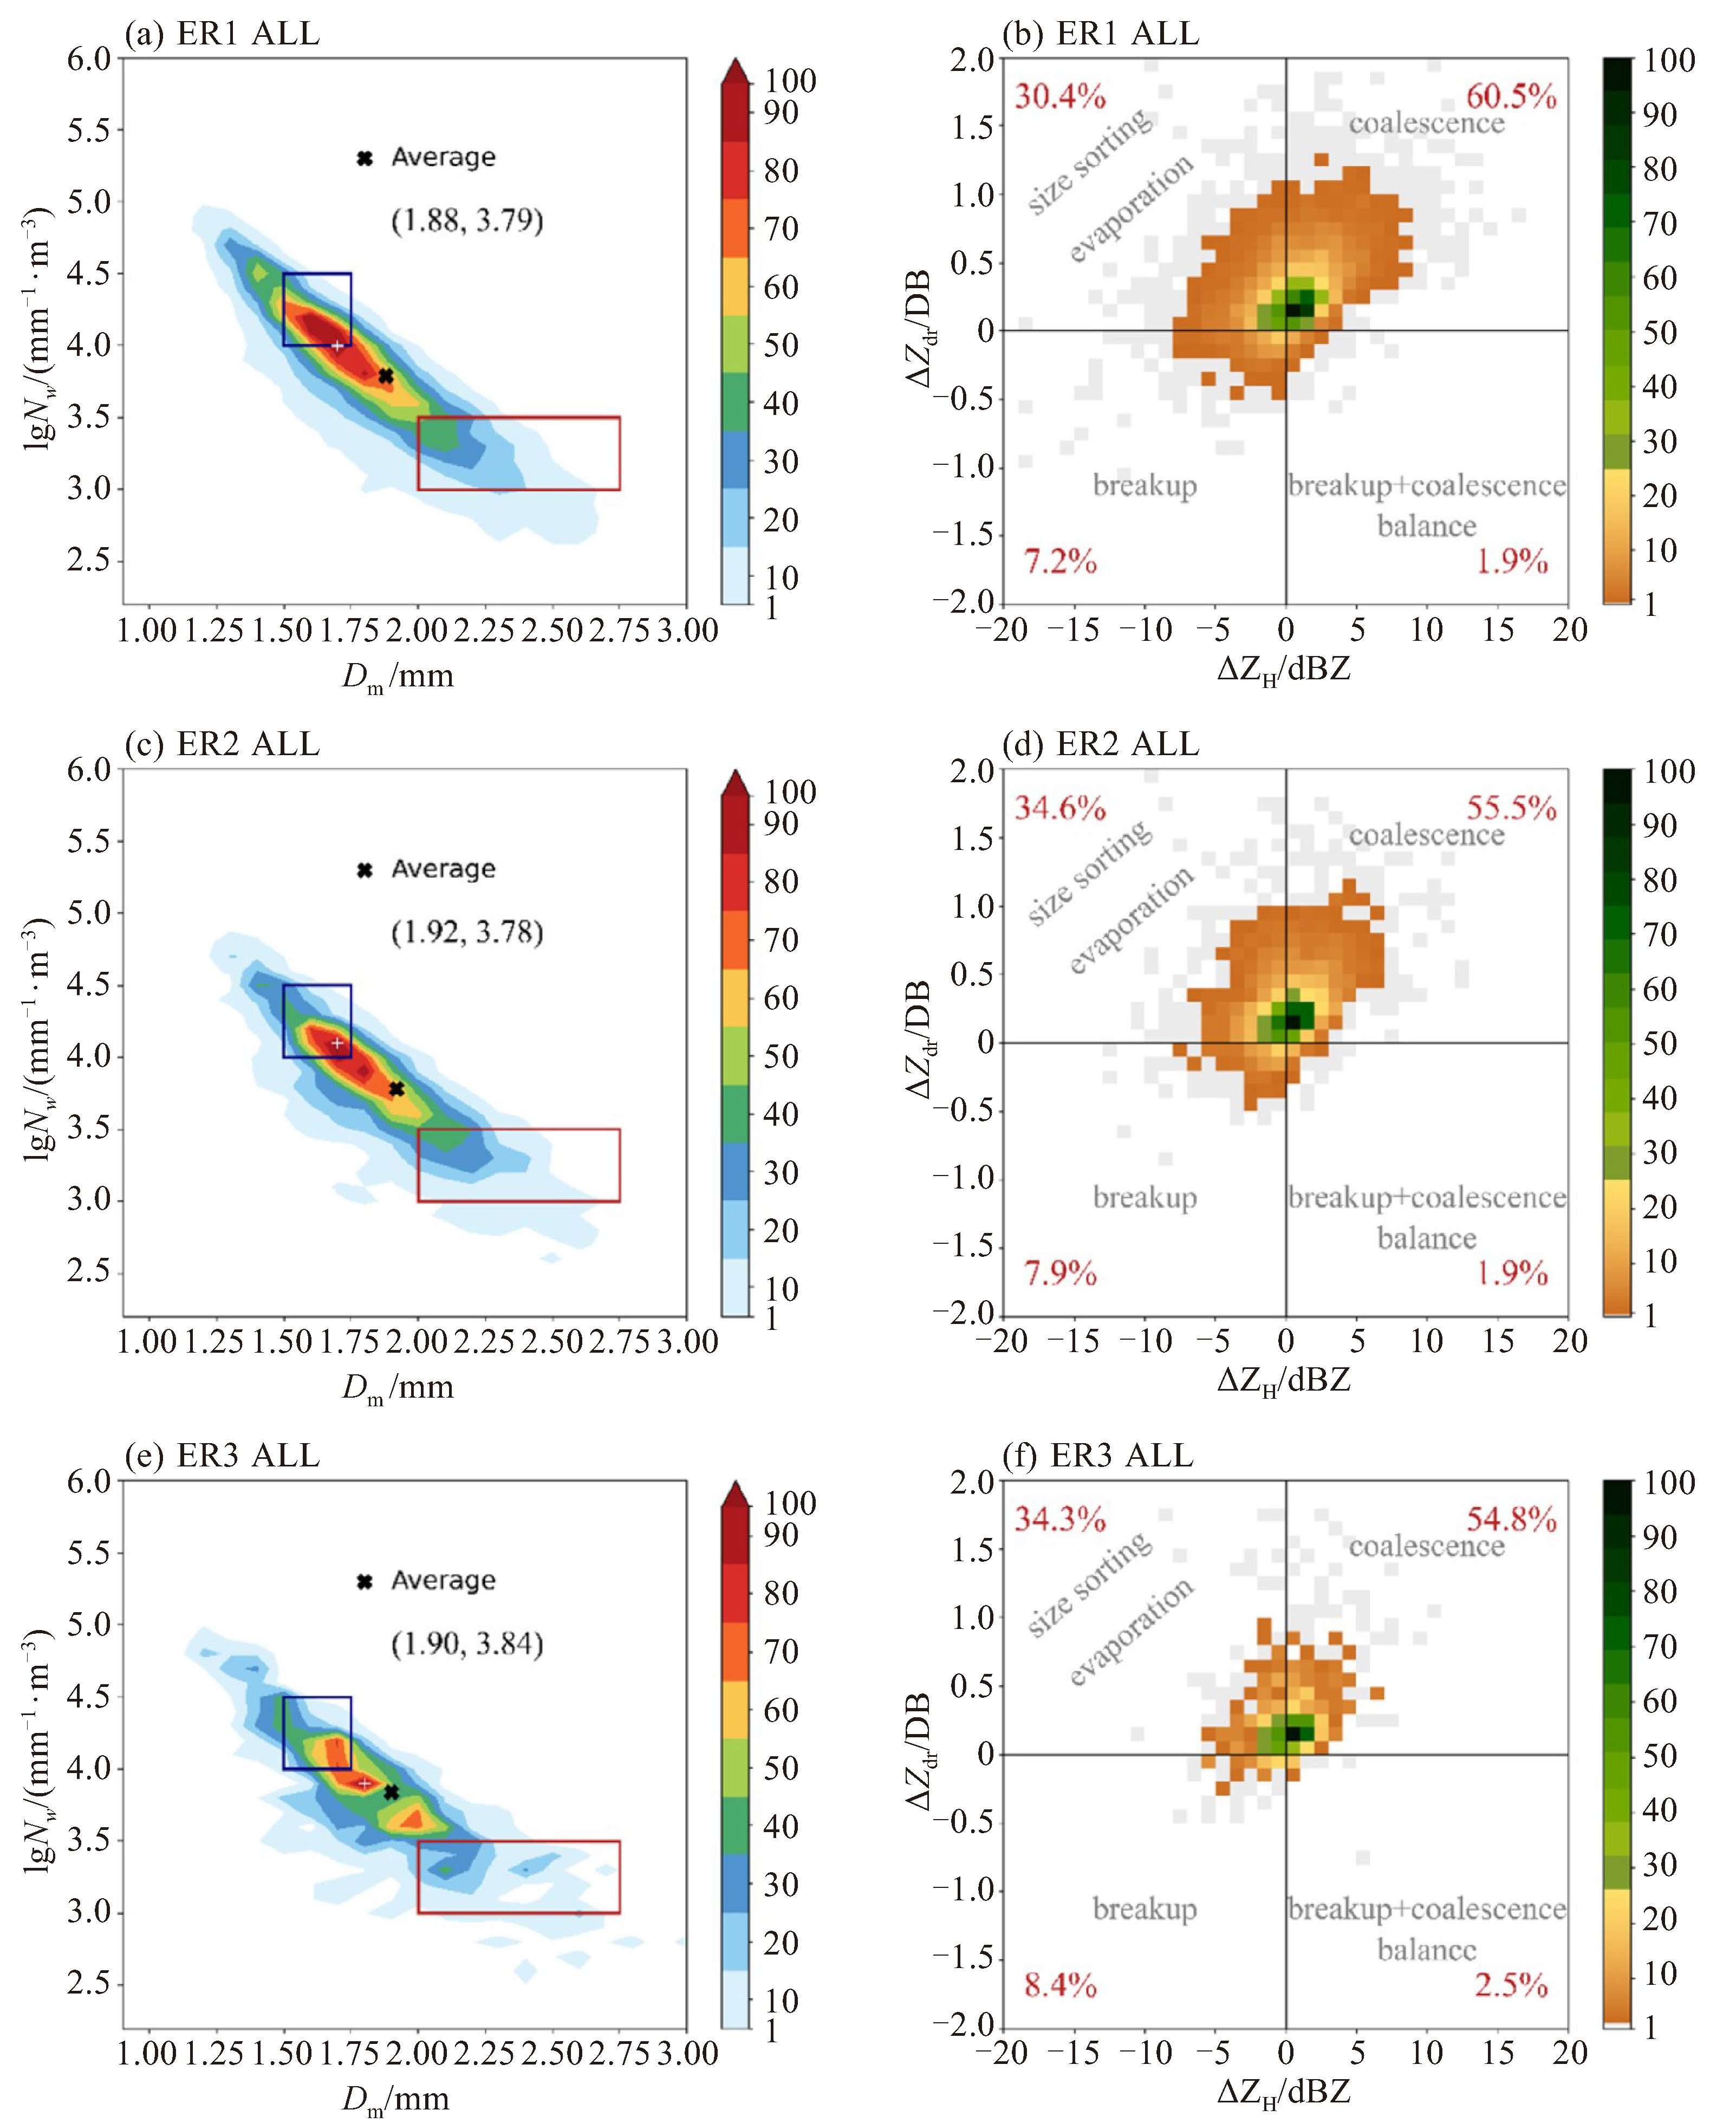
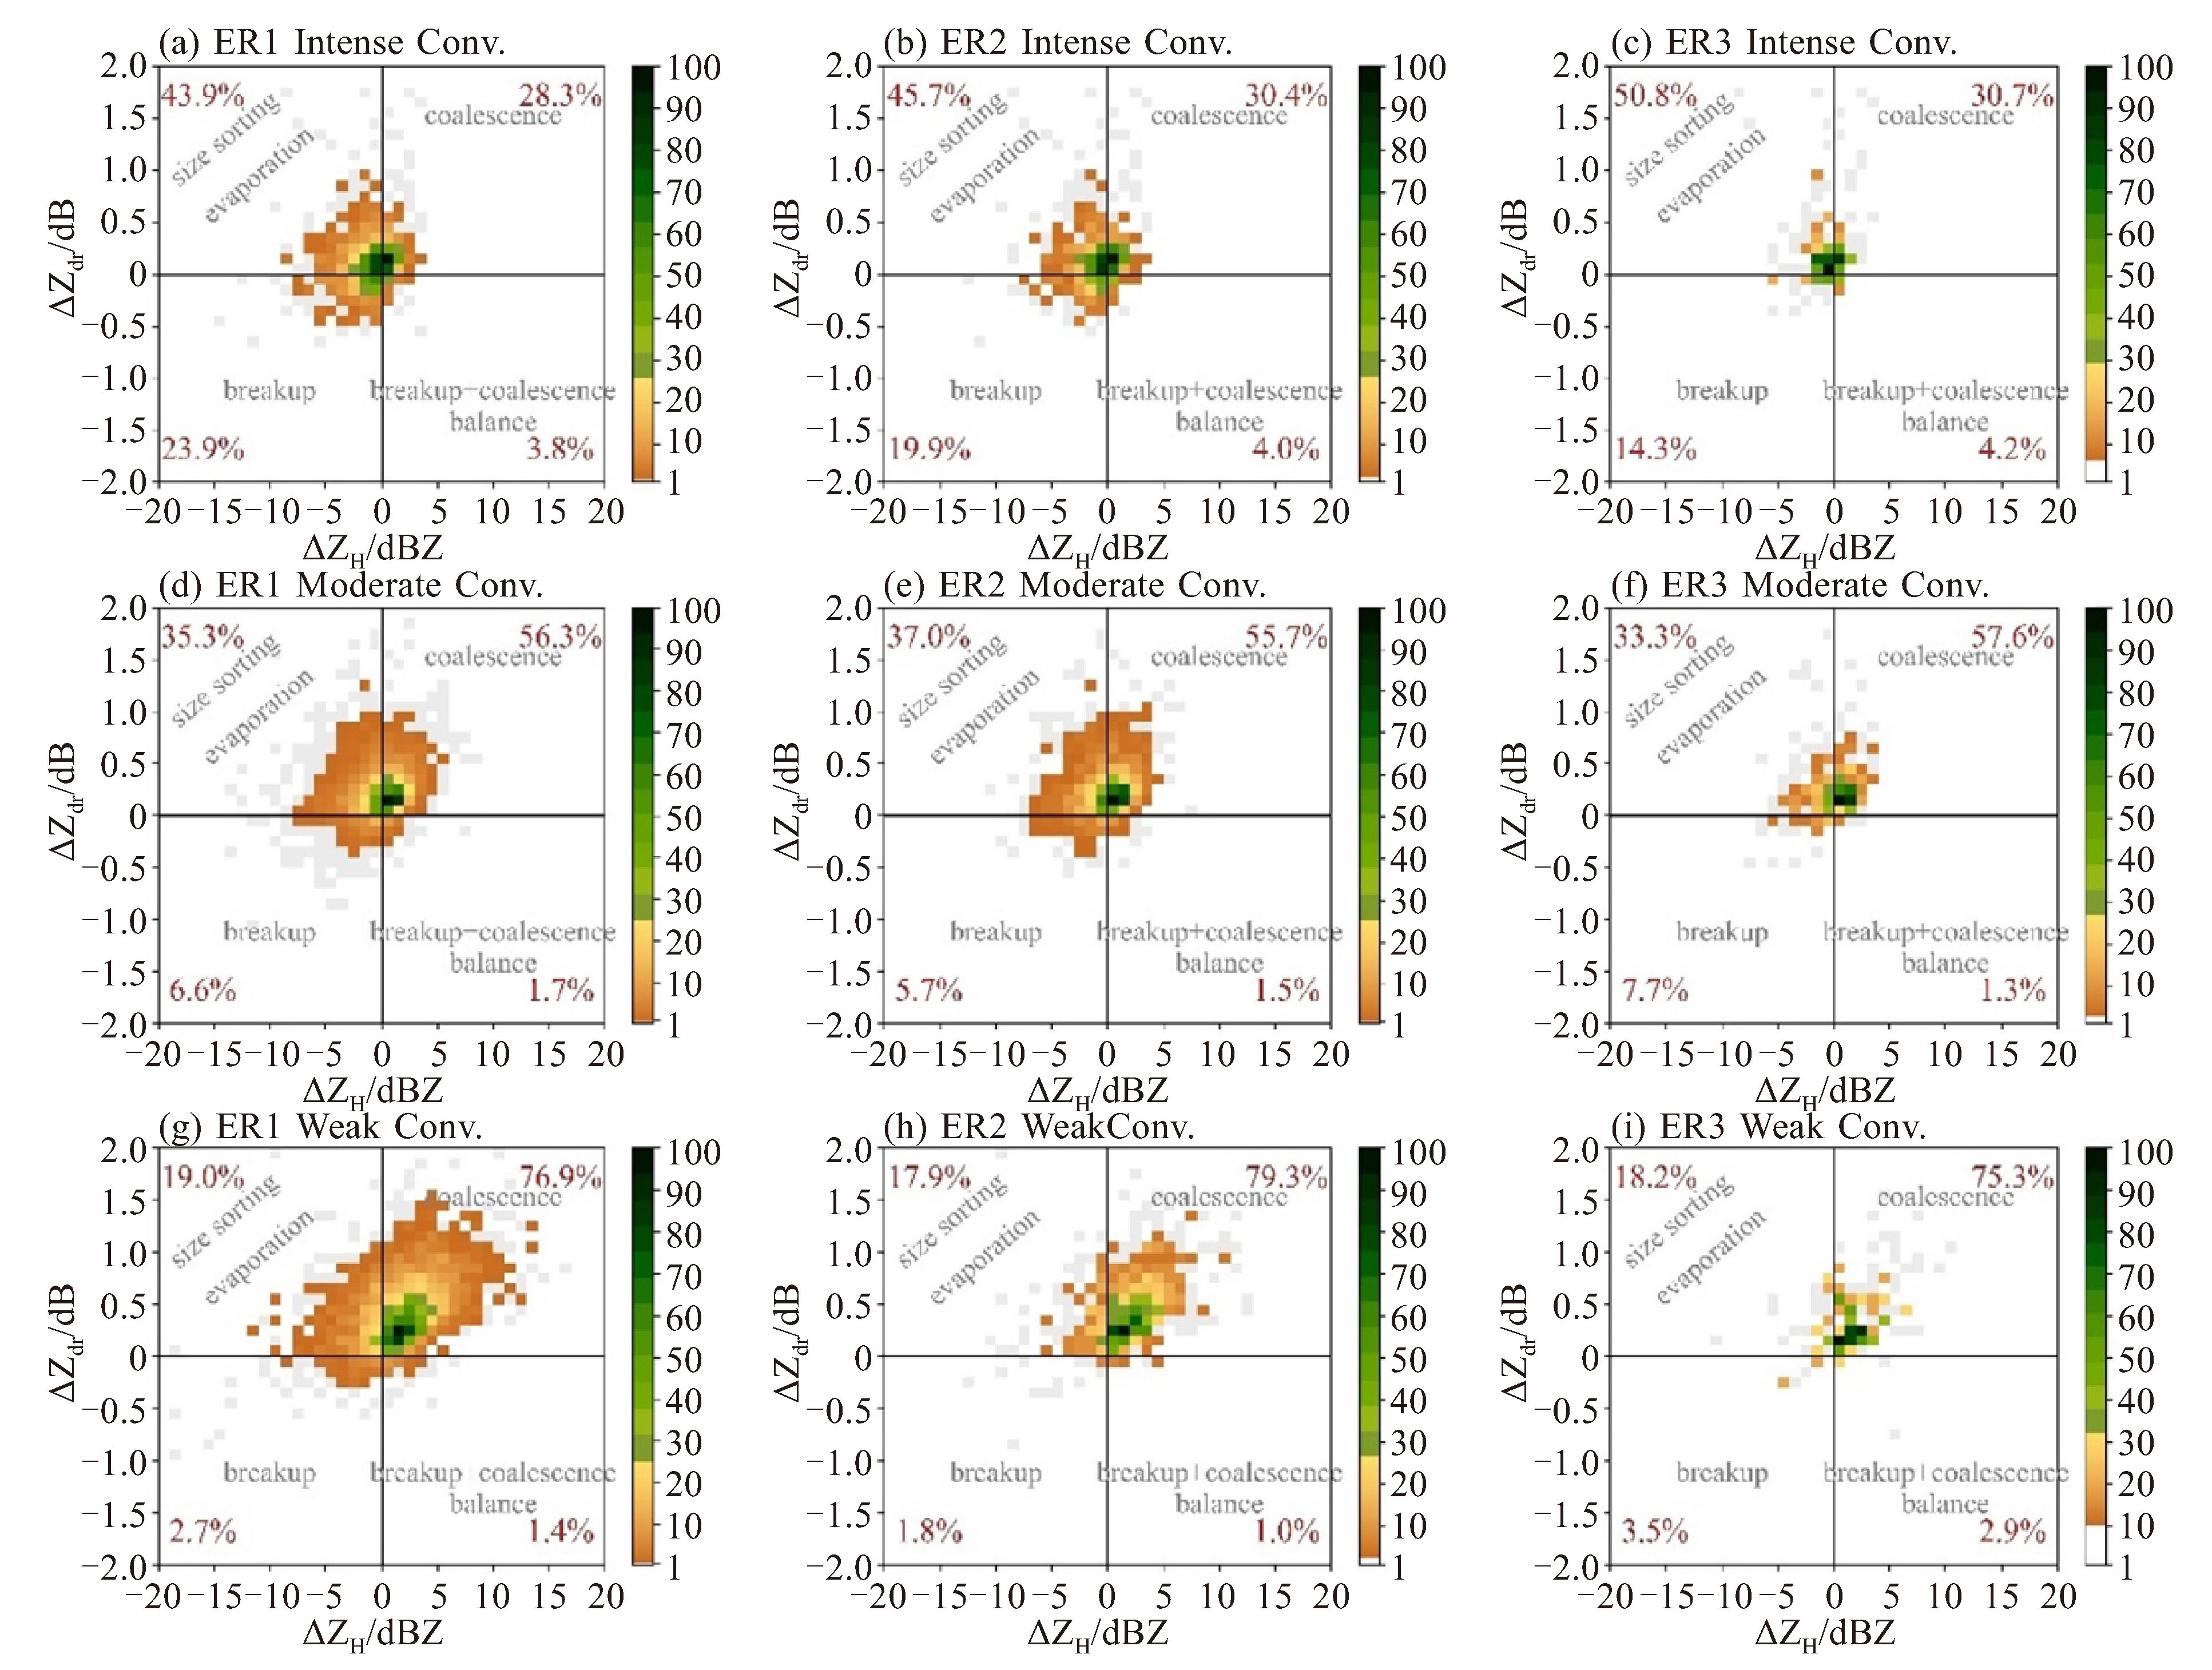
图 7 1 km高度上每个EPF取Dm中值和lgNw中值,ER1、ER2、ER3每组EPF的二维频次分布图(a、c、e),黑色“x”和白色“+”分别代表平均值和频率峰值所在位置,平均值数值标注在右上方;3 km至1.5 km高度每个EPF取中值相减的(ΔZH与ΔZdr)二维频次分布图(b、d、f),各个象限代表含义和占比分别用灰色和红色字体标注
表 1 不同雨强以及不同对流强度的EPF数量(个)
对流强度 ER1 ER2 ER3 强对流 1 209 796 189 中等强度对流 5 523 2 046 378 弱对流 3 879 847 177  下载: 导出CSV
表 2 EPF第50百分位IWP和LWP的平均值(kg·m-2)
对流强度 ER1 ER2 ER3 IWP LWP IWP LWP IWP LWP 总体EPF 1.86 5.06 2.35 5.73 2.57 5.79 强对流EPF 3.9 7.25 4.06 7.36 4.35 7.58 中等强度对流EPF 1.56 5.31 1.73 5.71 1.81 5.69 弱对流EPF 0.77 3.95 0.73 4.16 0.71 4.01
下载: 导出CSV
-
[1] MARTHA T, ROY P, GOVINDHARAJ K, et al. Landslides triggered by the June 2013 extreme rainfall event in parts of Uttarakhand state, India[J]. Landslides, 2015, 12: 135-146. [2] HANDWERGER A, FIELDING E, HUANG M, et al. Widespread initiation, reactivation, and acceleration of landslides in the northern California Coast Ranges due to extreme rainfall[J]. J Geophys Res-Earth, 2019, 124: 1 782-1 797. [3] DONAT M, LOWRY A, ALEXANER L, et al. More extreme precipitation in the world's dry and wet regions[J]. Nat Clim Change, 2016, 6: 508-513. [4] OMBADI M, RISSER M, RHOADES A, et al. A warming-induced reduction in snow fraction amplifies rainfall extremes[J]. Nature, 2023, 619: 305-310. [5] 朱连华, 祝颖锜, 姚壹壹, 等. 全球增暖1.5/2℃下中国区域极端降水的风险变化及其影响因子[J]. 大气科学学报, 2023, 46(1): 97-109. [6] 谭桂容, 蔡哲, 徐永明. 基于Landsat影像的南京地区热岛效应[J]. 安徽农业科学, 2009, 37(13): 6 050-6 052+6 066. [7] 王佐鹏, 张颖超, 熊雄, 等. 基于EOF的南京气温变化特征及热岛效应研究[J]. 陕西气象, 2019(6): 29-33. [8] JIANG X, ZHANG D, LUO Y. Influences of urbanization on an afternoon heavy rainfall event over the Yangtze River Delta region[J]. Mon Wea Rev, 2023, 151: 815-832. [9] JIANG X, LUO Y, ZHANG D, et al. Urbanization enhanced summertime extreme hourly precipitation over the Yangtze River Delta[J]. J Climate, 2020, 33: 5 809-5 826. [10] HAMADA A, MURAYAMA Y, TAKAYABU Y. Regional characteristics of extreme rainfall extracted from TRMM PR measurements[J]. J Climate, 2014, 27(21): 8 151-8 169. [11] WANG T, TANG G. Spatial variability and linkage between extreme convections and extreme precipitation revealed by 22-year space-borne precipitation radar Data[J]. Geophys Res Lett, 2020, 47(12): 1-10. [12] KUMJIAN M. Principles and applications of dual-polarization weather radar. Part Ⅱ: Warm and cold season applications[J]. J Oper Meteor, 2013, 1(20): 243-264. [13] ZIPSER E, CECIL D, LIU C, et al. Where are the most intense thunderstorms on Earth?[J]. Bull Amer Meteor Soc, 2006, 87(8): 1 057-1 071. [14] XU W, ZIPSER E. Properties of deep convection in tropical continental, monsoon, and oceanic rainfall regimes[J]. Geophys Res Lett, 2012, 39(7): 1-6. [15] 郑栋, 张文娟, 姚雯, 等. 雷暴闪电活动特征研究进展[J]. 热带气象学报, 2021, 37(3): 289 -297. [16] XU W, CHEN H, WEI H, et al. Extreme precipitation produced by relatively weak convective systems in the tropics and subtropics[J]. Geophys Res Lett, 2022, 49(7): 1-11. [17] YU S, LUO Y, WU C, et al. Convective and microphysical characteristics of extreme precipitation revealed by multisource observations over the Pearl River Delta at monsoon Coast[J]. Geophys Res Lett, 2022, 122(8): 1751-1759. [18] 杨忠林, 赵坤, 徐坤, 等. 江淮梅雨期极端对流微物理特征的双偏振雷达观测研究[J]. 气象学报, 2019, 77 (1): 58-72. [19] DING Y. Summer monsoon rainfalls in China[J]. J Meteor Soc Japan, 1992, 70(1): 373-396. [20] DING Y, CHAN J. The East Asian summer monsoon: An overview[J]. Meteor Atmos Phys, 2005, 89(1-4): 117-142. [21] GAO Y, LI M, LUO Y, et al. How do the convective and microphysical characteristics of extreme precipitation over the Pearl River Delta at monsoon coast vary with increasing rainfall extremity?[J]. Geophys Res Lett, 2023, 50: e2023GL104625. [22] YU S, LUO Y, WU C, et al. Subseasonal variations of convective and microphysical characteristics of extreme precipitation over the Pearl River Delta at monsoon coast[J]. J Geophys Res: Atmos, 2023, 128: e2022JD037804. [23] BRINGI V, RICO-RAMIREZ M, THURAI M. Rainfall estimation with an operational polarimetric C-band radar in the United Kingdom: Comparison with a gauge network and error analysis[J]. J Hydrometeorol, 2011, 12(5): 935-954. [24] RYZHKOV A, PINSKY M, POKROVSKY A, et al. Polarimetric radar observation operator for a cloud model with spectral microphysics[J]. J Appl Meteor Climatol, 2011, 50(4): 873-894. [25] TANG L, ZHANG J, LANGSTON C, et al. A physically based precipitation-nonprecipitation radar echo classifier using polarimetric and environmental data in a real-time national system[J]. Wea Forecasting, 2014, 29(5): 1 106-1 119. [26] 吴翀. 双偏振雷达的资料质量分析, 相态识别及组网应用[D]. 南京: 南京信息工程大学. 2018. [27] WANG Y, COCKS S, TANG L, et al. A prototype quantitative precipitation estimation algorithm for operational S-band polarimetric radar utilizing specific attenuation and specific differential phase. Part I: Algorithm description[J]. J Hydrometeorol, 2019, 20(5): 985-997. [28] COCKS S, TANG L, ZHANG P, et al. A prototype quantitative precipitation estimation algorithm for operational S-band polarimetric radar utilizing specific attenuation and specific differential phase. Part I: Performance verification and case study analysis[J]. J Hydrometeorol, 2019, 20(5): 999-1 014. [29] SEO B, KRAJEWSKI W, RYZHKOV A. Evaluation of the specific attenuation method for radar-based quantitative precipitation estimation: Improvements and practical challenges[J]. J Hydrometeorol, 2020, 21(6): 1 333-1 347. [30] LIU C, ZIPSER E, CECIL D, et al. A cloud and precipitation feature database from nine years of TRMM observations[J]. J Appl Meteor Climatol, 2008, 47(10): 2 712-2 728. [31] HAMADA A, TAKAYABU Y, LIU C, et al. Weak linkage between the heaviest rainfall and tallest storms[J]. Nat Commun, 2015, 6: 1-6. [32] GEERTS B. Mesoscale convective systems in the southeast United States during 1994-95: A survey[J]. Wea Forecasting, 1998, 13(3 PART2): 860-869. [33] MENG Z, YAN D, ZHANG Y. General features of squall lines in East China[J]. Mon Wea Rev, 2013, 141(5): 1 629-1 647. [34] ZHANG G, VIVEKANANDAN J, Brandes E. method for estimating rain rate and drop size distribution from polarimetric radar measurements[J]. IEEE Trans Geosci Remote Sens, 2001, 39(4): 830-841. [35] CAREY L, RUTLEDGE S. The relationship between precipitation and lightning in tropical island convection: A C-band polarimetric radar study[J]. Mon Wea Rev, 2000, 128(8PART1): 2 687-2 710. [36] WEN L, ZHAO K, YANG Z, et al. Microphysics of stratiform and convective precipitation during Meiyu season in Eastern China[J]. J Geophys Res: Atmos, 2020, 125, e2020JD032677. [37] WEN L, ZHAO K, ZHANG G. Statistical characteristics of raindrop size distributions observed in East China during the Asian summer monsoon season using 2-D video disdrometer and Micro Rain Radar data[J]. J Geophys Res: Atmos, 2016, 121: 2 265-2 282. [38] BRINGI V, CHANDRASEKAR V, HUBBERT J, et al. Raindrop size distribution in different climatic regimes from disdrometer and dualpolarized radar analysis[J]. J Atmos Sci, 2003, 60(2): 354-365. [39] KUMJIAN M, RYZHKOV A. The impact of size sorting on the polarimetric radar variables[J]. J Atmos Sci, 2012, 69(6): 2 042-2 060. [40] YU S, LUO Y, WU C, et al. Subseasonal variations of convective and microphysical characteristics of extreme precipitation over the Pearl River Delta at monsoon coast[J]. J Geophys Res: Atmos, 2023, 128: e2022JD037804. -


 点击查看大图
计量
- 文章访问数: 5
- HTML全文浏览量: 4
- PDF下载量: 0
- 被引次数: 0
 粤公网安备 4401069904700003号