


Energetic Constraints on the Monthly Mean Position of the Intertropical Convergence Zone
-
摘要: 当前,不少研究提出在能量框架下理解赤道辐合带(ITCZ)的南北位置及移动。能量通量赤道(EFE)是能量框架下用于指示ITCZ位置的指标。已有研究发现,在年平均尺度上,EFE与ITCZ能很好地匹配,但在月尺度上情况如何,尚缺乏深入讨论。利用欧洲中期天气预报中心(ECMWF)的第五代再分析资料(ERA5)计算了1979—2021年逐月的ITCZ和EFE位置,并探讨了二者在月平均上的匹配关系。在计算ITCZ和EFE位置时,既采用了已有的计算方法,也提出了改进的方法。结果发现,在气候态月平均上,ITCZ与EFE在印度洋和海洋性大陆上匹配效果好,而在太平洋上较差,但新的EFE算法能在一定程度上改善太平洋上二者的匹配情况。在典型年份月平均(超强El Ni?o事件)中,ITCZ发生显著的南北位置异常,EFE能在一定程度上指示ITCZ的异常。通过ITCZ与EFE在不同月份和经度上的长期相关分析发现,二者在部分区域和月份具有显著的线性相关关系。结合850 hPa辐散风场、能量通量垂直积分辐散分量场,发现ITCZ与EFE在印度洋和海洋性大陆上匹配效果好的直接原因在于850 hPa环流的辐合位置(代表ITCZ)与能量通量的辐散位置(代表EFE)对应关系很好,而在太平洋上二者的位置有一定距离。结论说明,在月尺度上EFE在一定条件下可用于指示ITCZ的位置、季节变化和年际变化,即能量框架对研究ITCZ位置及其南北摆动具有一定的适用性,具体适用与否受到EFE算法、研究区域和季节的影响。Abstract: Recent studies suggest that the position of the intertropical convergence zone (ITCZ) and its meridional shift should be examined within the energy framework. The energy flux equator (EFE) is an index for tracking ITCZ position within this framework. It has been found that EFE and ITCZ have strong connection on the annual mean scale, their relationship on the monthly scale requires further investigation. This study analyzes monthly ITCZ and EFE positions from 1979 to 2021 and their relationship on the monthly scale using the fifth generation European Centre for Medium-Range Weather Forecasts (ECMWF) reanalysis dataset (ERA5). The research improved methods on determining ITCZ and EFE positions, complementing existing methods. The results show that ITCZ and EFE exhibit a strong correspondence in the Indian Ocean and Marine Continent regions, but a weaker correlation over the Pacific in the climatologically month-mean. The new algorithm could improve the matching situation over the Pacific to some extent. During classical years (super strong El Niño events), the ITCZ exhibited significant north-south position anomalies, which could be indicated by the EFE. Long-term correlation analysis of monthly ITCZ and EFE across different longitudes reveals significant linear correlation in specific regions and months. The strong correspondence between ITCZ and EFE in the Indian Ocean and Maritime Continent arises from the alignment of 850 hPa circulation convergence (ITCZ indicator) and energy flux divergence (EFE indicator), while their substantial separation in the Pacific Ocean explains the weak correlation. These findings suggest that monthly EFE can indicate ITCZ position and reflect its seasonal and interannual variations under certain conditions. The energy framework thus demonstrates utility in analyzing ITCZ position and meridional movement, with its applicability influenced by EFE algorithm selection, geographical region, and seasonal timing.
-

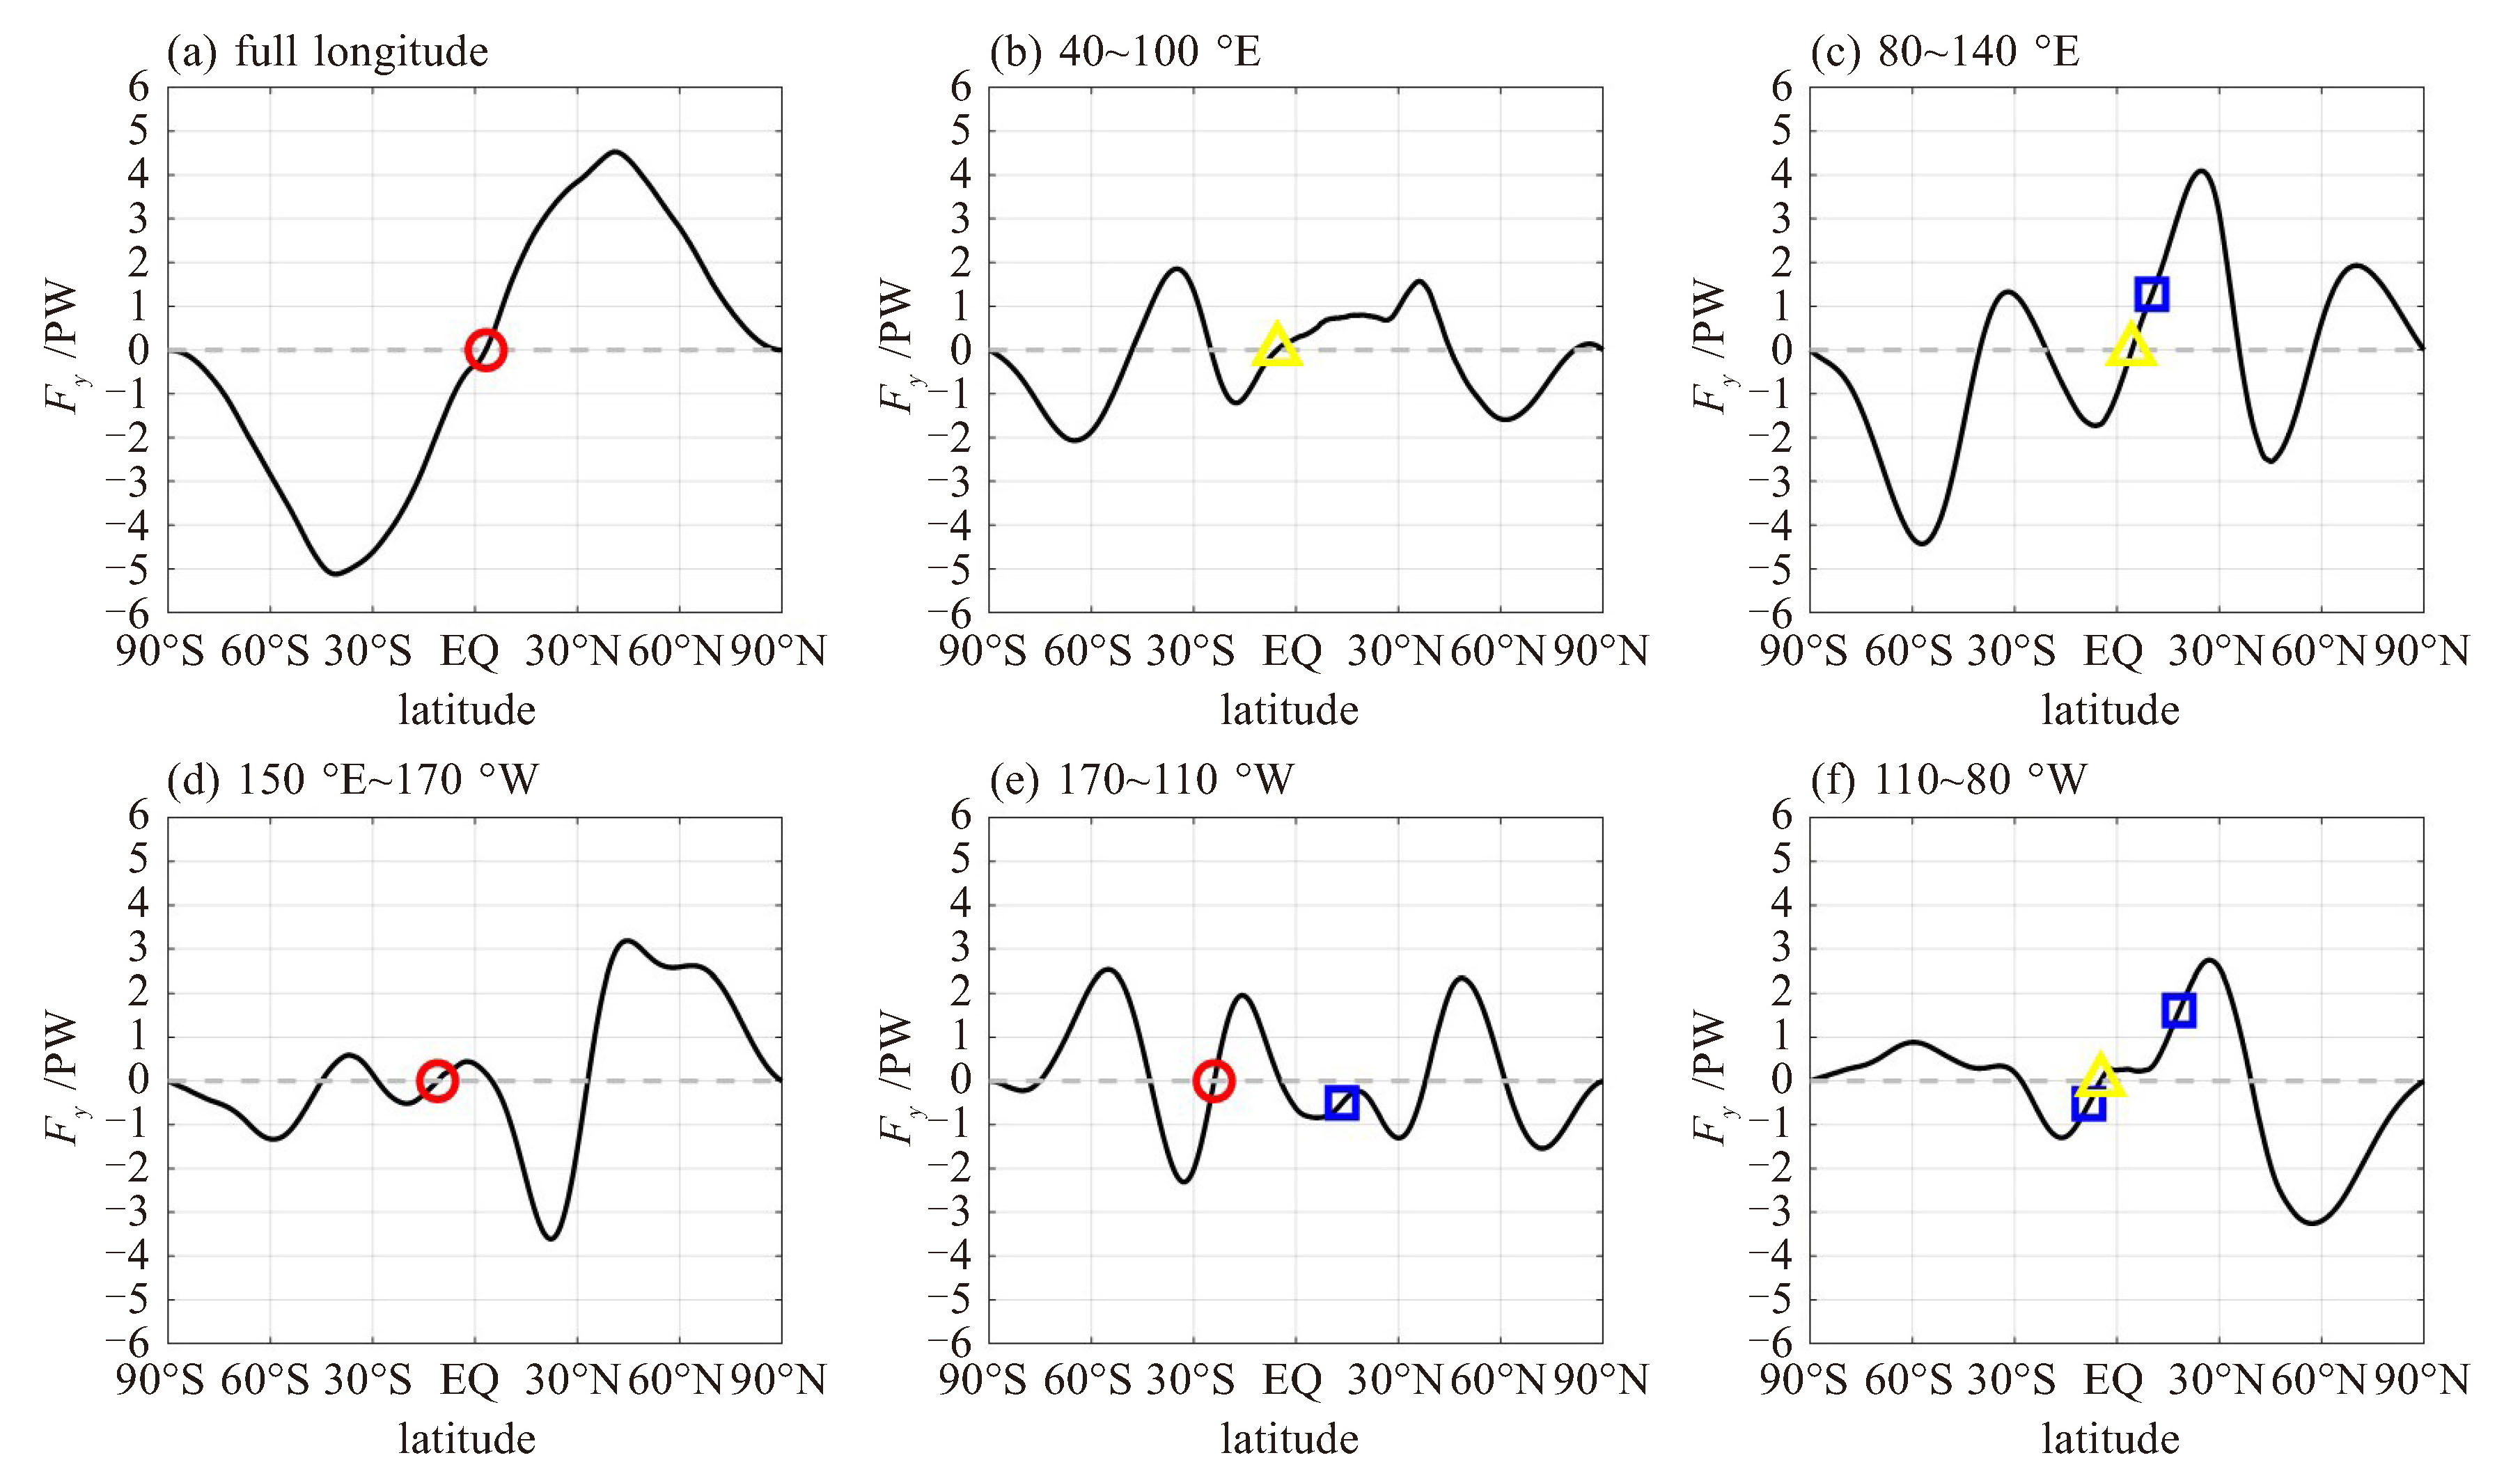
图 1 不同经度范围内的气候年平均经向能量通量垂直积分随纬度分布
a~f分别代表全经度、印度洋(40~100 °E)、海洋性大陆(80~140 °E)、西太平洋(150 °E~170 °W)、中太平洋(170~110 °W)、东太平洋(110~80 °W)。图中黄色三角形标示位置为Fy递增零点,蓝色矩形标示位置为$\partial$Fy/$\partial$y正极大值点,红色圆形标示位置同时为Fy递增零点和$\partial$Fy/$\partial$y正极大值点,这些位置的查找仅考虑30 °N~30 °S范围内。

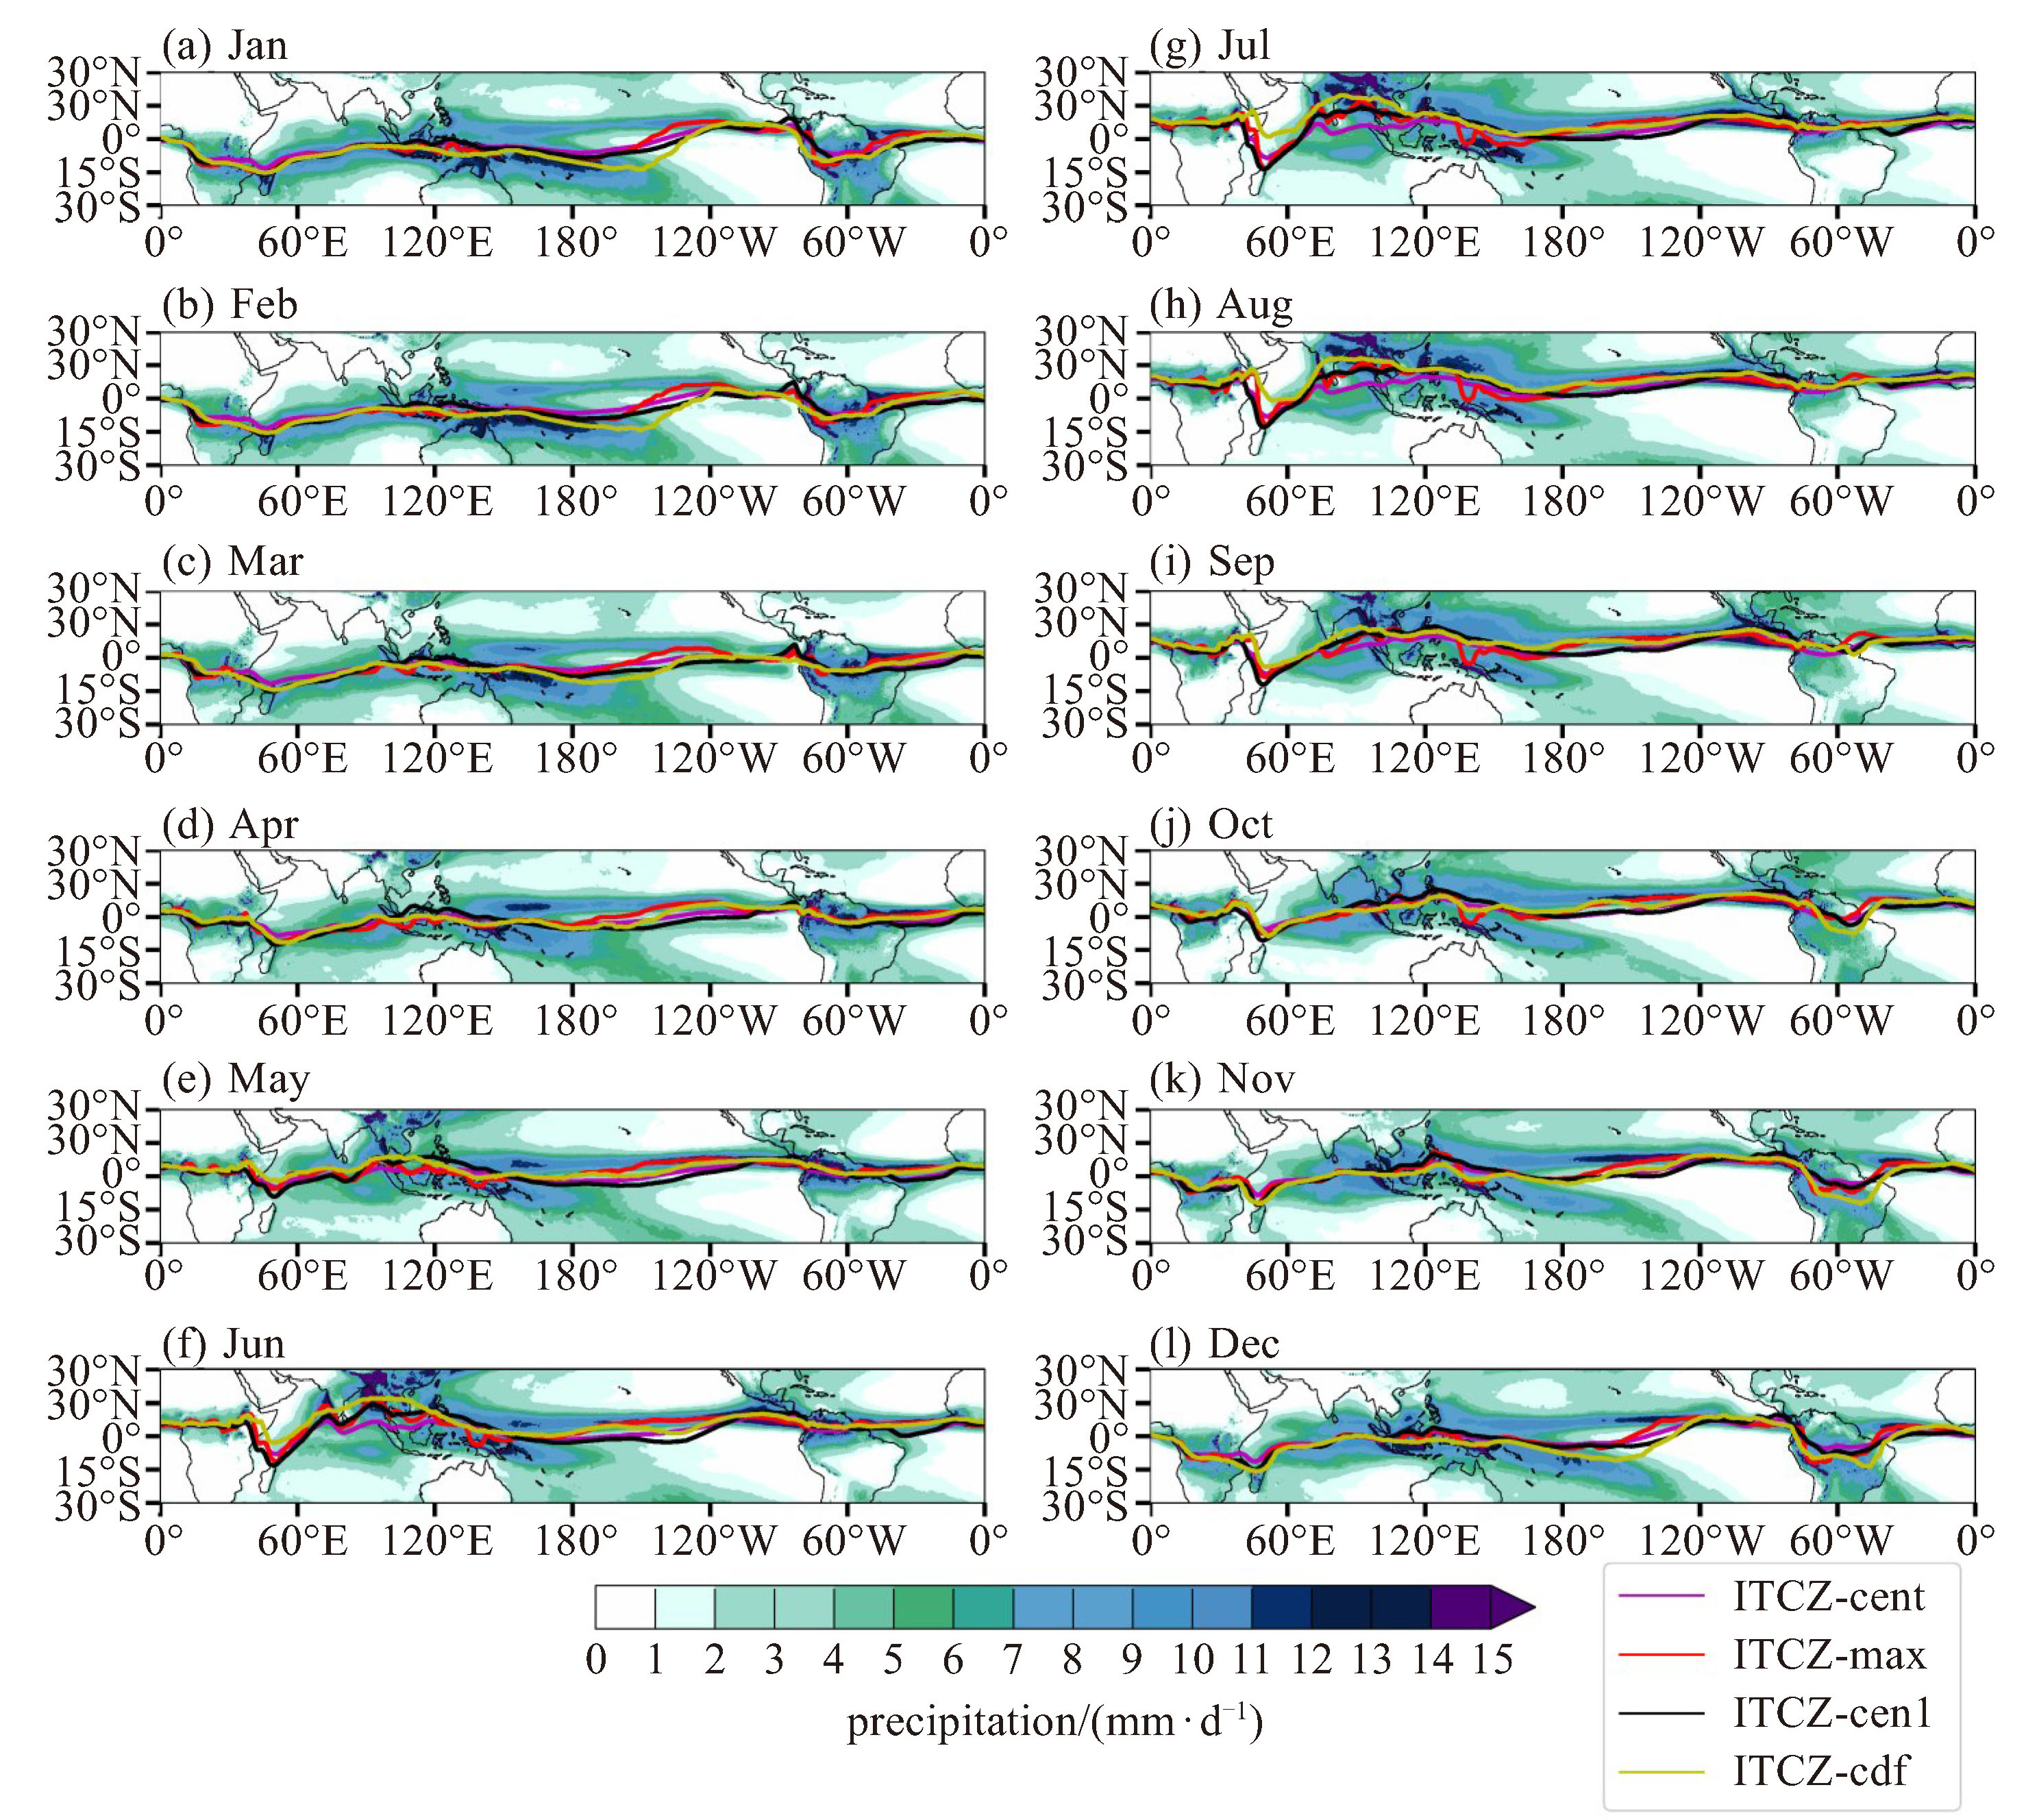
图 2 四种ITCZ算法结果与ITCZ降水带
a~l分别为1—12月的月平均气候态。紫、红、黑、黄线分别代表ITCZ-cent、ITCZ-max、ITCZ-cen1和ITCZ-cdf算法的结果,填色表示降水量(单位:mm·d-1)。

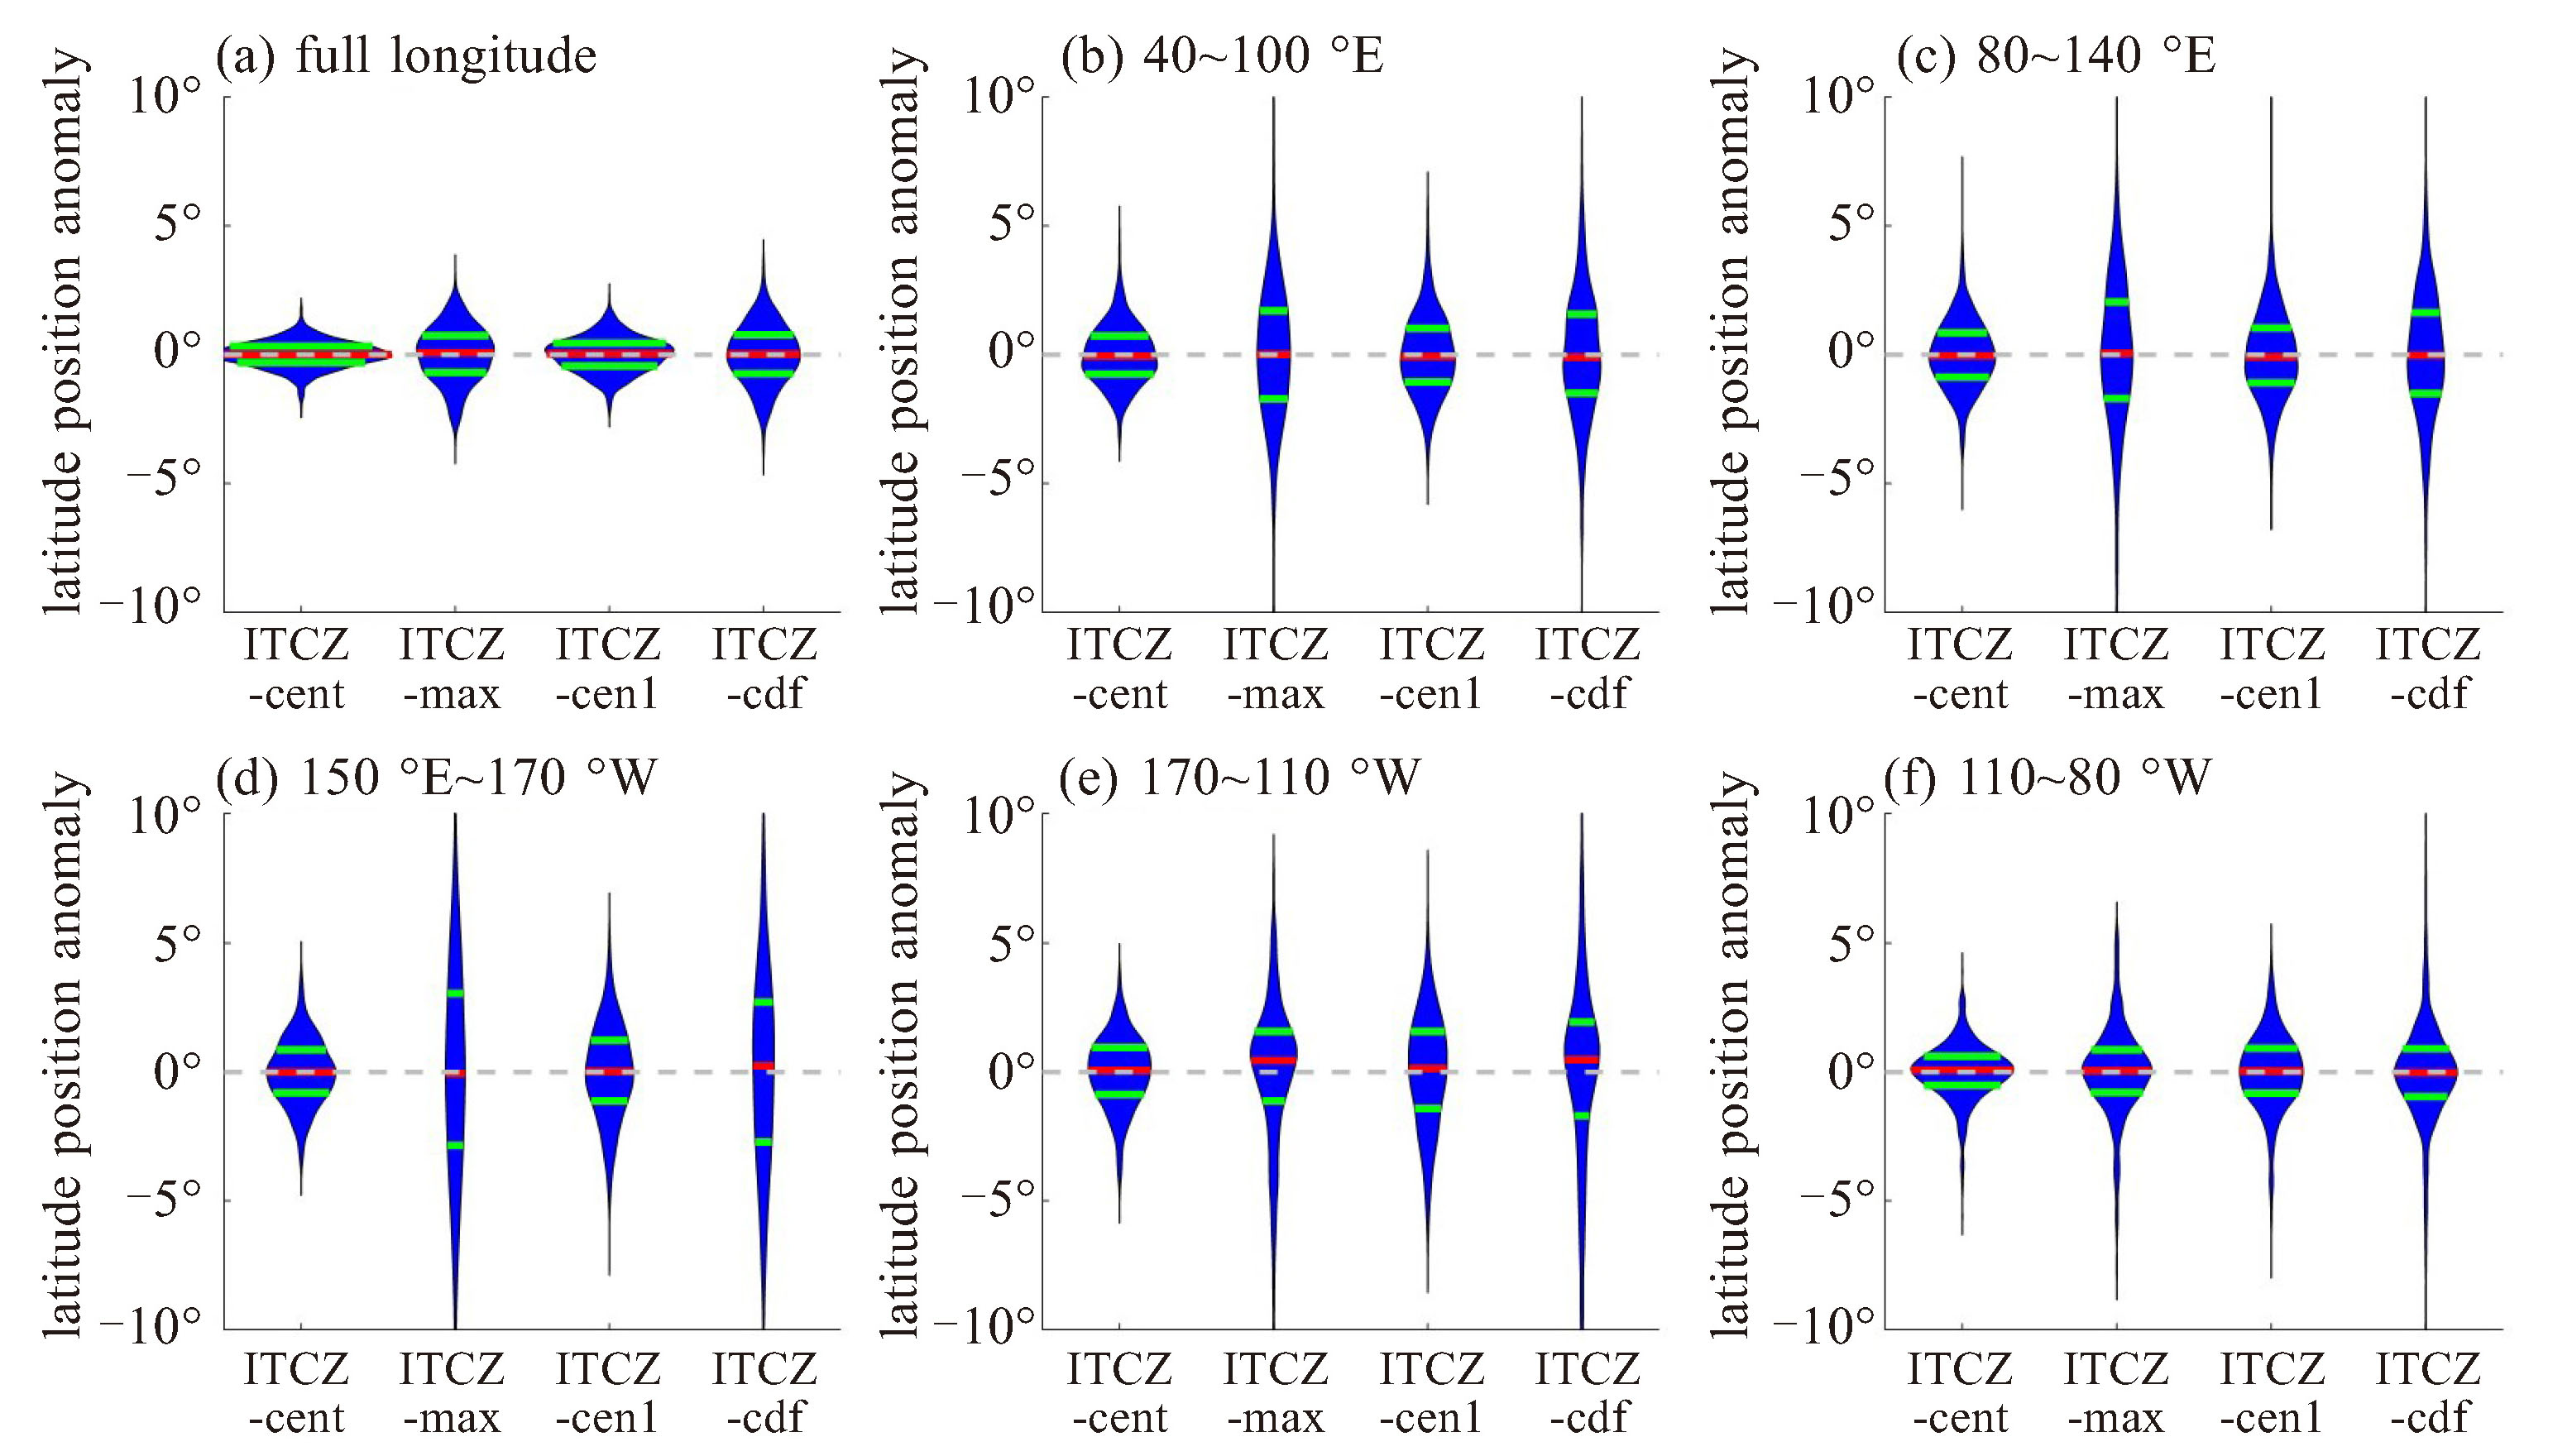
图 3 不同算法计算的1950—2021年月平均ITCZ位置(单位:°)的年内变化琴状图(已去除年际趋势)
a~f分别为全经度、印度洋(40~100 °E)、中东印度洋和海洋性大陆(80~140 °E)、西太平洋(150 °E~170 °W)、中太平洋(170~110 °W)、东太平洋(110~80 °W)上的平均结果。红线表示中位数,绿线表示上下四分位数,琴宽度表示概率密度大小。

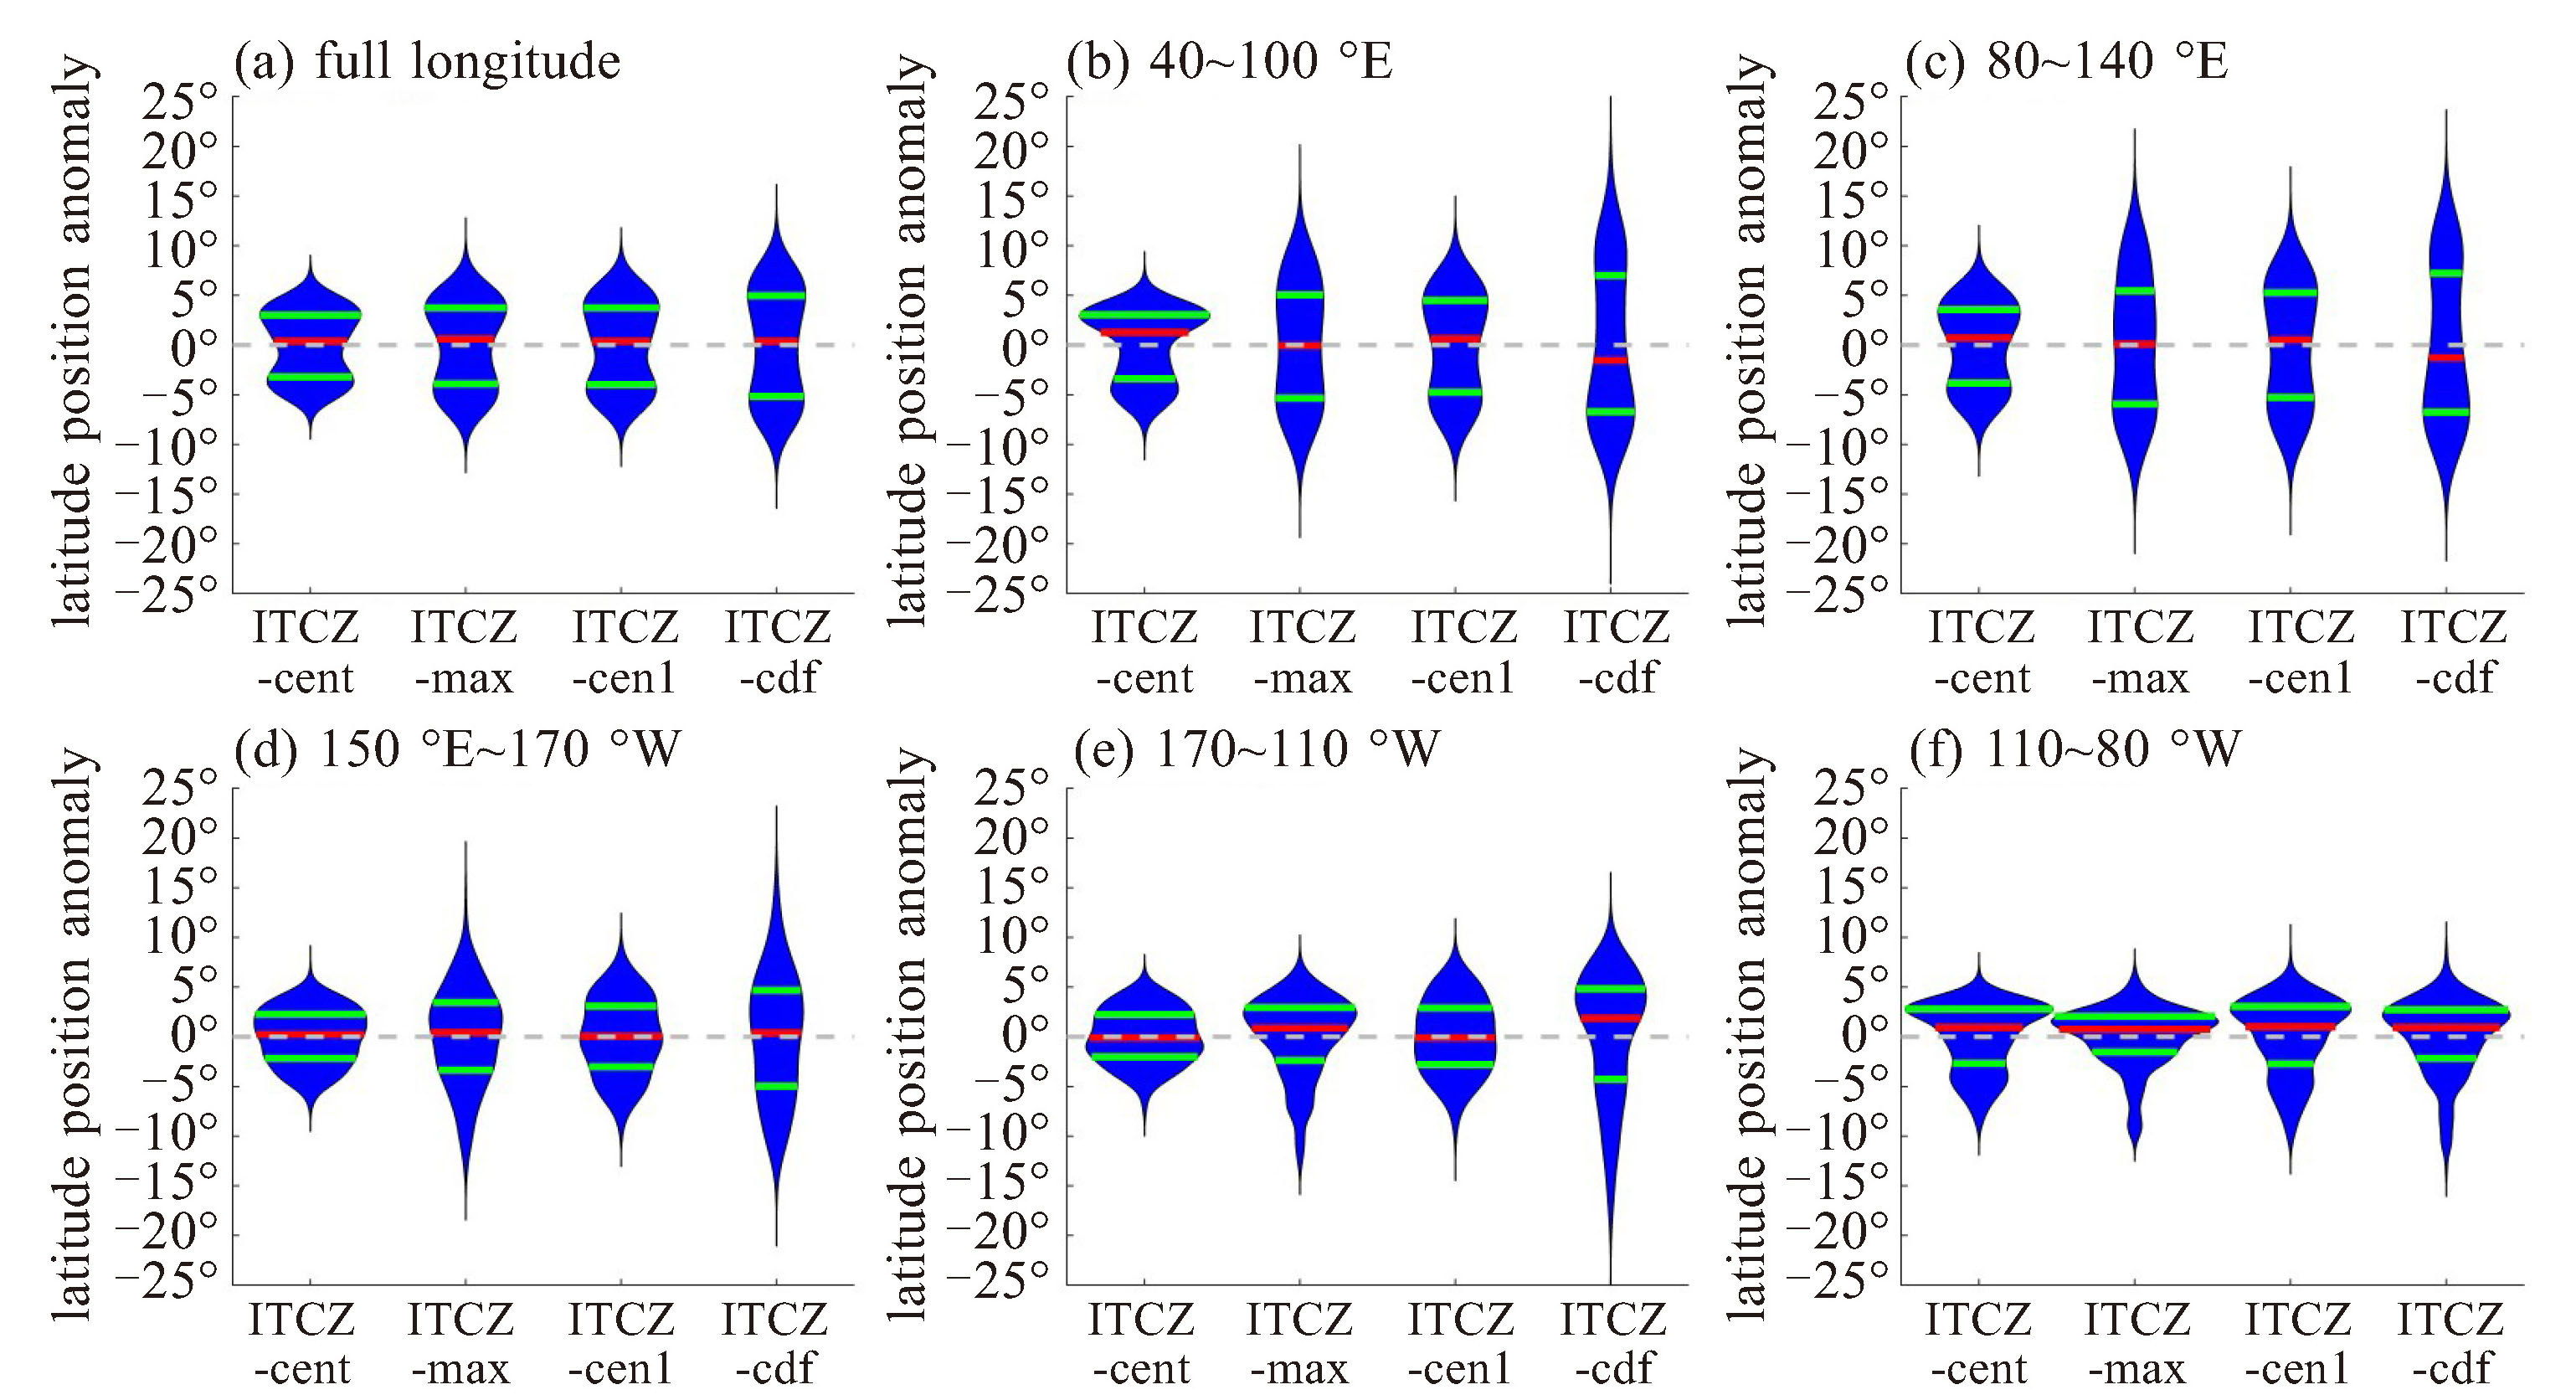
图 4 不同算法计算的1950—2021年月平均ITCZ位置相对于其气候态月平均的异常(单位:°)的琴状图
a~f分别为全经度、印度洋(40~100 °E)、中东印度洋和海洋性大陆(80~140 °E)、西太平洋(150 °E~170 °W)、中太平洋(170~110 °W)、东太平洋(110~80 °W)上的平均结果。红线表示中位数,绿线表示上下四分位数,琴宽度表示概率密度大小。

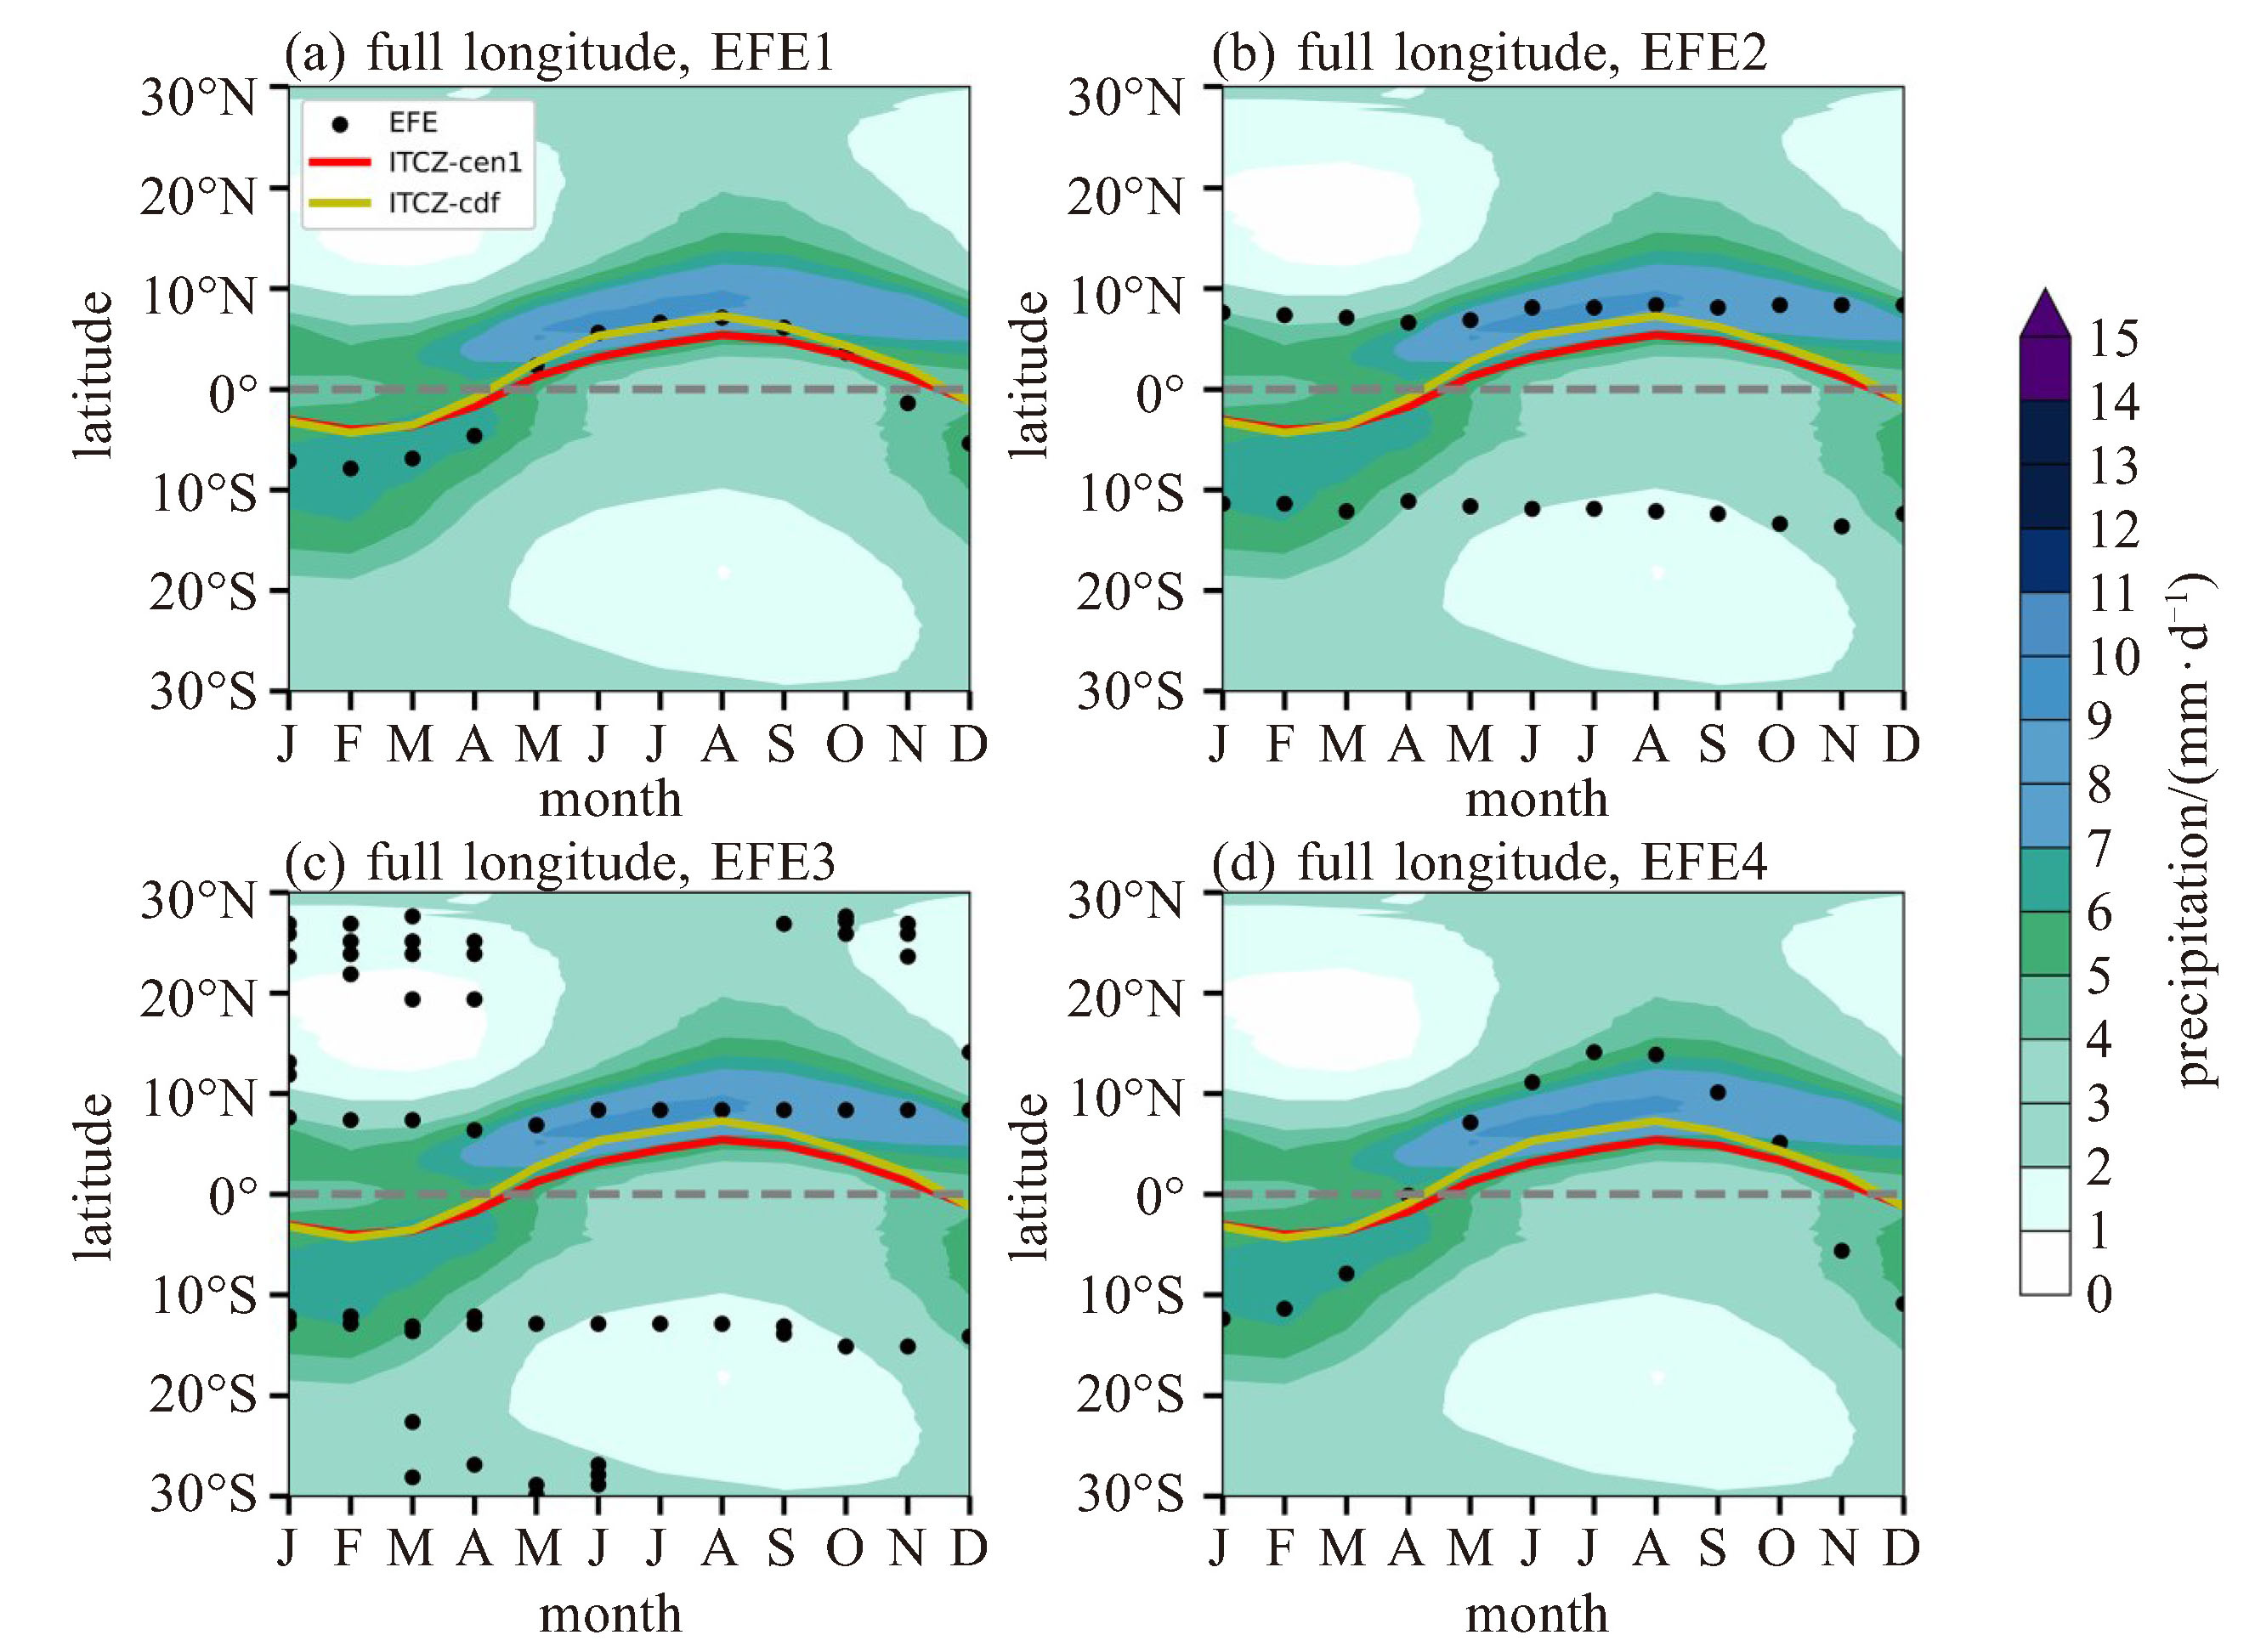
图 5 纬圈平均上气候月平均EFE与ITCZ位置的逐月变化(单位:°)
红、黄线分别表示通过ITCZ-cen1和ITCZ-cdf算法得到的ITCZ位置逐月变化,黑点表示EFE位置,填色表示范围内的平均降水(单位:mm·d-1)。(a)~(d)分别显示通过EFE1~EFE4四种算法得出的EFE位置。

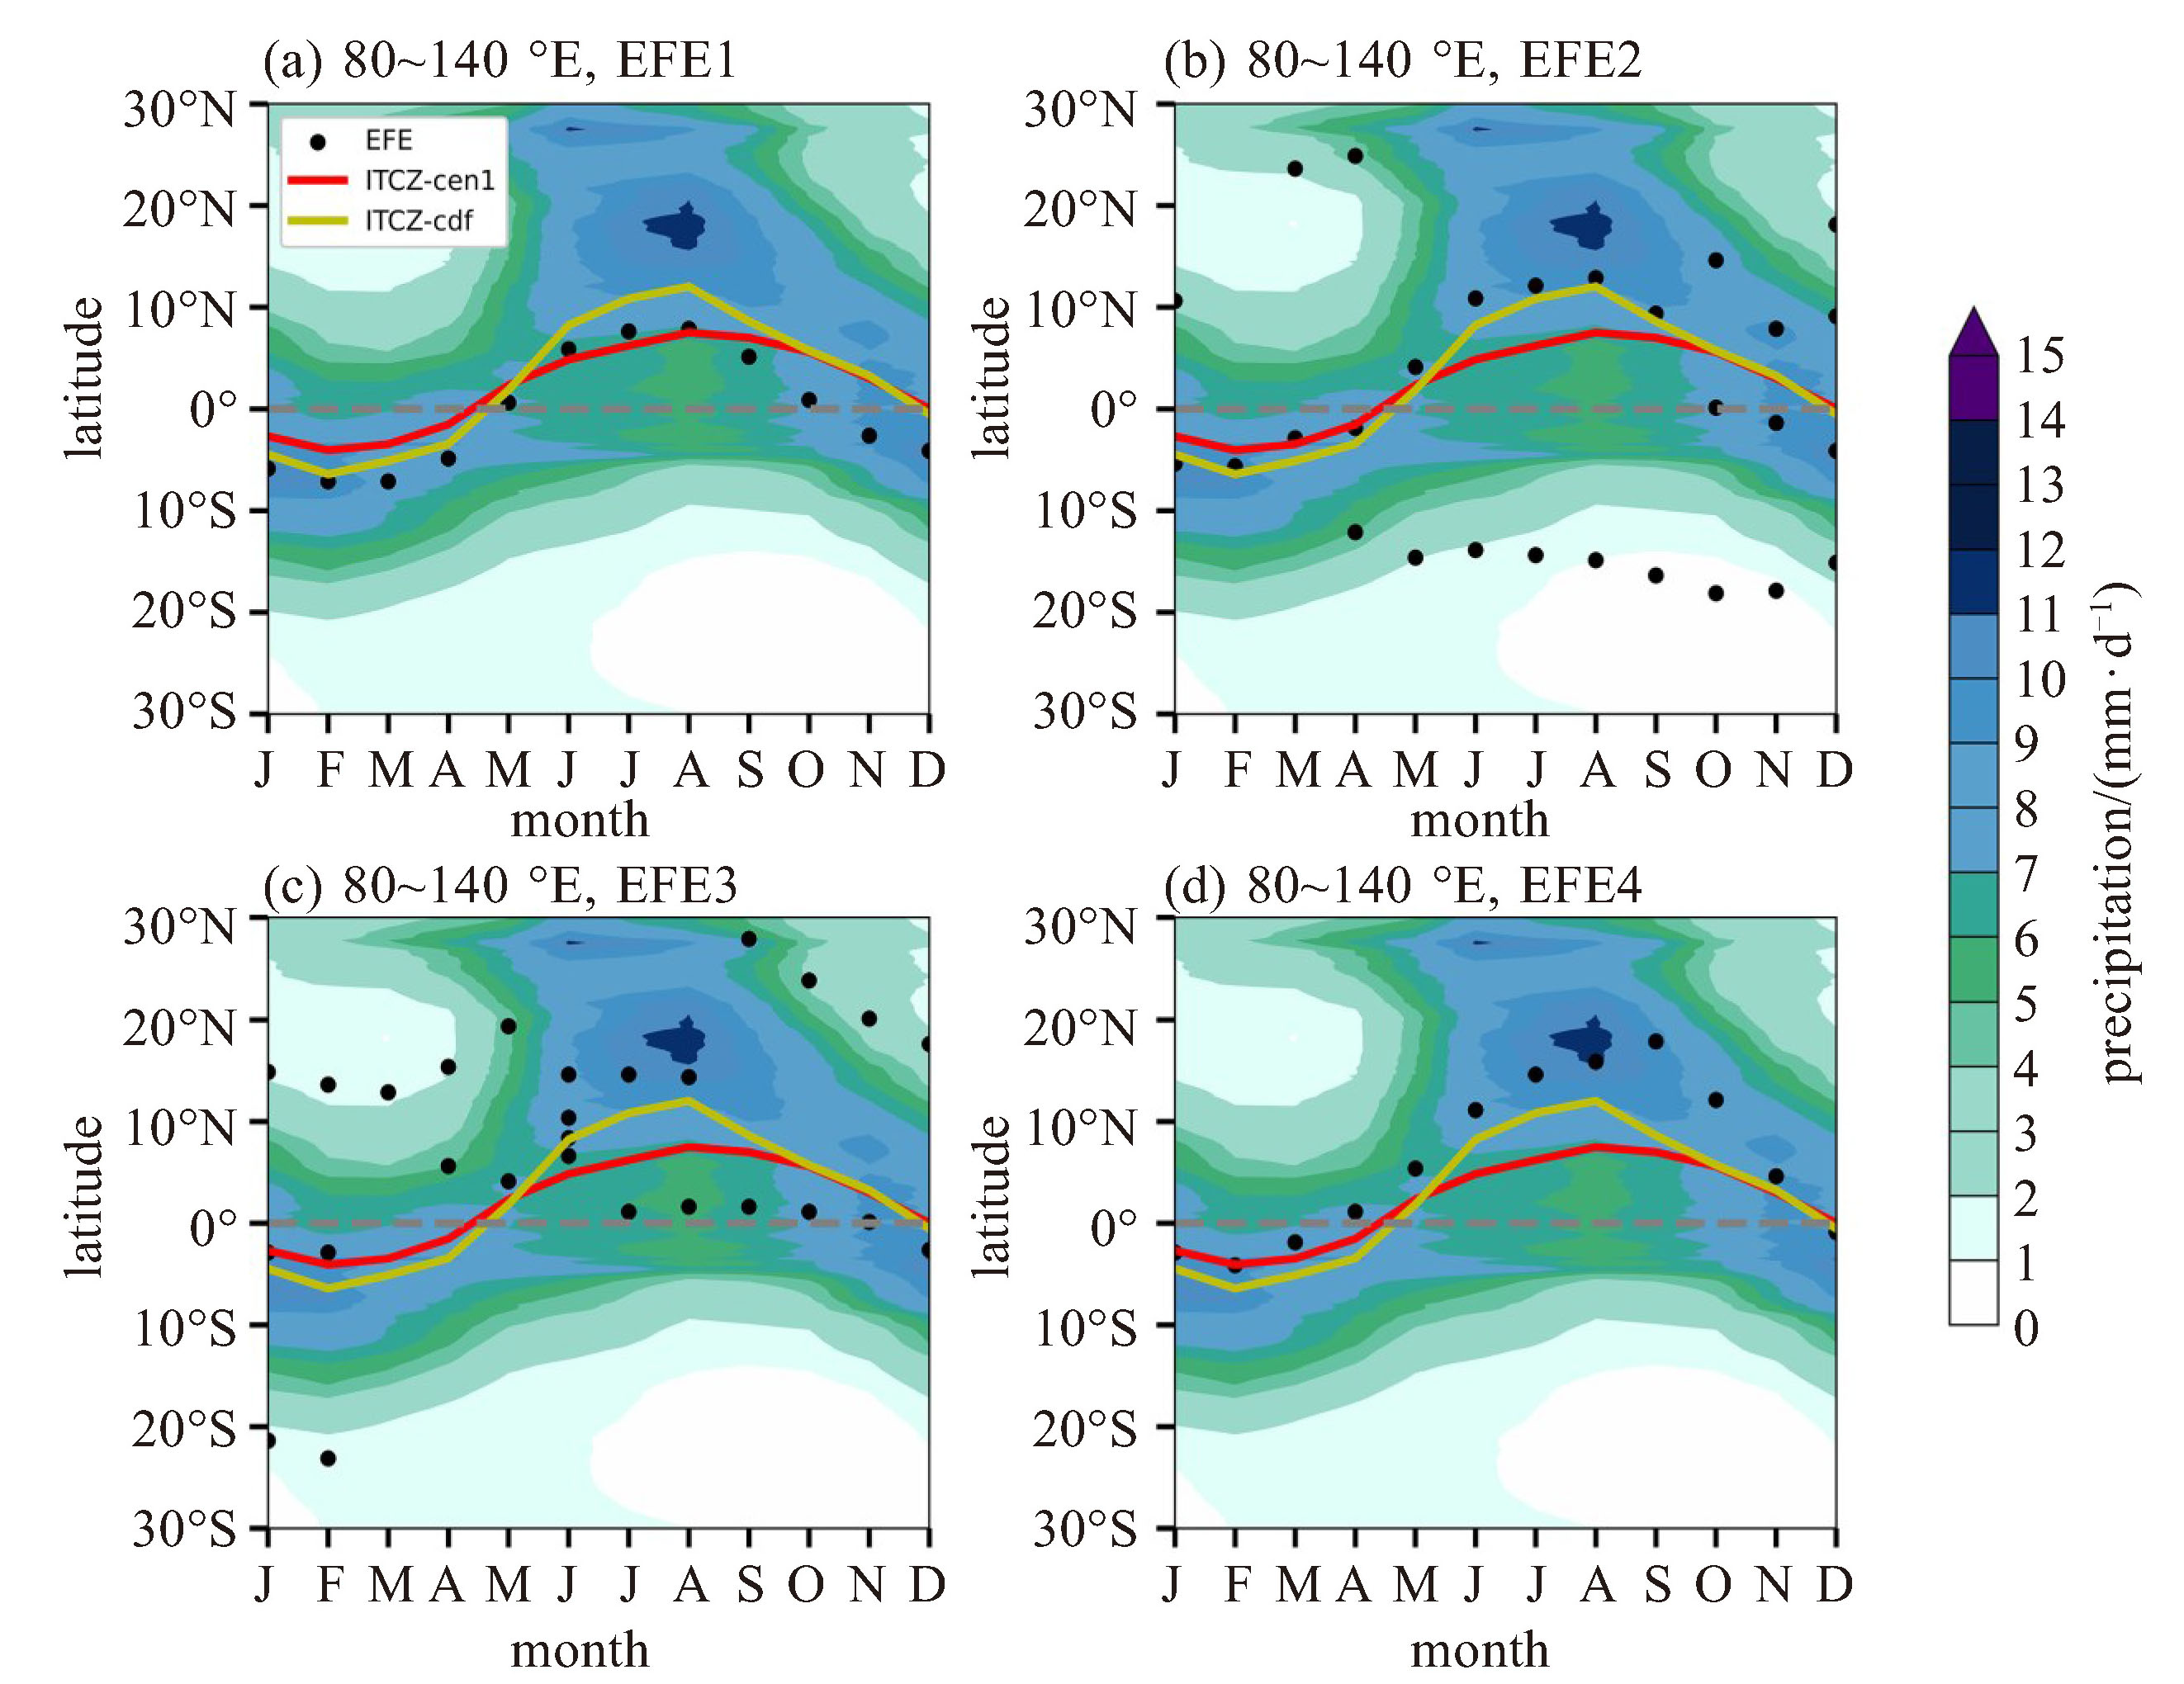
图 6 中东印度洋和海洋性大陆上(80~140 °E)气候月平均EFE与ITCZ位置的逐月变化(单位:°)
红、黄线分别表示通过ITCZ-cen1和ITCZ-cdf算法得到的ITCZ位置逐月变化,黑点表示EFE位置,填色表示范围内的平均降水(单位:mm·d-1)。a~d分别显示通过EFE1~EFE4四种算法得出的EFE位置。

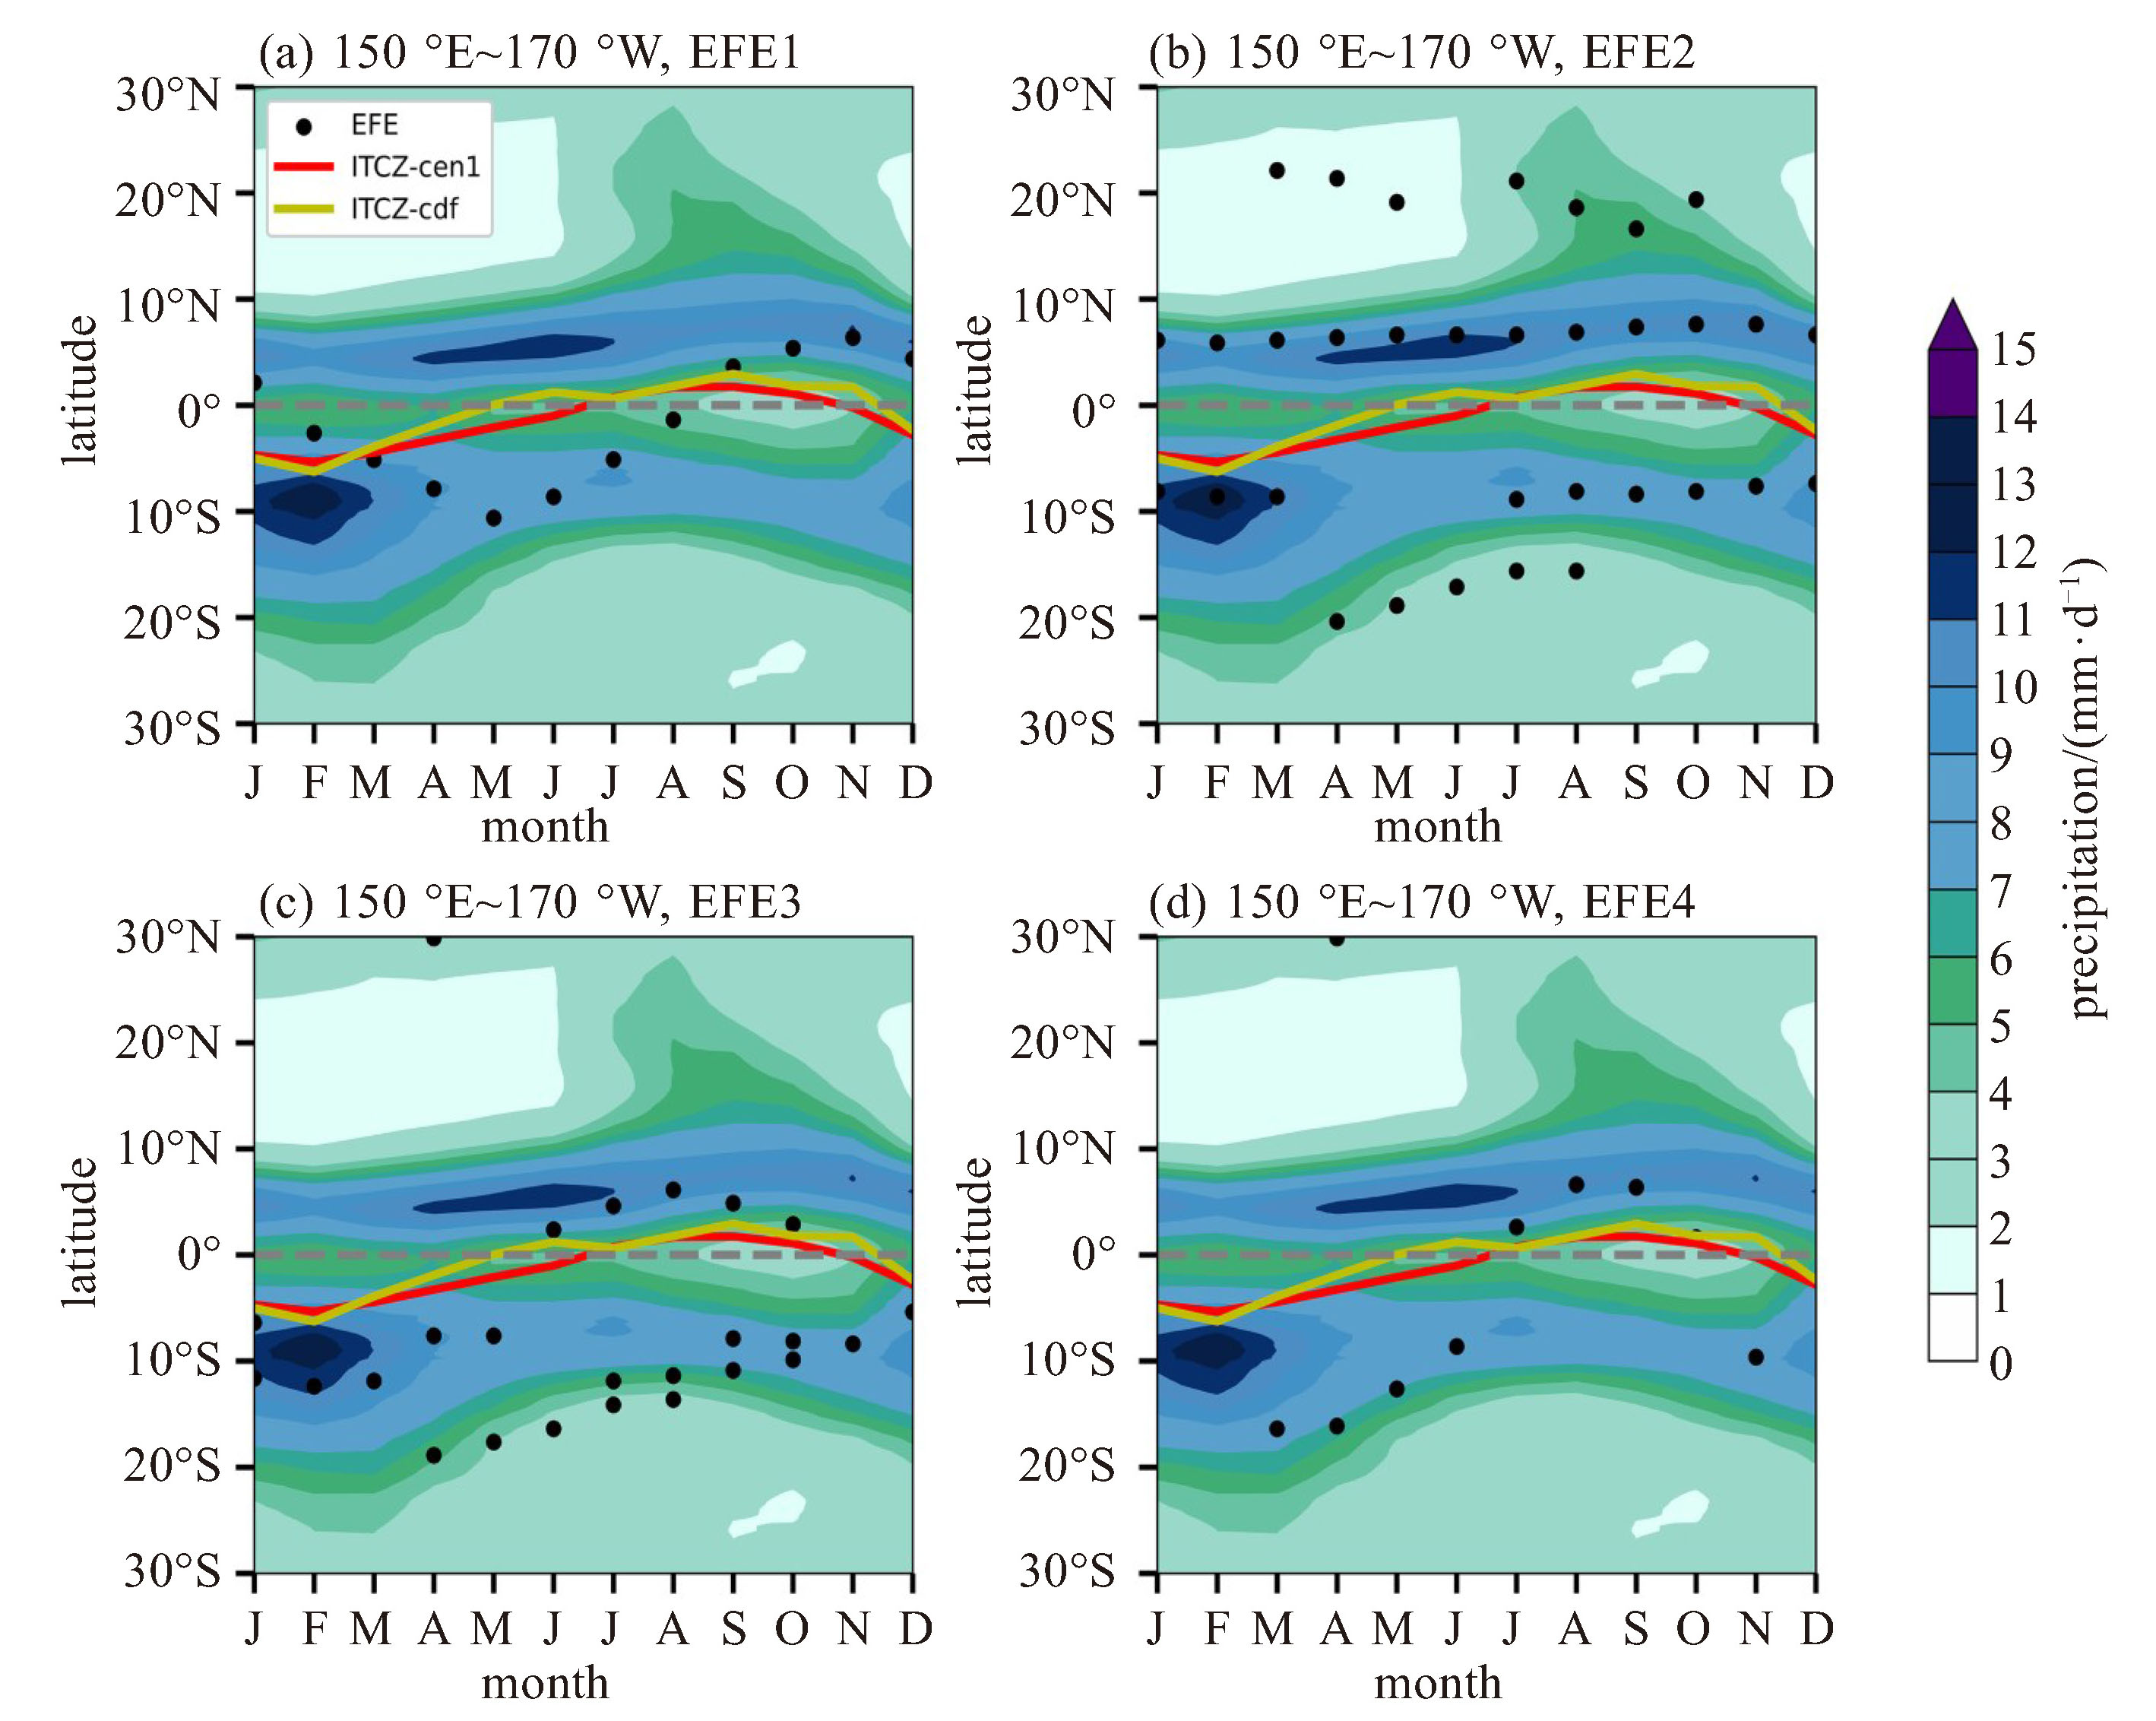
图 7 西太平洋上(150~190 °E)气候月平均EFE与ITCZ位置的逐月变化(单位:°)
红、黄线分别表示通过ITCZ-cen1和ITCZ-cdf算法得到的ITCZ位置逐月变化,黑点表示EFE位置,填色表示范围内的平均降水(单位:mm·d-1)。a~d分别显示通过EFE1~EFE4四种算法得出的EFE位置。

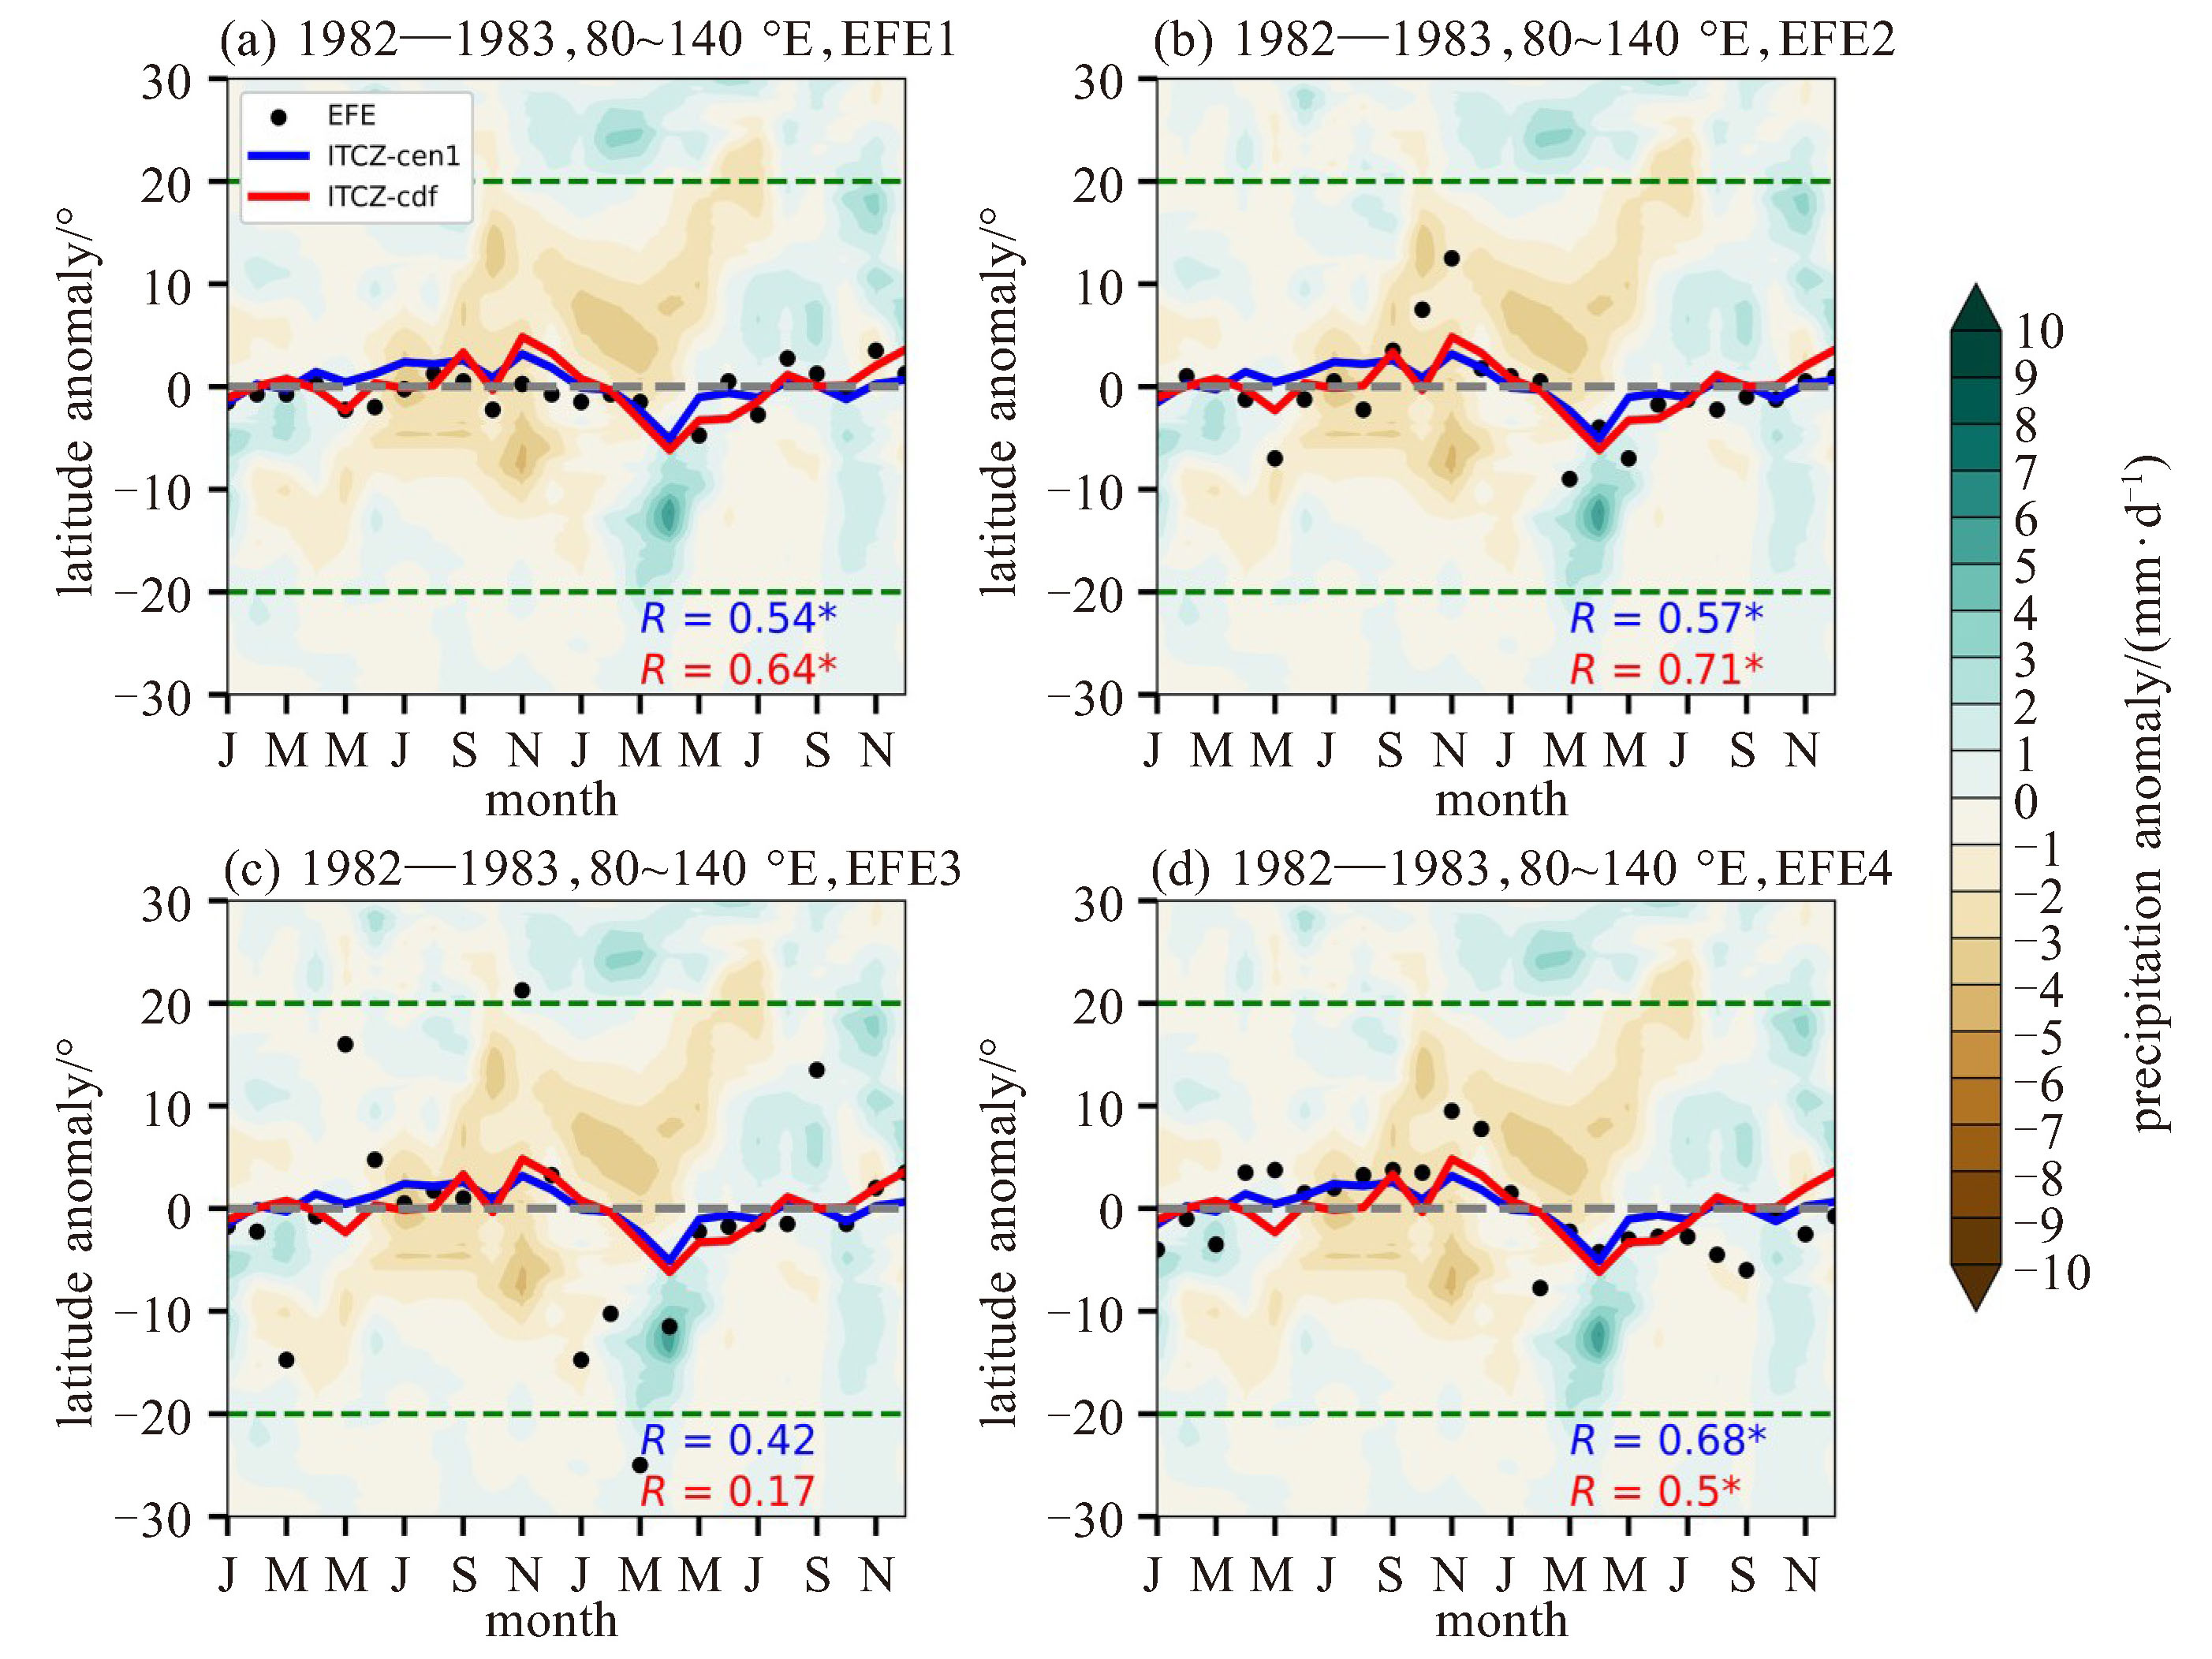
图 8 1982/1983年超强El Niño事件期间中东印度洋和海洋性大陆上(80~140 °E)ITCZ和EFE位置的逐月变化情况(已去掉1979—2021年气候月平均)
蓝、红线分别表示通过ITCZ-cen1和ITCZ-cdf算法得到的ITCZ位置异常逐月变化,黑点表示EFE位置异常,填色表示范围内的平均降水异常(单位:mm·d-1)。a~d分别显示通过EFE1~EFE4四种算法得出的EFE位置异常。R为通过两种ITCZ算法得出的ITCZ位置异常分别与EFE位置异常的逐月变化的相关系数,带星号表示通过α=0.05的显著性检验,文本颜色与代表ITCZ的实线颜色对应,计算相关系数时剔除了离群的EFE点(纬度异常超过20 °,位于图中绿色虚线以外)。

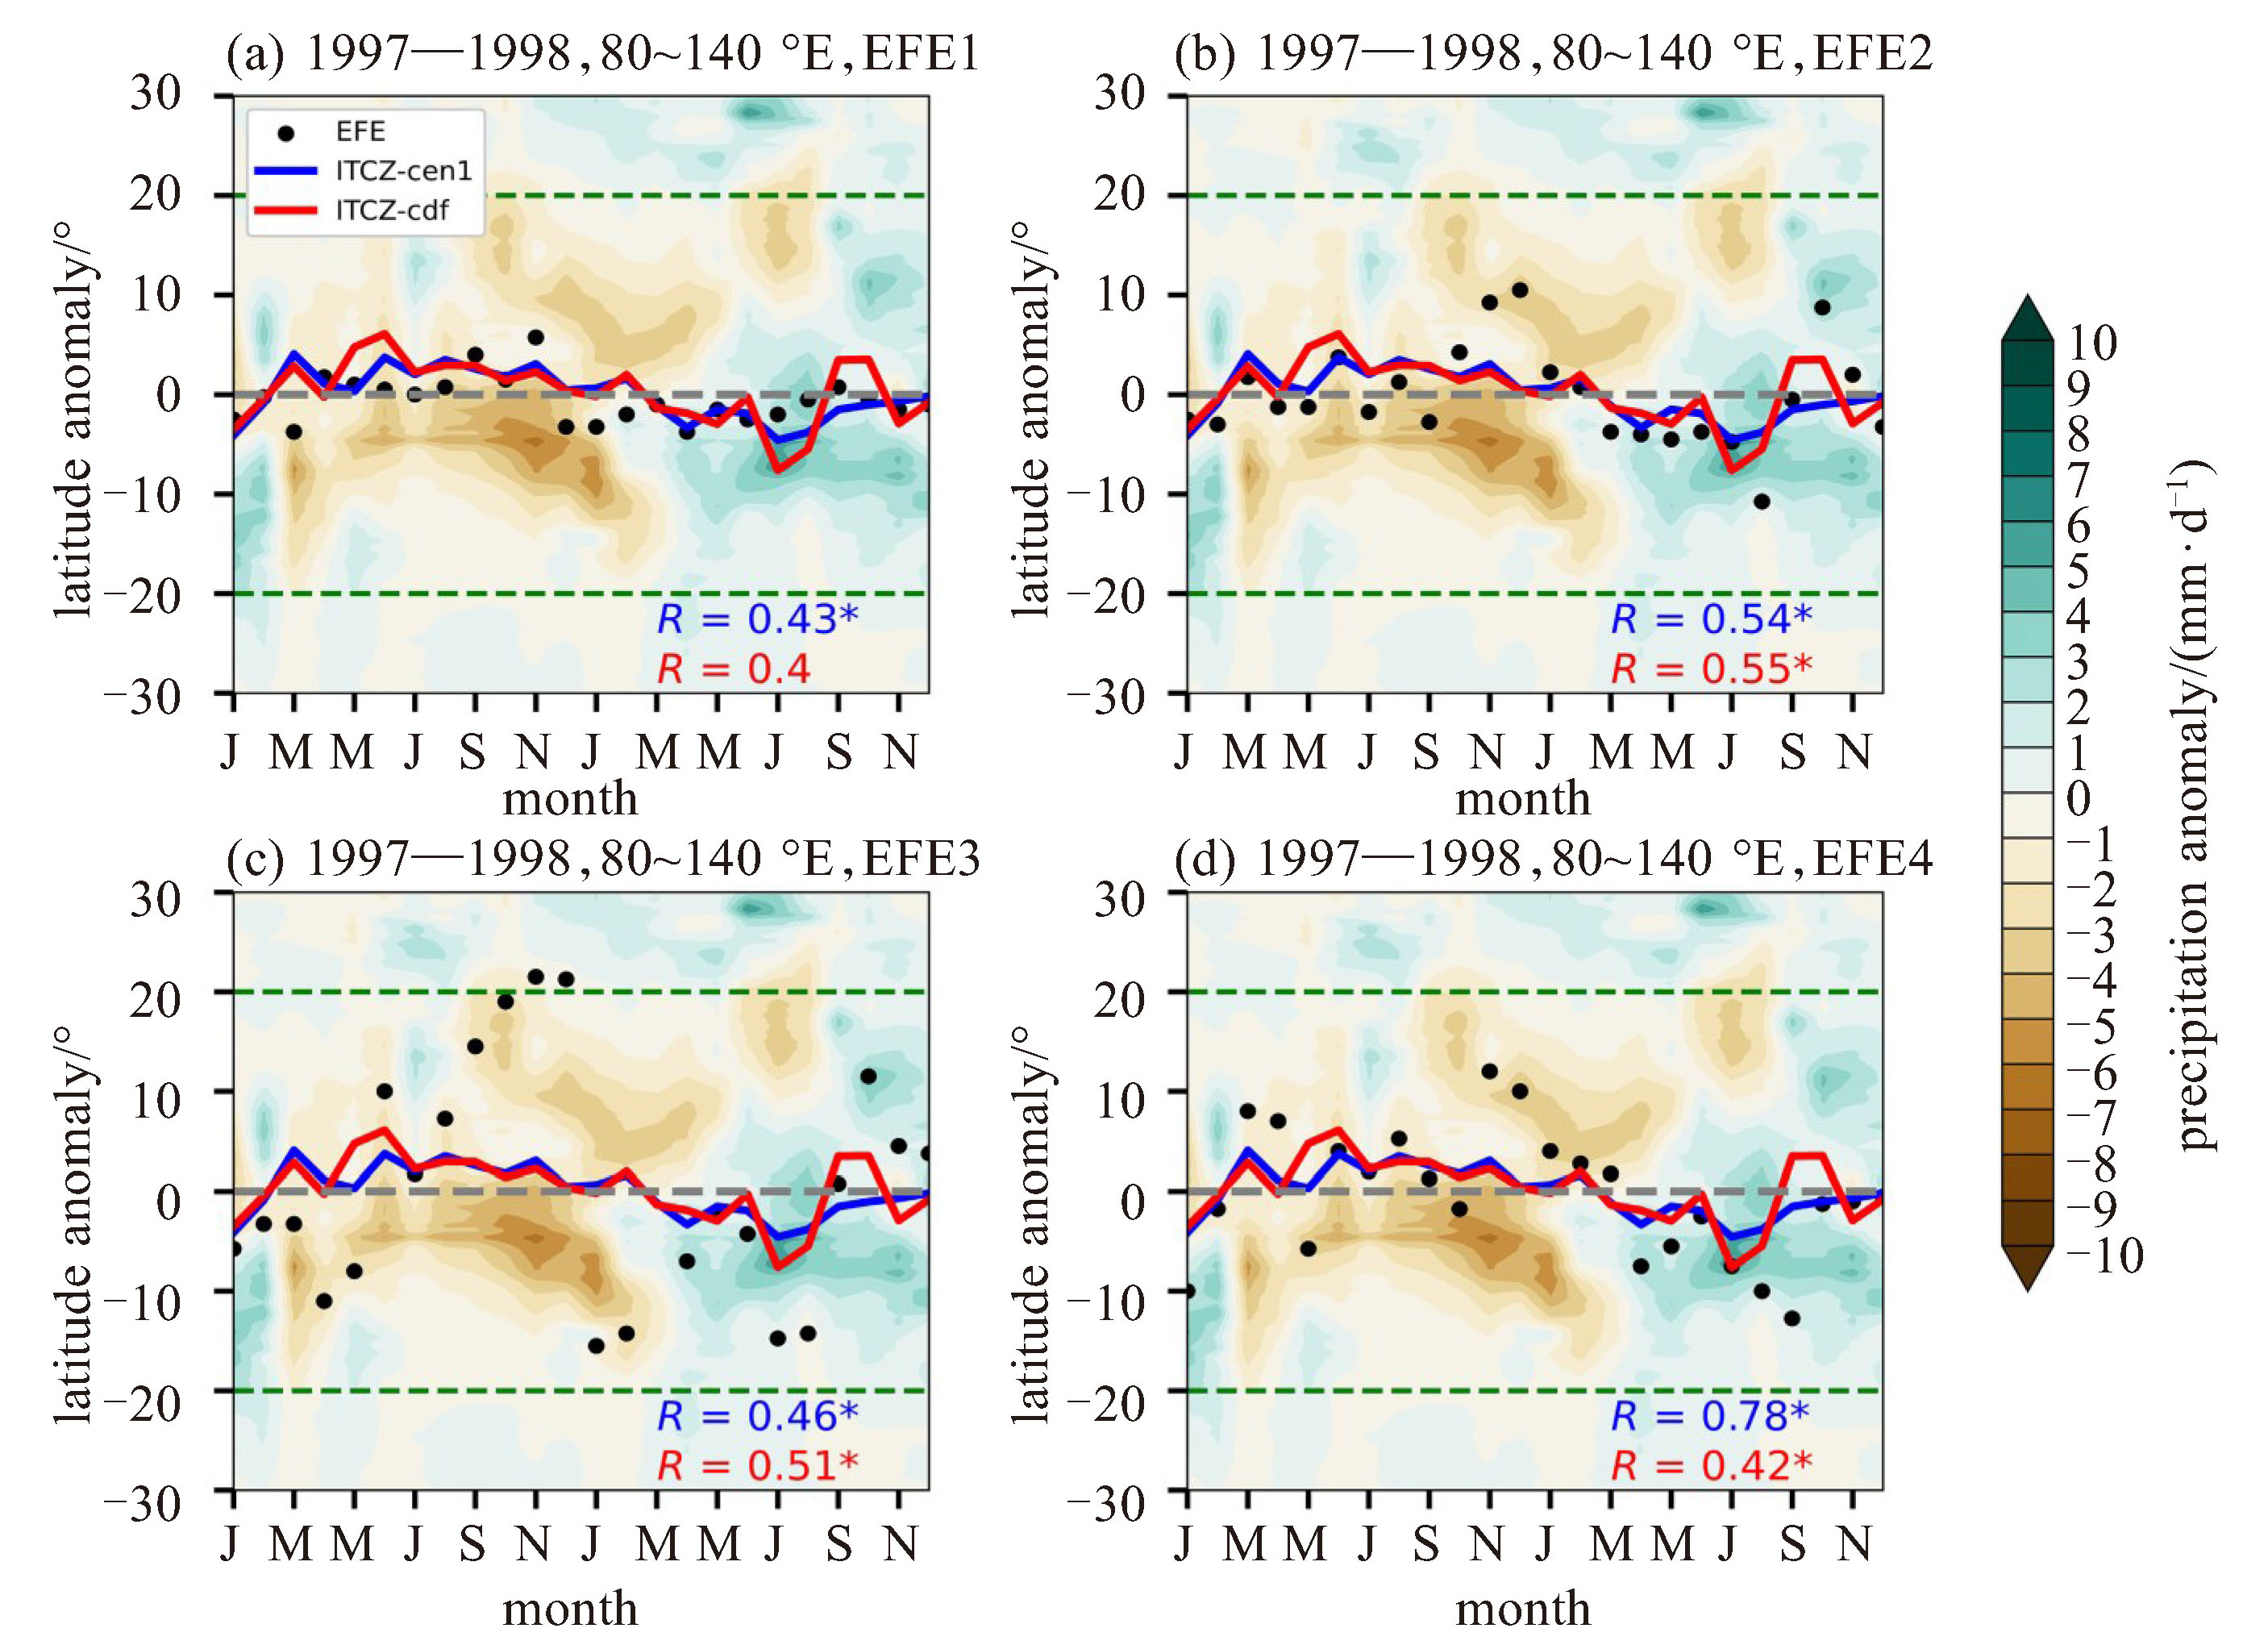
图 9 1997/1998年超强El Niño事件期间中东印度洋和海洋性大陆上(80~140 °E)ITCZ和EFE位置的逐月变化情况(已去掉1979—2021年气候月平均)
蓝、红线分别表示通过ITCZ-cen1和ITCZ-cdf算法得到的ITCZ位置异常逐月变化,黑点表示EFE位置异常,填色表示范围内的平均降水异常(单位:mm·d-1。a~d分别显示通过EFE1~EFE4四种算法得出的EFE位置异常。R为通过两种ITCZ算法得出的ITCZ位置异常分别与EFE位置异常的逐月变化的相关系数,带星号表示通过α=0.05的显著性检验,文本颜色与代表ITCZ的实线颜色对应,计算相关系数时剔除了离群的EFE点(纬度异常超过20 °,位于图中绿色虚线以外)。

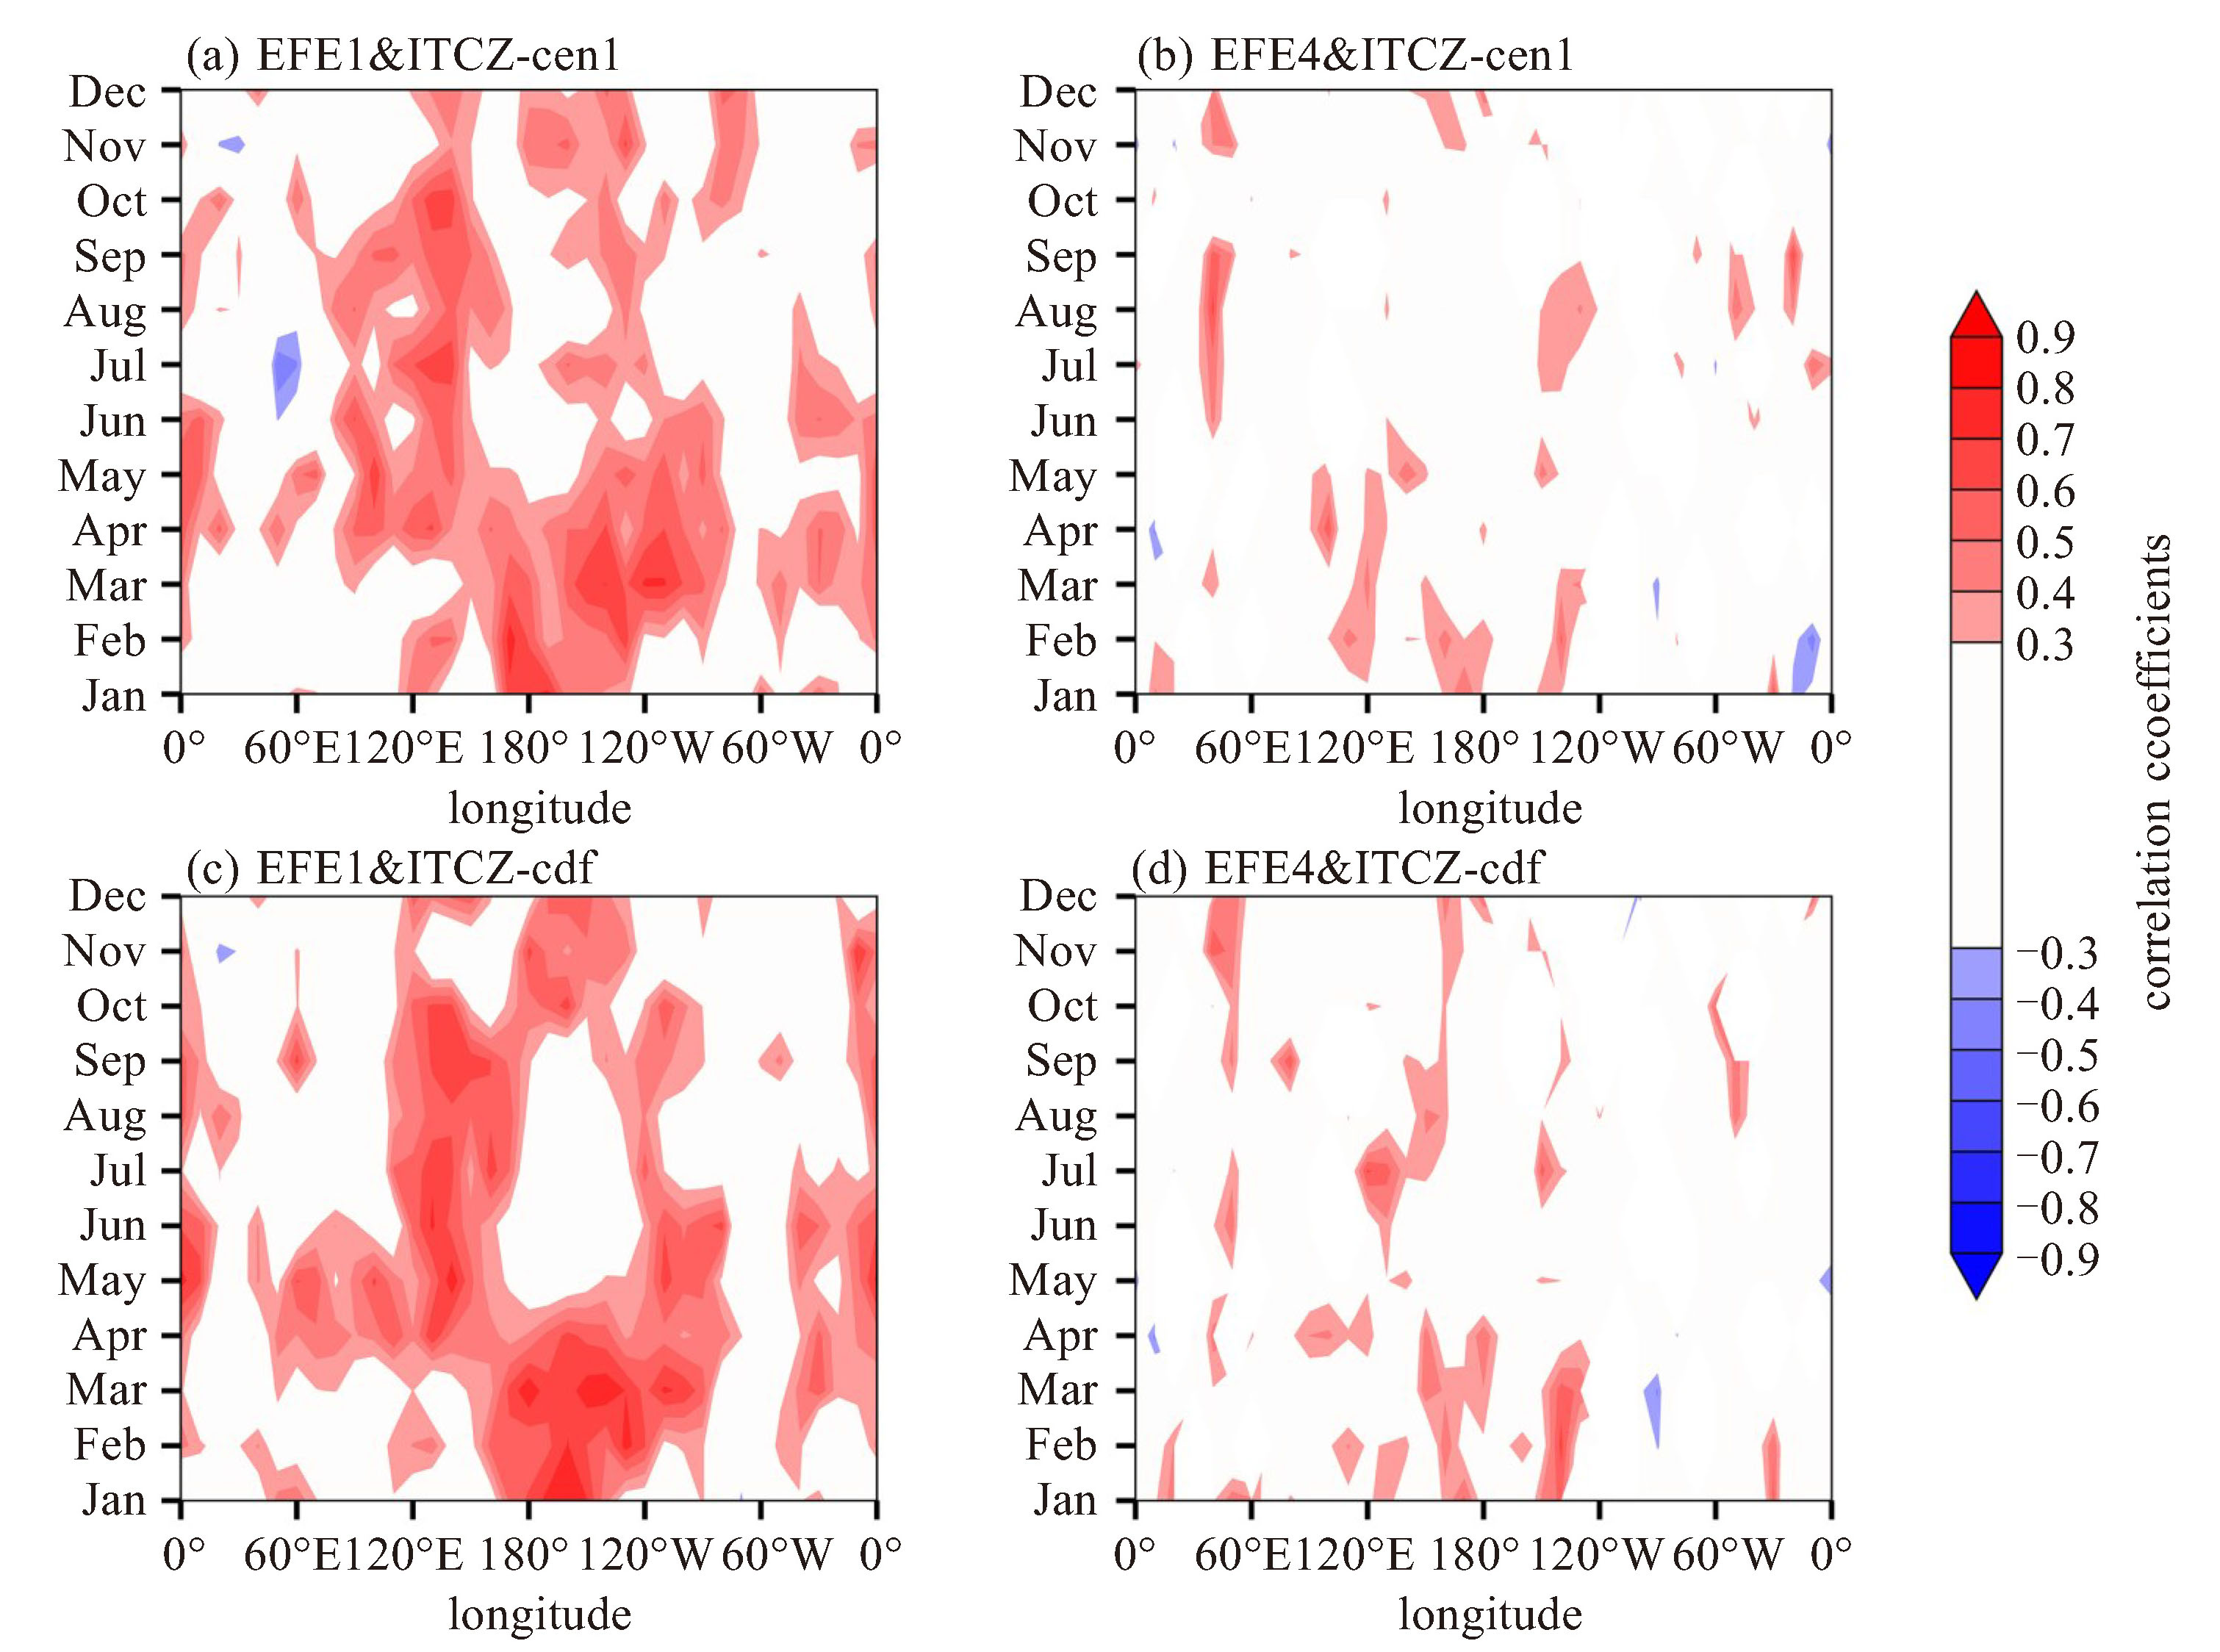
图 10 ITCZ-cen1(a、b)、ITCZ-cdf(c、d)与EFE1(a、c)、EFE4(b、d)在不同经度、月份上的1979—2021年年际上的相关系数
仅显示通过α=0.05的显著性检验的部分。计算相关系数所使用的EFE与ITCZ的时间序列均去除了长期线性趋势。

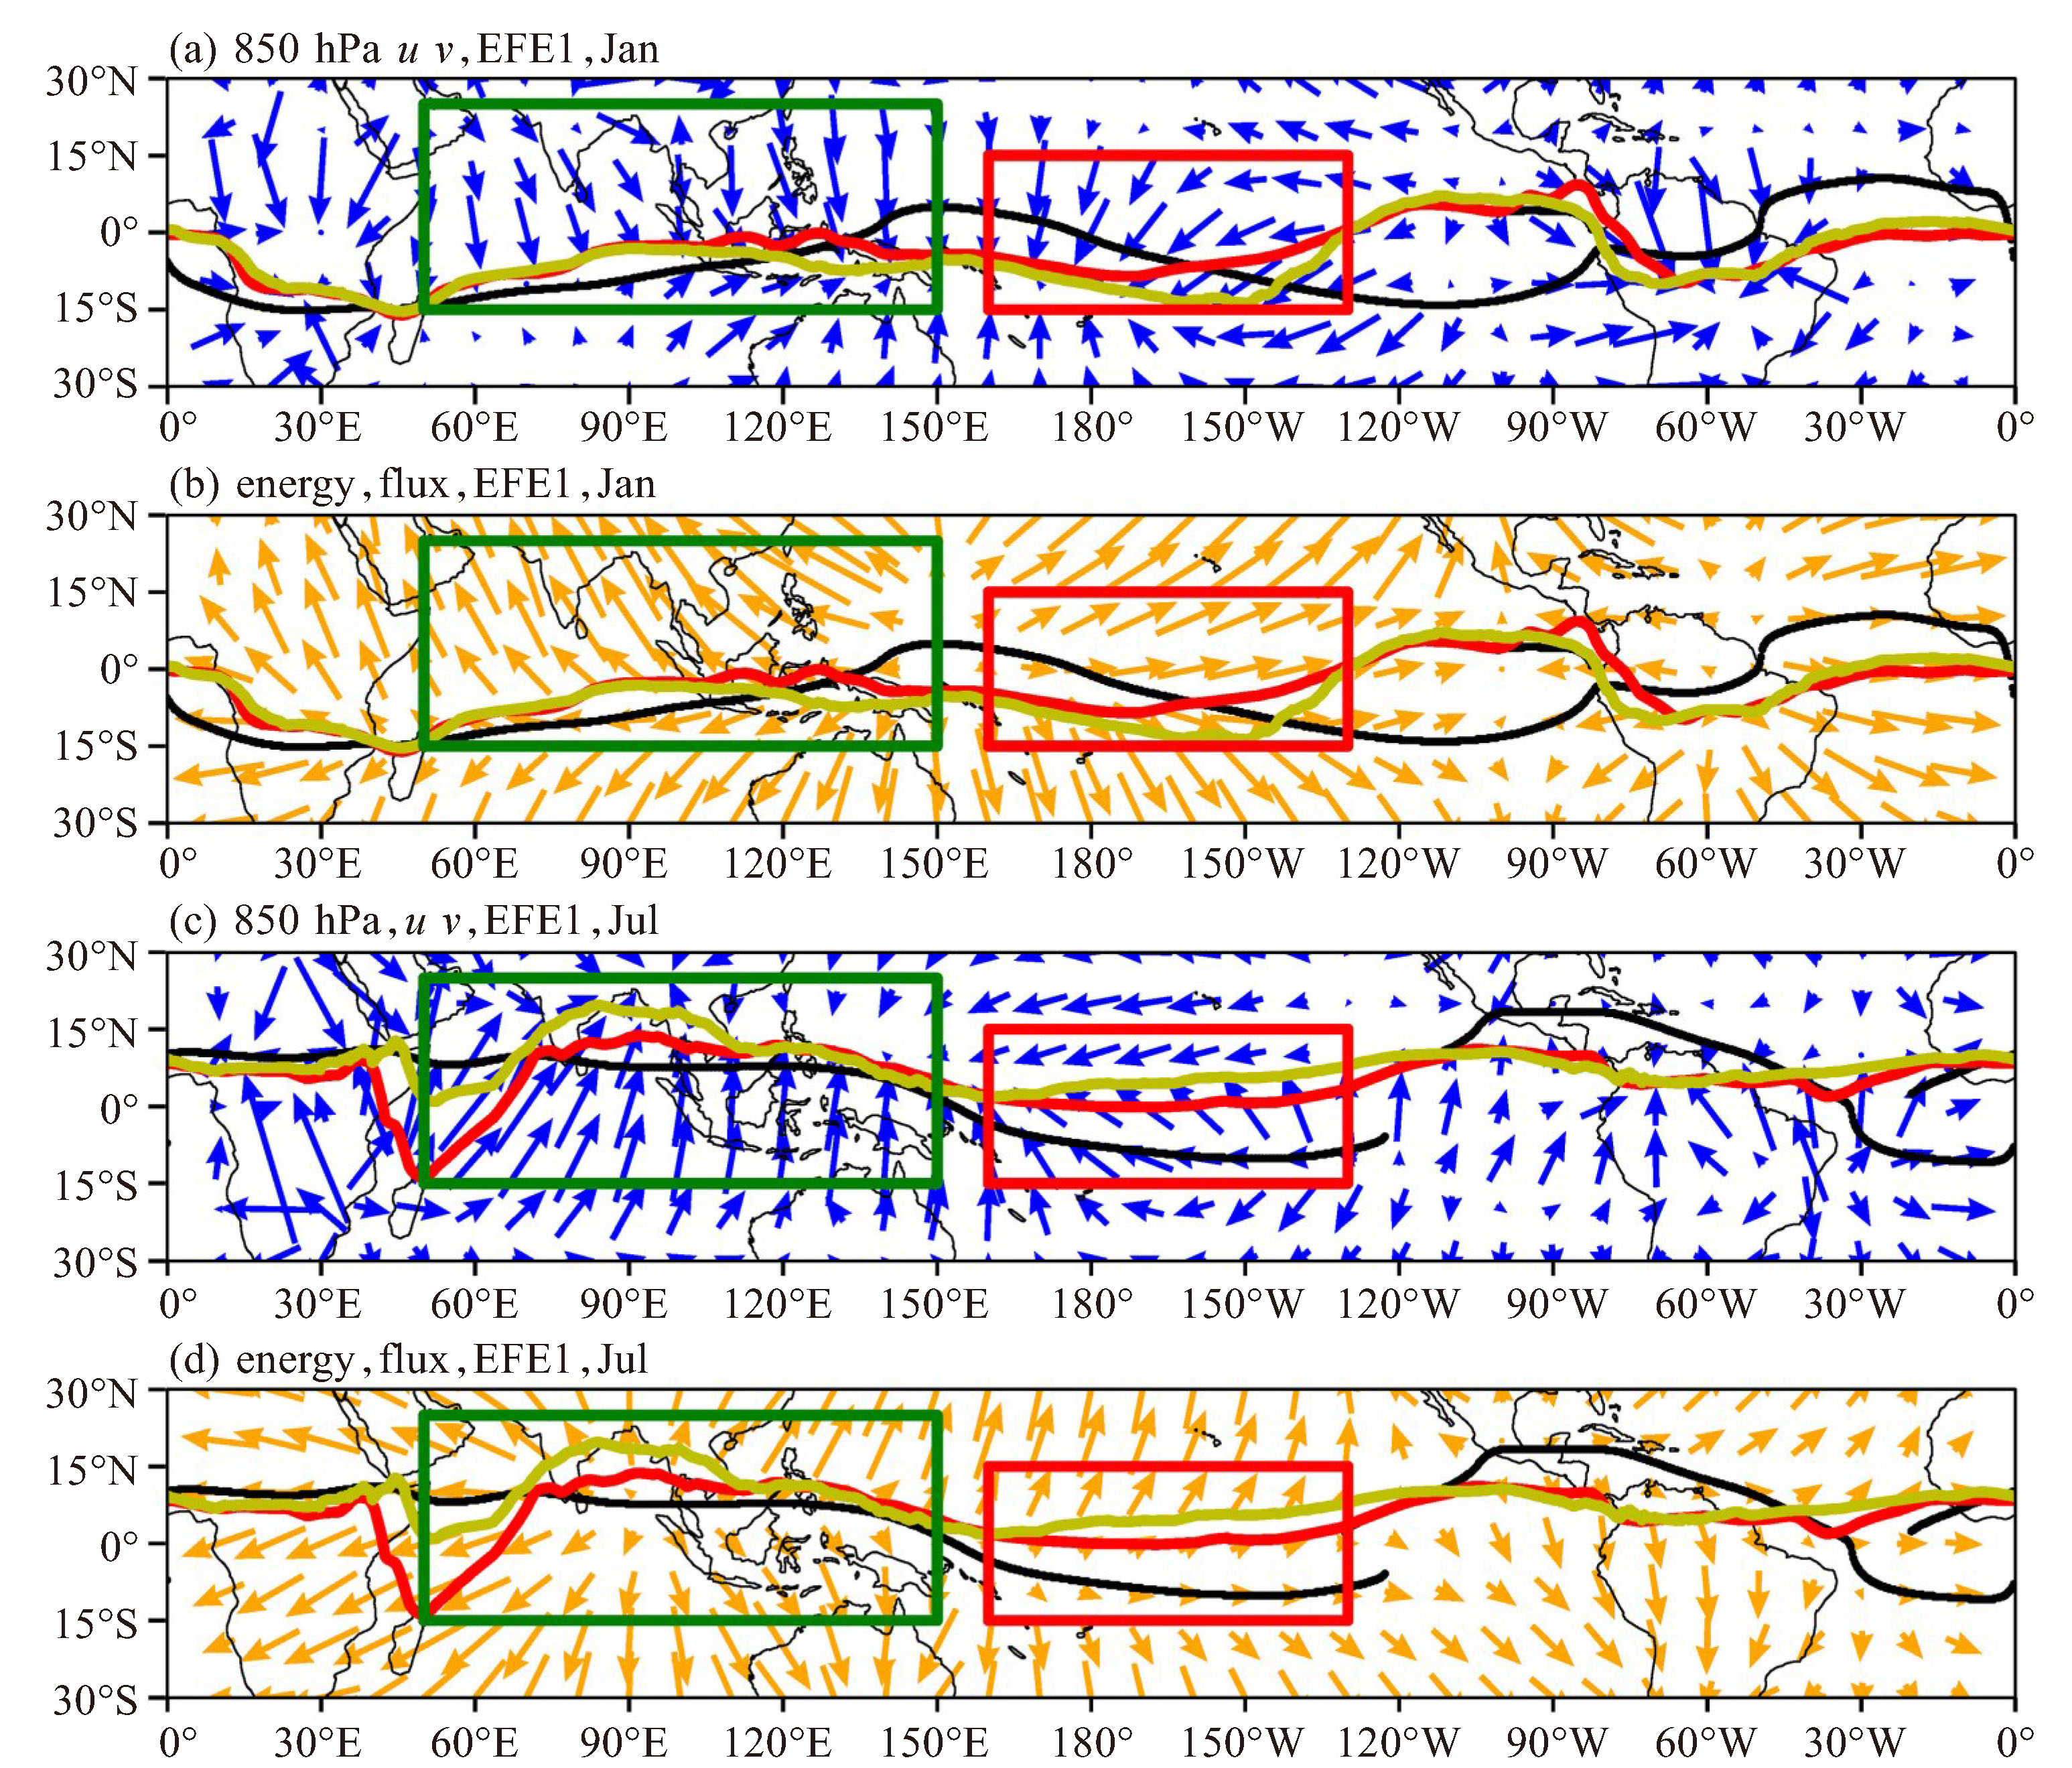
图 11 1979—2021年气候态月平均850 hPa辐散风场和垂直积分的能量通量辐散分量场与ITCZ和EFE1分别在1月(a、b)和7月(c、d)的匹配情况
蓝色箭头表示850 hPa风场,橙色箭头表示垂直积分的能量通量场,黑色线表示EFE1,红、黄线分别表示ITCZ-cen1、ITCZ-cdf,绿色和红色方框分别标出了ITCZ与EFE匹配关系最好和最差的大致范围。
表 1 EFE位置算法
算法 使用数据 判定方法 EFE1 能量通量垂直积分的辐散分量Fχ Fy递增零点 EFE2 能量通量垂直积分的辐散分量Fχ $\partial$Fy/$\partial$y正极大值点 EFE3 能量通量垂直积分F $\partial$Fy/$\partial$y正极大值点 EFE4 能量通量垂直积分F Fy递增零点  下载: 导出CSV
-
[1] SCHNEIDER T, BISCHOFF T, HAUG G H. Migrations and dynamics of the intertopical convergence zone[J]. Nature, 2014, 513(7 516): 45-53. [2] GADGIL S. The Indian monsoon and its variability[J]. Annu Rev Earth Planet Sci, 2003, 31(1): 429-467. [3] ADAM O, BISCHOFF T, SCHNEIDER T. Seasonal and interannual variations of the energy flux equator and ITCZ. Part I: Zonally averaged ITCZ position[J]. J Climate, 2016, 29(9): 3 219-3 230. [4] DIAZ H F, BRADLEY R S. The Hadley Circulation: Present, Past, and Future[M]. Advances in Global Change Research, Kluwer Academic, 2004: 347-369. [5] GRAHAM N E, BARNETT T P. Sea surface temperature, surface wind divergence, and convection over tropical oceans[J]. Science, 1987, 238(4 827): 657-659. [6] PHILANDER S, GU D, HALPERN D, et al. Why the ITCZ is mostly north of the equator[J]. J Climate, 1996, 9(12): 2 958-2 972. [7] CHAO W C, CHEN B. The origin of monsoons[J]. J Atmos Sci, 2001, 58(22): 3 497-3 507. [8] TRENBERTH K E. Changes in precipitation with climate change[J]. Clim Res, 2011, 47(1-2): 123-138. [9] TRENBERTH K E, STEPANIAK D P, CARON J M. The global monsoon as seen through the divergent atmospheric circulation[J]. J Climate, 2000, 13(22): 3 969-3 993. [10] CHOU C, NEELIN J D. Mechanisms limiting the northward extent of the northern summer monsoons over North America, Asia, and Africa[J]. J Climate, 2003, 16(3): 406-425. [11] BORDONI S, SCHNEIDER T. Monsoons as eddy-mediated regime transitions of the tropical overturning circulation[J]. Nat Geosci, 2008, 1 (8): 515-519. [12] XIAN P, MILLER R L. Abrupt seasonal migration of the ITCZ into the summer hemisphere[J]. J Atmos Sci, 2008, 65(6): 1 878-1 895. [13] CHIANG J C H, FRIEDMAN A R. Extratropical cooling, interhemispheric thermal gradients, and tropical climate change[J]. Annu Rev Earth Planet Sci, 2012, 40(1): 383-412. [14] YANCHEVA G, NOWACZYK N, MINGRAM J, et al. Influence of the intertropical convergence zone on the East Asian monsoon[J]. Nature, 2007, 445(4): 74-77. [15] FOLLAND C K, PALMER T N, PARKER D E. Sahel rainfall and worldwide sea temperatures, 1901-85[J]. Nature, 1986, 320(6 063): 602- 607. [16] GIANNINI A, SARAVANAN R, CHANG P. Oceanic forcing of Sahel rainfall on interannual to interdecadal time scales[J]. Science, 2003, 302(5 647): 1 027-1 030. [17] HELD I M, DELWORTH T L, LU J, et al. Simulation of Sahel drought in the 20th and 21st centuries[J]. Proceedings of the National Academy of Sciences, 2005, 102(50): 17 891-17 896. [18] BROECKER W S, PUTNAM A E. Hydrologic impacts of past shifts of Earth's thermal equator offer insight into those to be produced by fossil fuel CO2[J]. Proc Nat Acad Sci, 2013, 110(42): 16 710-16 715. [19] BASCONCILLO J, MOON I J, WANG B, et al. Possible influence of the warm pool ITCZ on compound climate extremes during the boreal summer[J]. Environ Res Lett, 2021, 16(11): 114039. [20] WALISER D E, GAUTIER C. A satellite-derived climatology of the ITCZ[J]. J Climate, 1993, 6(11): 2 162-2 174. [21] MAMALAKIS A, FOUFOULA-GEORGIOU E. A multivariate probabilistic framework for tracking the intertropical convergence zone: Analysis of recent climatology and past trends[J]. Geophys Res Lett, 2018, 45(23): 13 080-13 089. [22] NEELIN J D, HELD I M. Modeling tropical convergence based on the moist static energy budget[J]. Mon Wear Rev, 1987, 115(1): 3-12. [23] BROCCOLI A J, DAHL K A, STOUFFER R J. Response of the ITCZ to northern hemisphere cooling[J]. Geophys Res Lett, 2006, 33(1): L01702. [24] KANG S M, HELD I M, FRIERSON D M W, et al. The response of the ITCZ to extratropical thermal forcing: idealized slab-ocean experiments with a GCM[J]. J Climate, 2008, 21(14): 3 521-3 532. [25] MARSHALL J, DONOHOE A, FERREIRA D, et al. The ocean' s role in setting the mean position of the Inter-Tropical Convergence Zone[J]. Clim Dyn, 2014, 42(7-8): 1 967-1 979. [26] FRIERSON D M W, HWANG Y T, FUÇKAR N S, et al. Contribution of ocean overturning circulation to tropical rainfall peak in the northern hemisphere[J]. Nat Geosci, 2013, 6(11): 940-944. [27] KANG S M, SEAGER R, FRIERSON D M W, et al. Croll revisited: Why is the northern hemisphere warmer than the southern hemisphere?[J]. Clim Dyn, 2015, 44(5-6): 1 457-1 472. [28] ZHAO S, SUZUKI K. Differing impacts of black carbon and sulfate aerosols on global precipitation and the ITCZ location via atmosphere and ocean energy perturbations[J]. J Climate, 2019, 32(17): 5 567-5 582. [29] ZHAO S, SUZUKI K. Exploring the impacts of aerosols on ITCZ position through altering different autoconversion schemes and cumulus parameterizations[J]. J Geophys Res: Atmos, 2021, 126(14): e2021JD034803. [30] ADAM O, BISCHOFF T, SCHNEIDER T. Seasonal and interannual variations of the energy flux equator and ITCZ. Part Ⅱ: zonally varying shifts of the ITCZ[J]. J Climate, 2016, 29(20): 7 281-7 293. [31] MAYER J, MAYER M, HAIMBERGER L. Consistency and homogeneity of atmospheric energy, moisture, and mass budgets in ERA5[J]. J Climate, 2021, 34(10): 3 955-3 974. [32] MAMALAKIS A, RANDERSON J, YU J, et al. Zonally contrasting shifts of the tropical rain belt in response to climate change[J]. Nat Clim Change, 2021, 11(2): 143-151. [33] BERRY G, REEDER M J. Objective identification of the intertropical convergence zone: Climatology and trends from the ERA-interim[J]. J Climate, 2014, 27(5): 1 894-1 909. [34] BISCHOFF T, SCHNEIDER T. Energetic constraints on the position of the Intertropical Convergence Zone[J]. J Climate, 2014, 27(13): 4 937-4 951. [35] CHARNEY J G. A note on large-scale motions in the tropics[J]. J Atmos Sci, 1963, 20(6): 607-609. [36] FASULLO J T, TRENBERTH K E. The annual cycle of the energy budget. Part Ⅱ: Meridional structures and poleward transports[J]. J Climate, 2008, 21(10): 2 313-2 325. [37] HAFFKE C, MAGNUSDOTTIR G. The South Pacific convergence zone in three decades of satellite images[J]. J Geophy Res: Atmos, 2013, 118(19): 10 839-10 849. [38] HAFFKE C, MAGNUSDOTTIR G. Diurnal cycle of the South Pacific convergence zone in 30 years of satellite images[J]. J Geophys Res: Atmos, 2015, 120(18): 9 059-9 070. [39] KANG S M, FRIERSON D M W, HELD I M. The tropical response to extratropical thermal forcing in an idealized GCM: The importance of radiative feedbacks and convective parameterization[J]. J Atmos Sci, 2009, 66(9): 2 812-2 827. [40] LOEB N G, WIELICKI B A, DOELLING D R, et al. Toward optimal closure of the Earth' s top-of-atmosphere radiation budget[J]. J Climate, 2009, 22(3): 748-766. [41] WIDLANSKY M J, WEBSTER P J, HOYAS C D. On the location and orientation of the South Pacific Convergence Zone[J]. Clim Dyn, 2011, 36(3-4): 561-578. -

 点击查看大图
计量
- 文章访问数: 3
- HTML全文浏览量: 4
- PDF下载量: 0
- 被引次数: 0
 粤公网安备 4401069904700003号