


Climate Characteristics and Influencing Factors Analysis of the Highest Summer Temperature in Guizhou Province
-
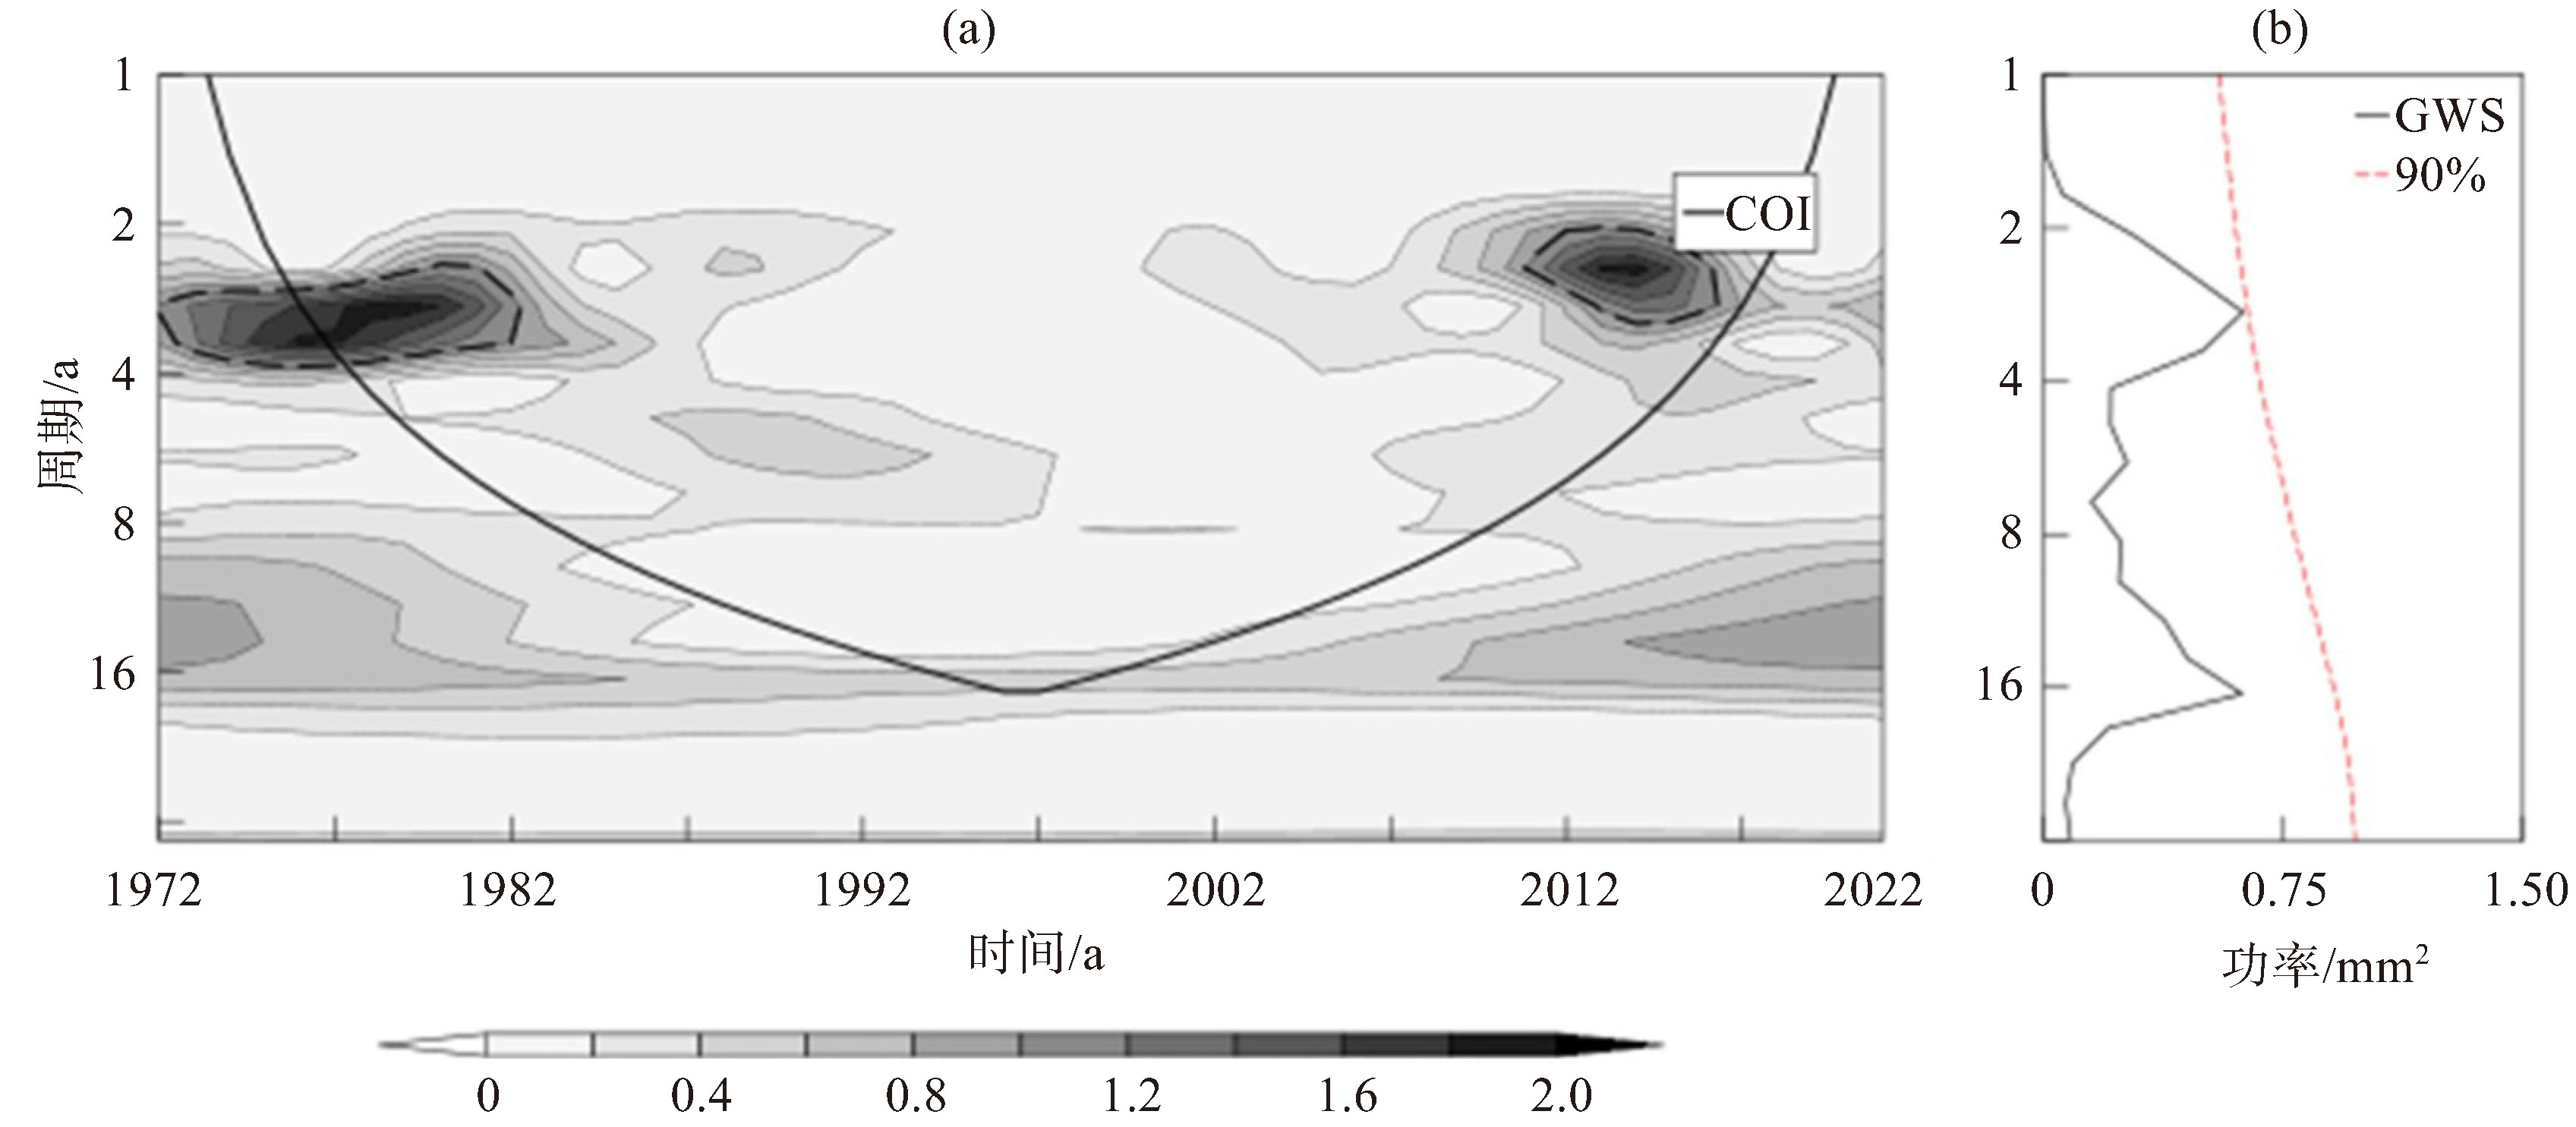
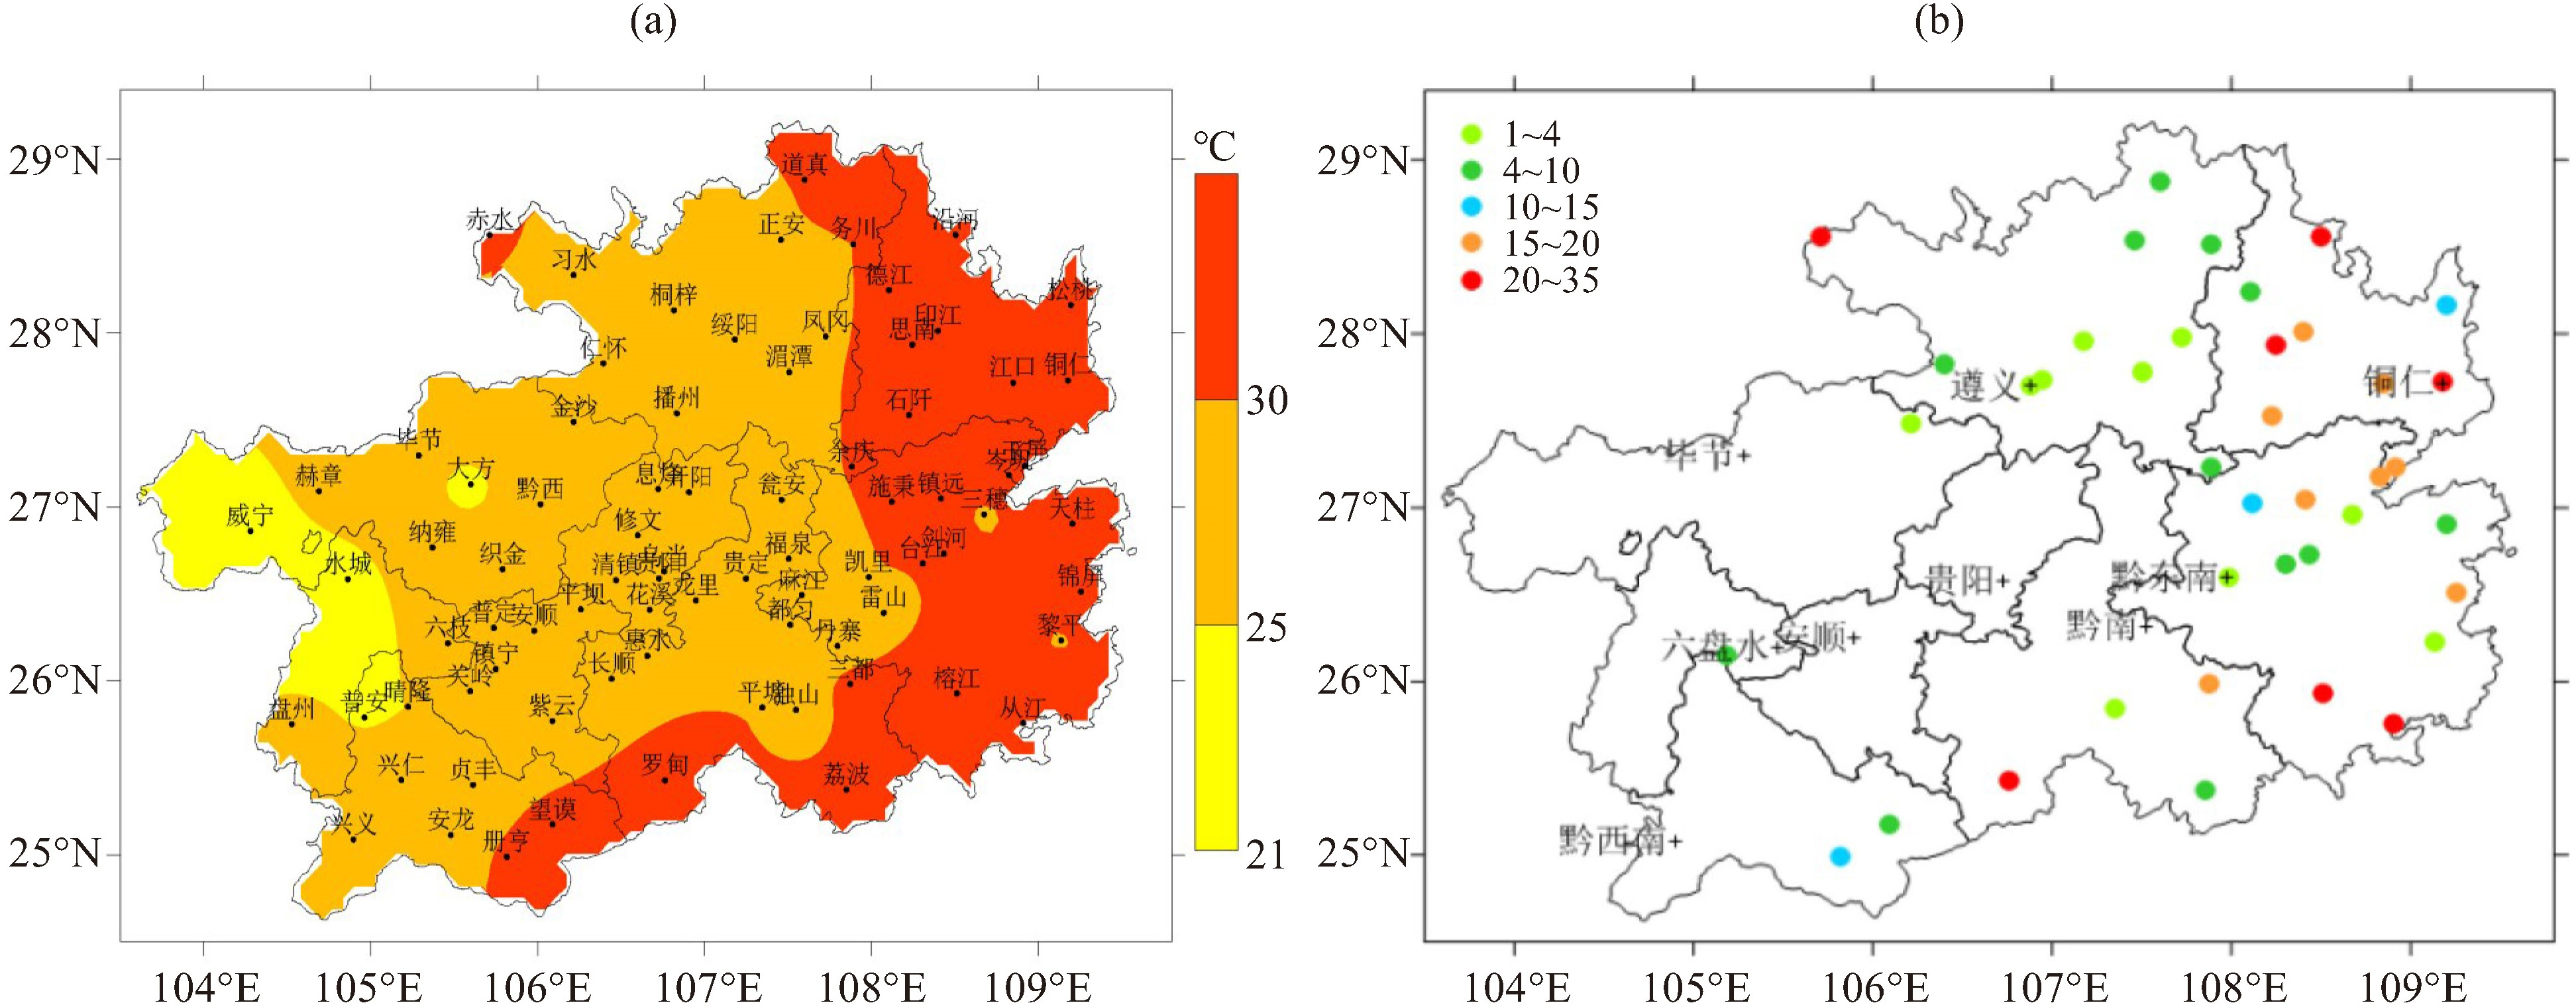
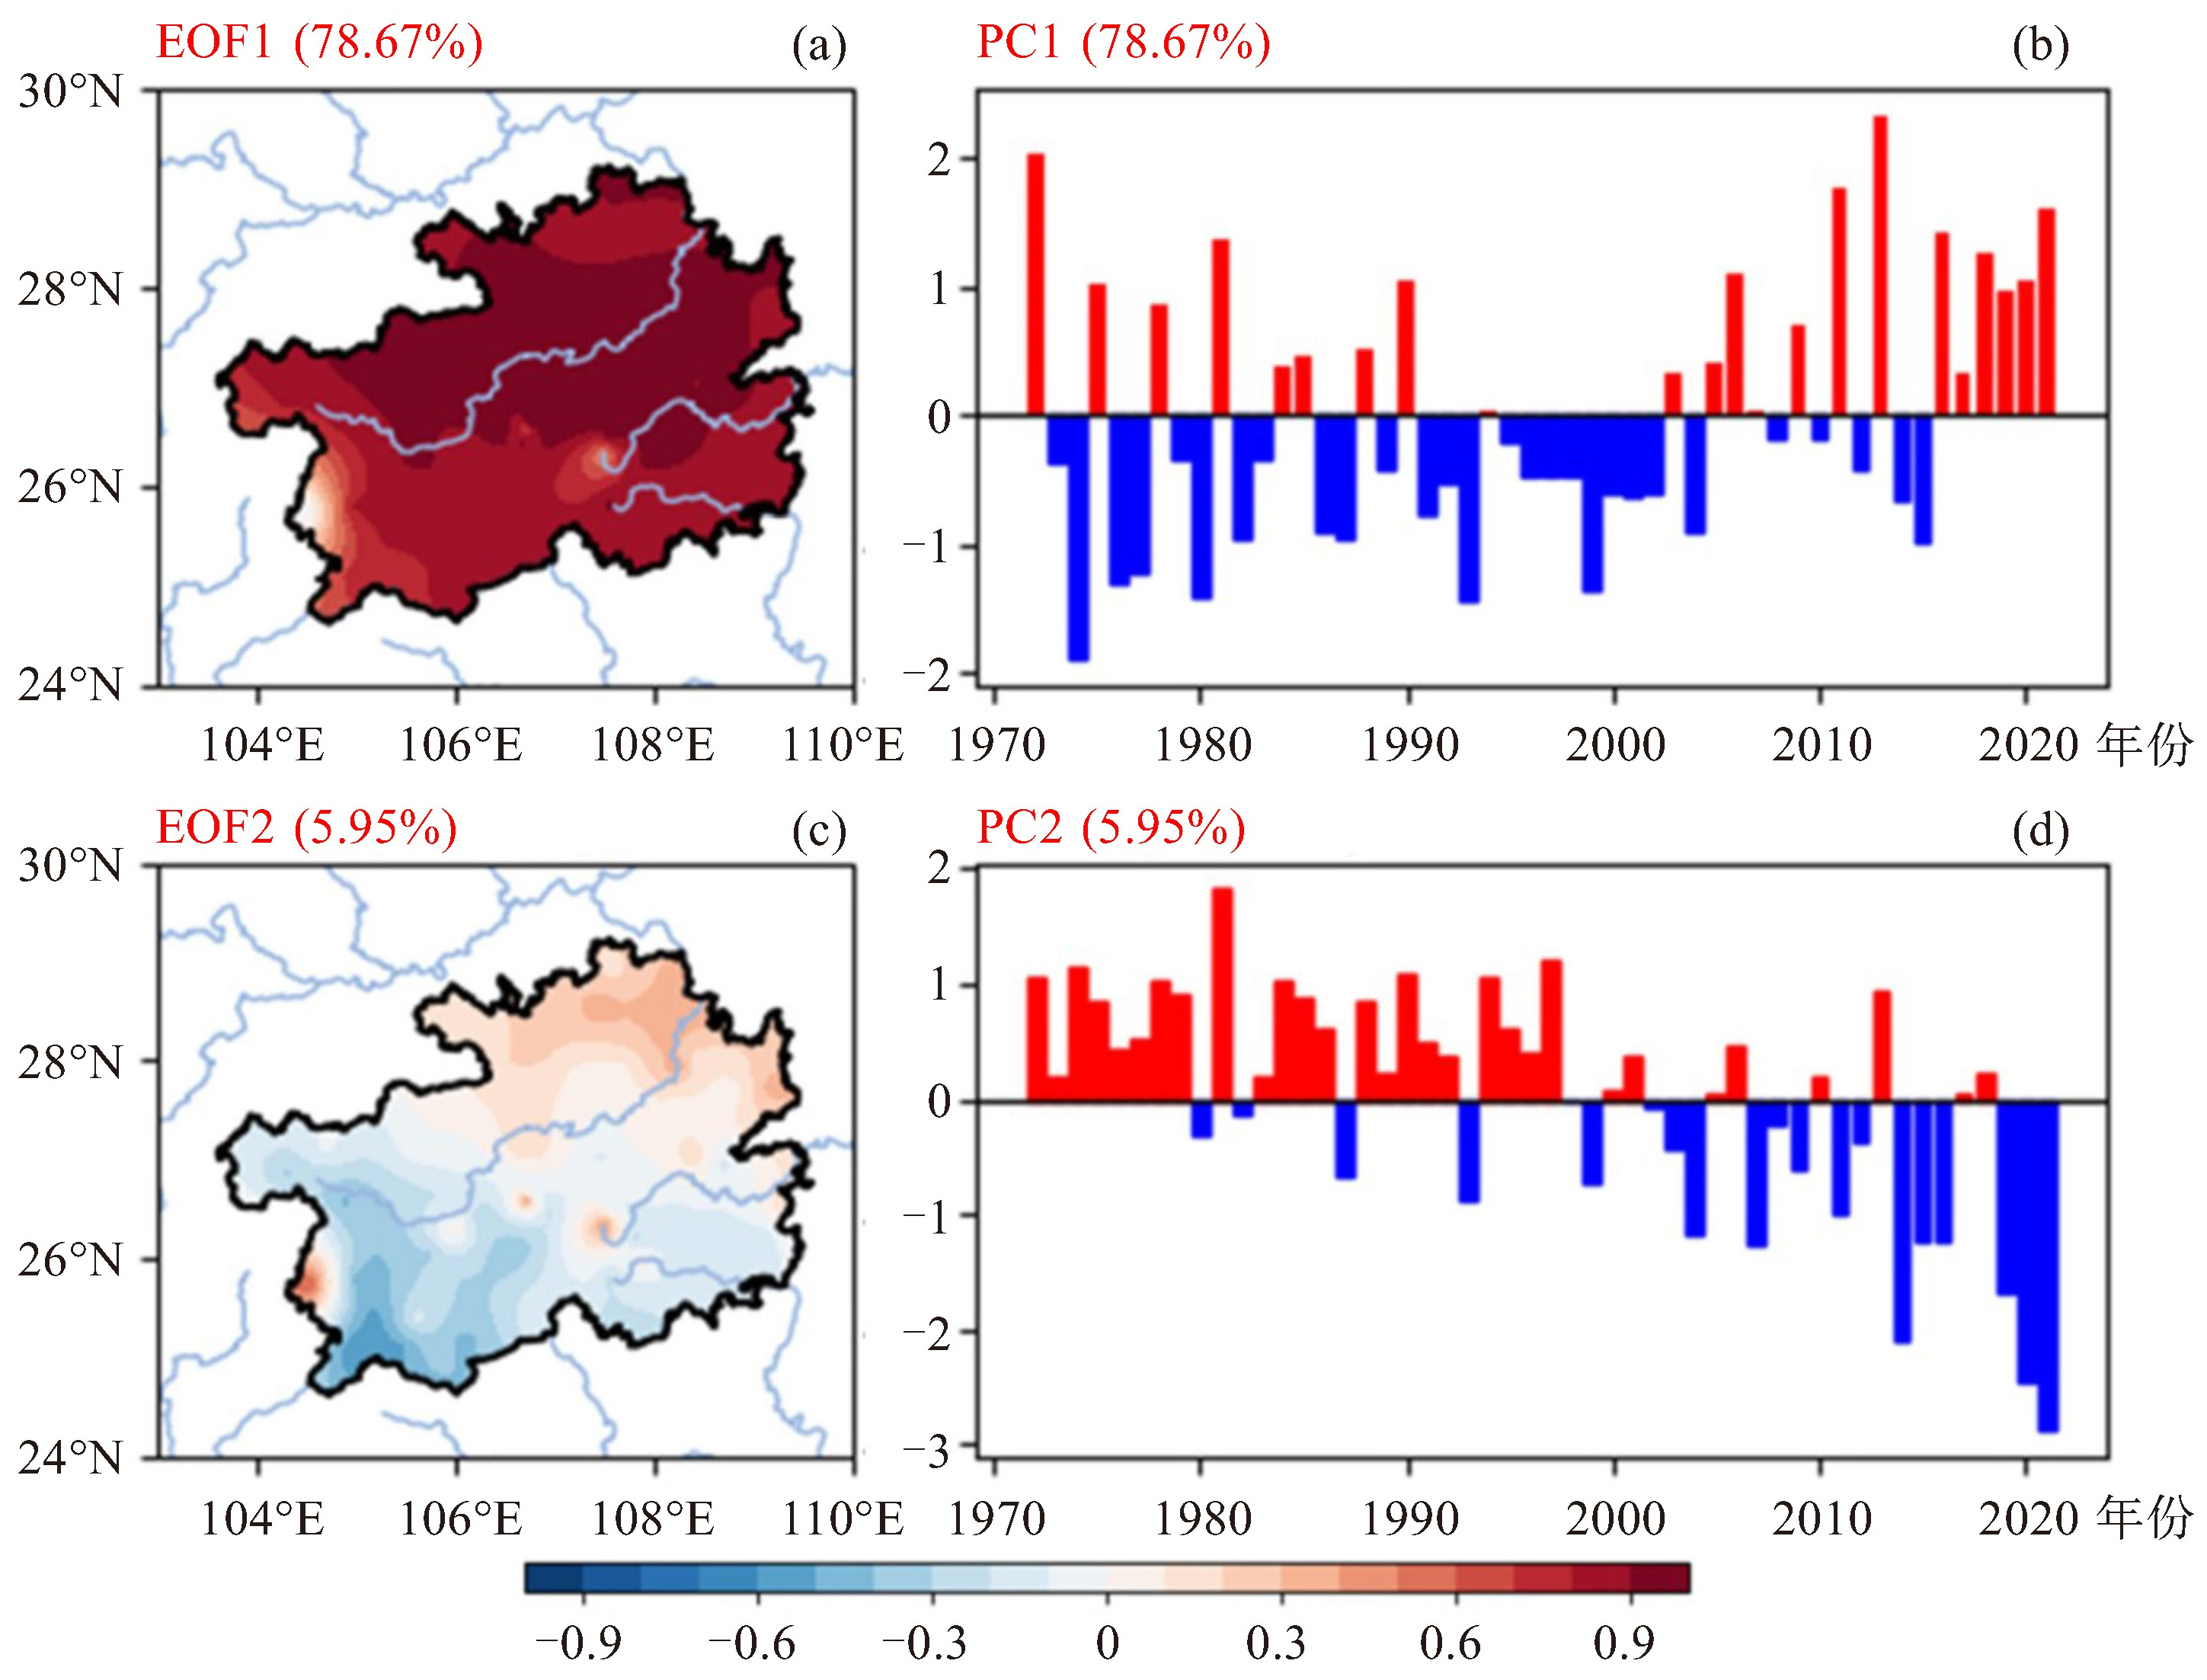
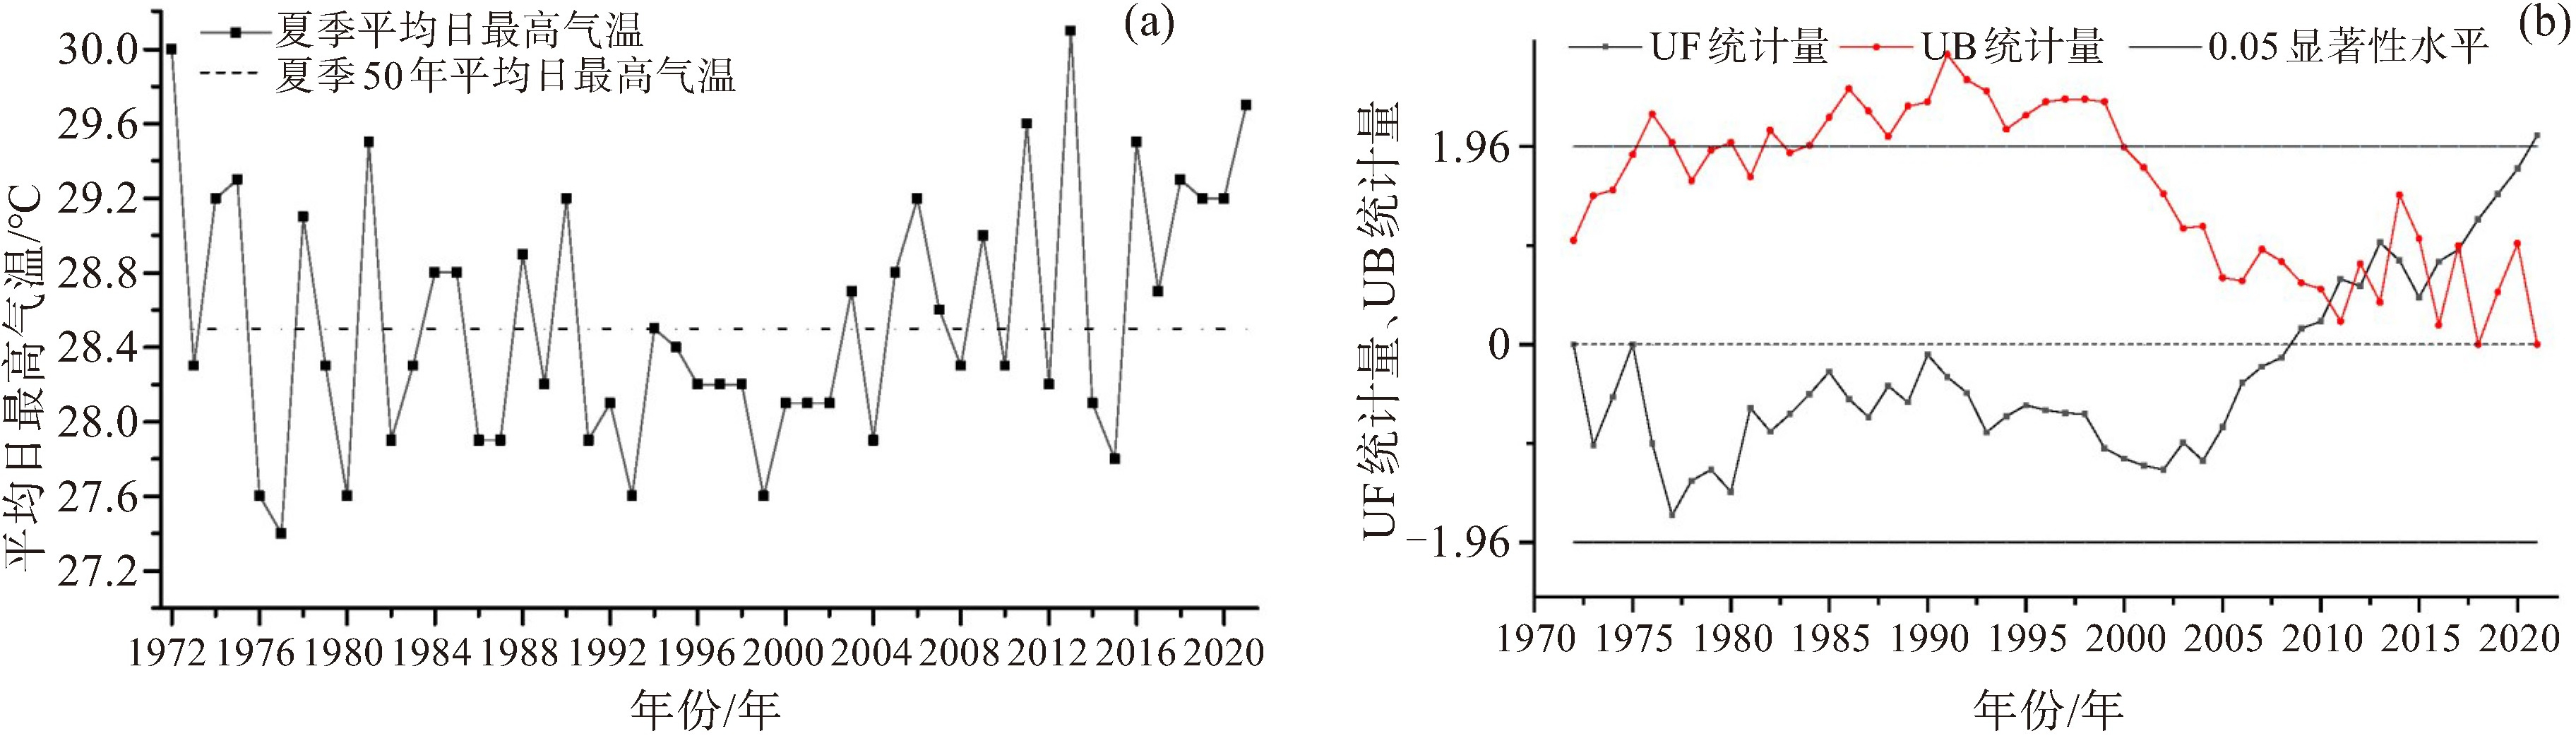
摘要: 为了分析贵州省夏季最高气温的气候特征及其影响因子,利用贵州省84个国家气象站1972—2021年6—8月的日最高气温资料、国家气候中心提供的副高指数和7项大气环流指数资料及NCEP/NCAR第二套再分析资料,采用统计分析、经验正交函数(EOF)展开、Mann-Kendall非参数统计检验、Morlet小波分析及合成分析等方法进行分析。结果表明:贵州省夏季平均最高气温存在准2~4 a、准8 a及准16 a的多时间尺度振荡周期,有8 a异常偏高,6 a异常偏低;夏季最高气温的空间分布特征为东高西低、南高北低,其EOF的展开模态主要空间分布型为全省一致变化型,解释方差为78.67%,其次是南北反向型,解释方差为5.95%;夏季最高气温的第一模态型与副高的脊线位置和西藏高原-1指数呈显著正相关,与亚洲纬向环流指数和东亚槽位置指数呈显著负相关,第二模态型与副高的面积指数和强度指数呈显著负相关,与西藏高原-1指数、西藏高原-2指数及印缅槽强度指数呈显著正相关;夏季最高气温异常偏高年500 hPa位势高度距平场上亚洲中高纬地区主要表现为“+、-、+”的南北结构特征,中国中高纬的大部分地区为正距平,30 °N以南的地区为负距平,异常偏低年500 hPa位势高度距平场上亚洲中高纬地区主要表现为“-、+、-”的南北结构特征,除华南地区外,中国大部分地区为负距平。
-
关键词:
- 最高气温 /
- 西太平洋副高 /
- 副高指数 /
- Mann-Kendall非参数统计检验 /
- Morlet小波分析
Abstract: To explore the climatic characteristics and influencing factors of summer maximum temperatures in Guizhou Province, this study analyzed daily maximum temperature data from 84 national meteorological stations in Guizhou Province from June to August during 1972-2021, along with the subtropical high index, seven atmospheric circulation indices from the National Climate Center, and the NCEP / NCAR second reanalysis data. Methods such as empirical orthogonal function (EOF) expansion, Mann-Kendall non-parametric statistical test, Morlet wavelet analysis, and synthetic analysis were applied. The results show that there are multiple time-scale oscillations of mean maximum summer temperature in Guizhou Province, including quasi 2-4-year, quasi 8-year, and quasi 16-year cycles. An 8-year cycle is associated with anomalously high temperatures, while a 6-year cycle corresponds to anomalously low temperatures. Spatially, the maximum summer temperature is characterized by higher values in the eastern and southern regions, and lower values in the west. The leading EOF mode of summer maximum temperature shows a spatially consistent pattern across the province, counting for 78.67% of the variance, followed by a north-south dipole pattern, explaining 5.95% of the variance. The first mode of summer maximum temperature is significantly positively correlated with the ridge position of the subtropical high and the Tibetan Plateau index-1, and significantly negatively correlated with the Asian zonal circulation index and the East Asia Trough position index. The second mode is significantly negatively correlated with the area and intensity indices of the subtropical high, and significantly positively correlated with the Tibetan Plateau index-1, Tibetan Plateau index-2, and the India-Myanmar trough intensity index. When the summer maximum temperature is abnormally high, the 500 hPa geopotential height anomaly field over mid to high latitudes in Asia mainly exhibits a "positive-negative-positive" meridional structure. At this time, most areas in mid to high latitudes of China experence positive heght anomalies, while areas south of 30 ° N are negative anomalies. When abnormally low temperature years, the anomaly field displays a "negative-positive-negative" pattern, with negative anomalies across most areas of China ecept South China. -

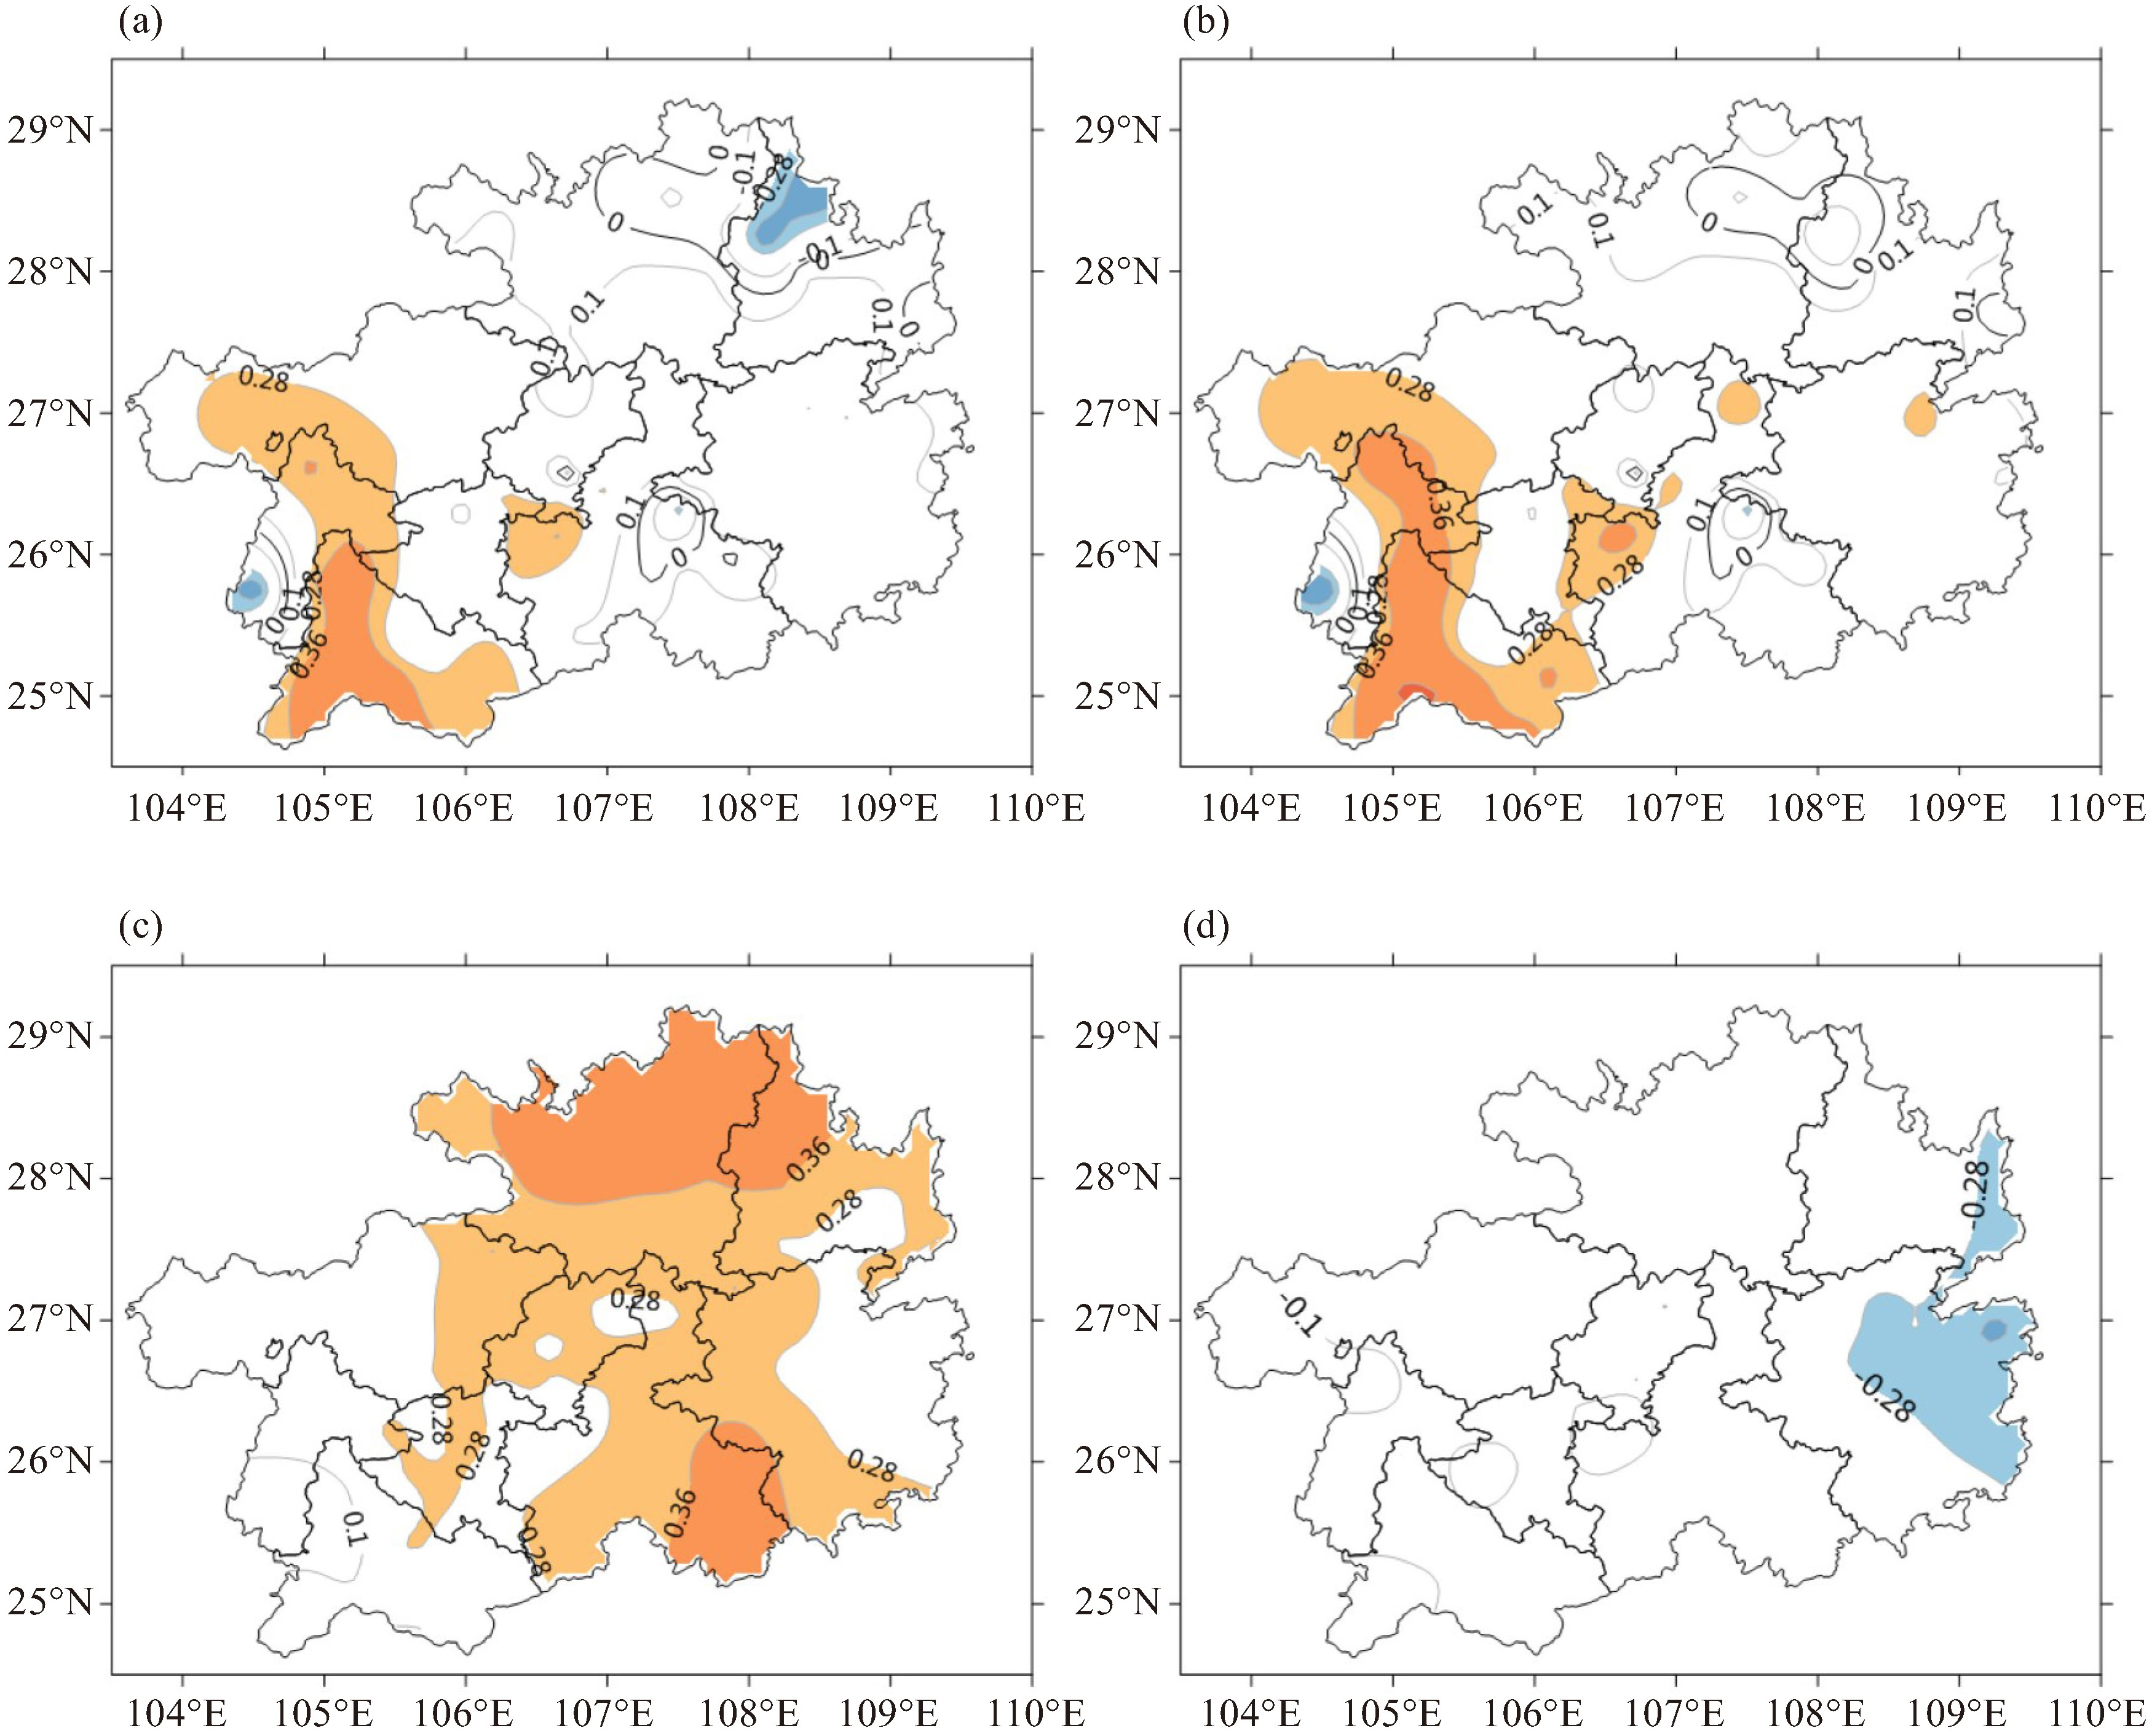
图 5 副高面积指数(a)、强度指数(b)、脊线位置(c)、西伸脊点(d)与贵州省夏季最高气温的相关系数空间分布
±0.28等值线填色区为通过0.05显著性水平检验的区域;±0.36等值线填色区为通过0.01显著性水平检验的区域。

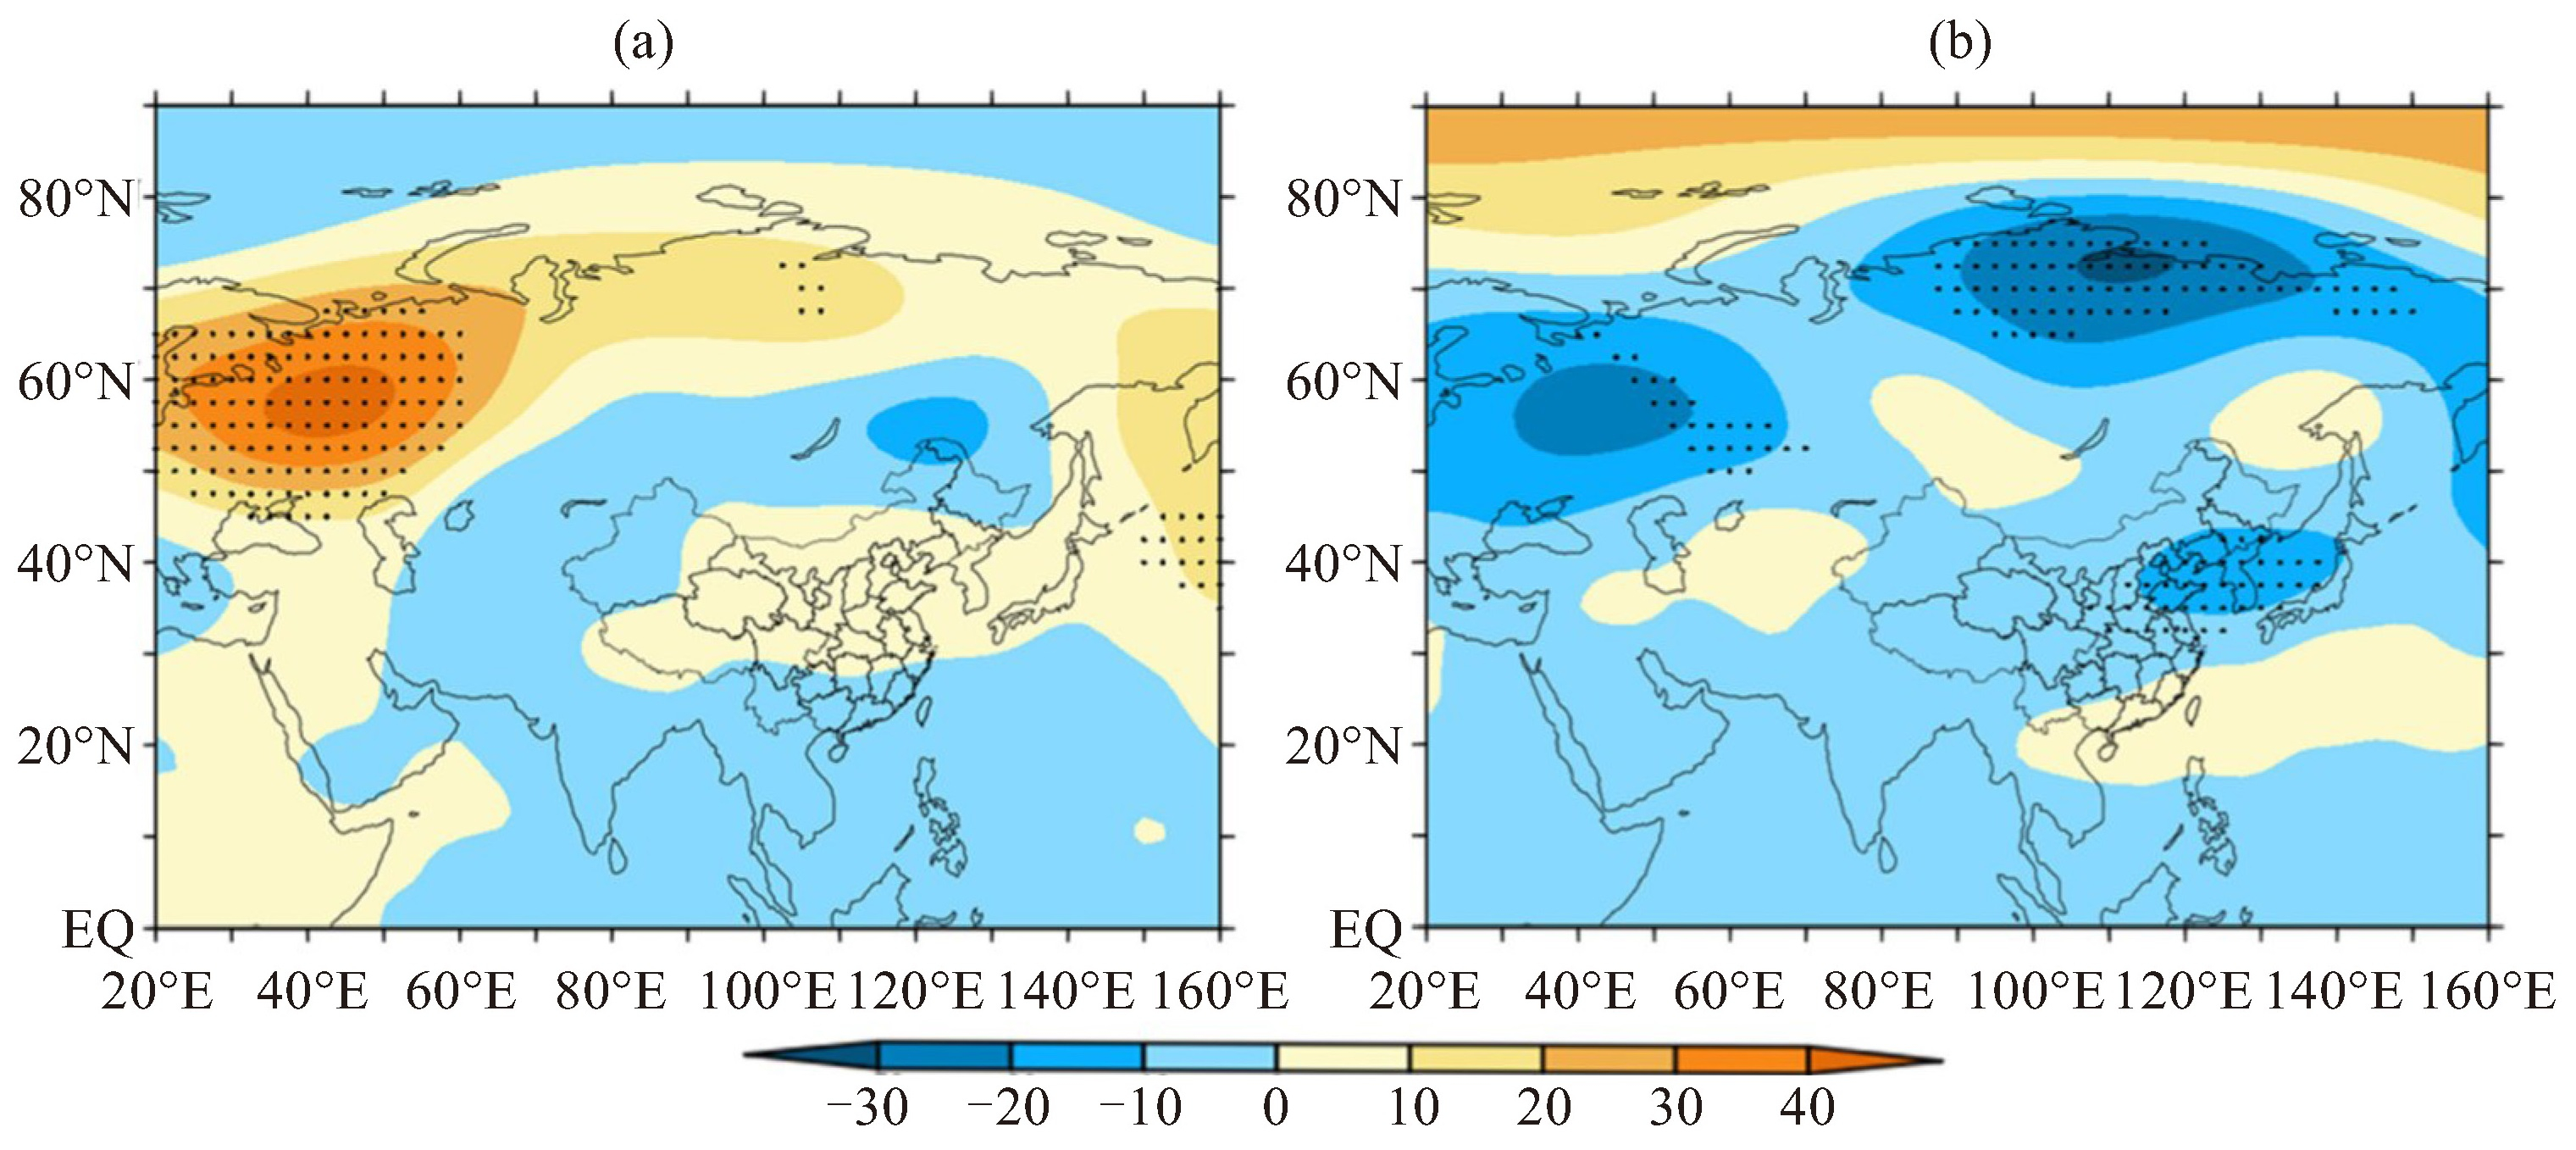
图 6 贵州省夏季最高气温异常年份500 hPa位势高度距平合成图(单位:gpm)
a.异常偏高年;b.异常偏低年。单位:gpm,填色区为距平场,黑点区域通过0.1的显著性检验。
表 1 贵州省夏季最高气温EOF展开模态时间序列(PC1、PC2)与副高各指数的相关系数
相关因子 面积指数 强度指数 脊线位置 西伸脊点 与PC1相关系数 0.162 0.198 0.334* -0.224 与PC2相关系数 0.567** 0.589** 0.218 0.143相关因子 注:**表示通过0.01的显著性检验,*表示通过0.05的显著性检验。  下载: 导出CSV
表 2 贵州省夏季最高气温EOF展开模态时间序列(PC1、PC2)与各环流指数的相关系数
相关因子 亚洲纬向环流指数 亚洲经向环流指数 东亚槽位置指数 东亚槽强度指数 西藏高原-1指数 西藏高原-2指数 印缅槽强度指数 与PC1相关系数 -0.318* -0.153 -0.359* 0.268 0.283* 0.278 0.043 与PC2相关系数 0.91 0.108 0.003 0.234 0.428** 0.328** 0.551** 注:**表示通过0.01的显著性检验,*表示通过0.05的显著性检验
下载: 导出CSV
表 3 1972—2021年贵州省夏季平均最高气温异常年份
气温异常年 年份 异常偏高 1972 1975 1981 2011 2013 2016 2018 2021 异常偏低 1976 1977 1980 1993 1999 2015
下载: 导出CSV
-
[1] 周建丁, 马玉霞, 杨丝絮, 等. 最高气温对呼吸系统疾病急诊人次的影响研究[J]. 中国环境科学, 2019, 39(1): 372-378. [2] 张波, 张绿萍, 陈芳, 等. 气象因子对火龙果品质影响分析及预测模型研究[J]. 热带农业科学, 2022, 42(9): 124-132. [3] 吴姗, 姚浪, 赵春霞, 等. 毕节市近46a气温变化特征及对旅游发展的影响[J]. 内蒙古气象, 2018(6): 10-13. [4] 袁成鑫, 李永花, 赵小艳, 等. 基于综合旅游气候指数的青海省东北部旅游气候舒适度评价[J]. 气象与环境科学, 2022, 45(6): 67-75. [5] IPCC. Climate change 2013: The physical science basis: Working Group Ⅰ contribution to the Fifth assessment report of the Intergovernmental Panel on Climate Change[M]. Cambridge: Cambridge University Press, 2014. [6] 叶殿秀, 尹继福, 陈正洪, 等. 1961—2010年我国夏季高温热浪的时空变化特征[J]. 气候变化研究进展, 2013, 9(1): 15-20. [7] 王荣, 王遵娅, 高荣, 等. 1961—2020年中国区域性高温过程的气候特征及变化趋势[J]. 地球物理学报, 2023, 66(2): 495-504. [8] 熊亚军, 于平, 扈海波. 国内高温气候变化事实及其灾害特征研究进展[J]. 干旱气象, 2013, 31(1): 194-198, 211. [9] 林玉成, 徐珺, 张芳华. 2013年7月大气环流和天气分析[J]. 气象, 2013, 39(10): 1 379-1 384. [10] 孙昭萱, 张强, 孙蕊, 等. 2022年西南地区极端高温干旱特征及其主要影响[J]. 干旱气象, 2022, 40(5): 764-770. [11] 孙兰东, 岳立, 刘新伟, 等. 甘肃省极端最高气温的气候特征分析[J]. 应用气象学报, 2006, 16(S1): 110-117. [12] 赵琳娜, 卢姝, 齐丹, 等. 基于全连接神经网络方法的日最高气温预报[J]. 应用气象学报, 2022, 33(3): 257-269. [13] 谢文强, 王双双, 延晓冬. CMIP6全球气候模式对中国年平均日最高气温和最低气温模拟的评估[J]. 气候与环境研究, 2022, 27(1): 63- 78. [14] 熊敏诠, 代刊, 唐健. 春季中国日最高气温延伸期预报误差分析及订正[J]. 热带气象学报, 2020, 36(6): 795-804. [15] 李刚, 杨秀庄, 刘彦华, 等. 基于SCMOC的贵州最高气温预报方法研究[J]. 干旱气象, 2020, 38(3): 457-464. [16] 唐恬, 金荣花, 彭相瑜, 等. 2013年夏季中国南方区域性高温天气的成因分析[J]. 成都信息工程学院学报, 2014, 29(6): 652-659. [17] 苏越, 路春燕, 黄雨菲, 等. 1950—2019年中国季节平均最高气温时空演变特征及其大气环流影响定量化分析[J]. 环境科学, 2023, 44 (5): 3 003-3 016. [18] 曾剑, 徐晴晗, 张宇, 等. 中国西南地区百年气温的时空演变特征[J]. 成都信息工程大学学报, 2022, 37(4): 412-421. [19] 刘红双, 幸筱炯, 杨熠, 等. 贵州省2019年8月极端高温成因分析[J]. 中低纬山地气象, 2022, 45(3): 80-86. [20] 汪卫平, 熊伟, 陈余明. 贵州省日最高气温气候特征分析[J]. 贵州气象, 2013, 37(1): 7-10. [21] 胡泽银, 王世杰, 白晓永, 等. 近百年来贵州高原气温时空演变特征及趋势[J]. 中国岩溶, 2020, 39(5): 724-736. [22] 赵志龙, 罗娅, 杨胜天, 等. 基于均一化序列的贵州高原1960-2018年气温时空变化特征分析[J]. 水资源与水工程学报, 2021, 32(2): 81-89. [23] 宋文起, 王志恒. 近30年来中国气温、降水和水分盈亏的趋势及其变化[J]. 气候与环境研究, 2023, 28(1): 1-16. [24] 张灵, 陈丽娟, 周月华, 等. 中国夏季气温变化的主模态及环流特征分析[J]. 气象, 2017, 43(11): 1 393-1 401. [25] 叶秣麟, 秦宁生, 白爱娟, 等. 1618—2009年黄河源区夏季最高气温变化规律分析[J]. 成都信息工程学院学报, 2015, 30(4): 385-389. [26] 李焕, 白松竹, 王干成. 阿勒泰地区1961—2007年夏季平均最高气温及高温日数变化特征[J]. 沙漠与绿洲气象, 2014, 8(3): 56-60. [27] 钱海, 龙安胜, 彭杰. 贵州夏季降水异常及其与海温异常的关系[J]. 海洋气象学报, 2024, 44(3): 133-144. [28] 朱乾根, 林锦瑞, 寿绍文, 等. 天气学原理的方法[M]. 北京: 气象出版社, 2000: 480-484. -

 点击查看大图
图(6) / 表(3)
计量
- 文章访问数: 4
- HTML全文浏览量: 1
- PDF下载量: 0
- 被引次数: 0
 粤公网安备 4401069904700003号