


Water Vapor Transport to Henan's Extreme Rainfall with the Influence of Dual Typhoons: A FLEXPART-Modeling Study
-
摘要: 2021年7月,河南发生了持续时间长、降水强度大且致灾严重的“7.20”极端暴雨事件。为了探明此次暴雨过程的水汽关键来源和主要传输通道,本研究利用多源气象数据结合FLEXPART模式开展了水汽轨迹模拟与聚类分析。结果表明,暴雨过程中主要有两条水汽通道,对极端降水的水汽收支有重要贡献。第一条水汽通道与远距离西北太平洋台风“烟花”相连,在降水最强的7月19—21日期间在1 000~700 hPa持续向河南输送大量水汽,输送的中心在1 000~900 hPa之间;第二条通道则与华南近海台风“查帕卡”相连,7月20日向河南输送水汽,主要输送层次位于950~800 hPa之间。两条通道的高度差异主要由地形驱动作用引起,而台风的存在和移动是造成水汽传输变化的关键因素。河南地区上空持续的水汽聚集直接导致了极端暴雨的形成,而双台风的水汽输送对暴雨过程的持续具有重要作用。
-
关键词:
- 河南暴雨 /
- FLEXPART /
- 整层水汽通量(IVT) /
- 水汽通量密度(VFD) /
- 台风
Abstract: The "7.20" extreme rainfall event in Henan Province was characterized by prolonged duration and intense precipitation, causing disastrous damage. To investigate the key sources and transport pathways of water vapor during this extreme rainfall event, this study utilized multi-source meteorological data and the FLEXPART model to conduct trajectory simulations and analyze the water vapor transport processes. Additionally, cluster analysis was performed on the transport trajectories. The results revealed two primary water vapor pathways that significantly contributed moisture to the extreme precipitation event. The first pathway, originating from the Northwest Pacific typhoon "In-Fa", provided continuous water vapor transport toward Henan between 1 000 hPa and 700 hPa, with the core between 1 000 hPa and 900 hPa during July 19—21. The second pathway, from the South China Sea typhoon"Cempaka", transported water vapor on July 20, primarily between 950 hPa and 800 hPa. Topographic effects resulted in significant height differences between the two water vapor transport channels. The continuous accumulation of water vapor over Henan Province was an important factor in the formation of the extreme precipitation. The persistent transport of large amounts of vapor by the typhoons played a crucial role in sustaining the heavy rainfall, significantly contributing to the extreme precipitation event.-
Key words:
- extreme rainfall in Henan Province /
- FLEXPART /
- IVT /
- VFD /
- typhoon
-

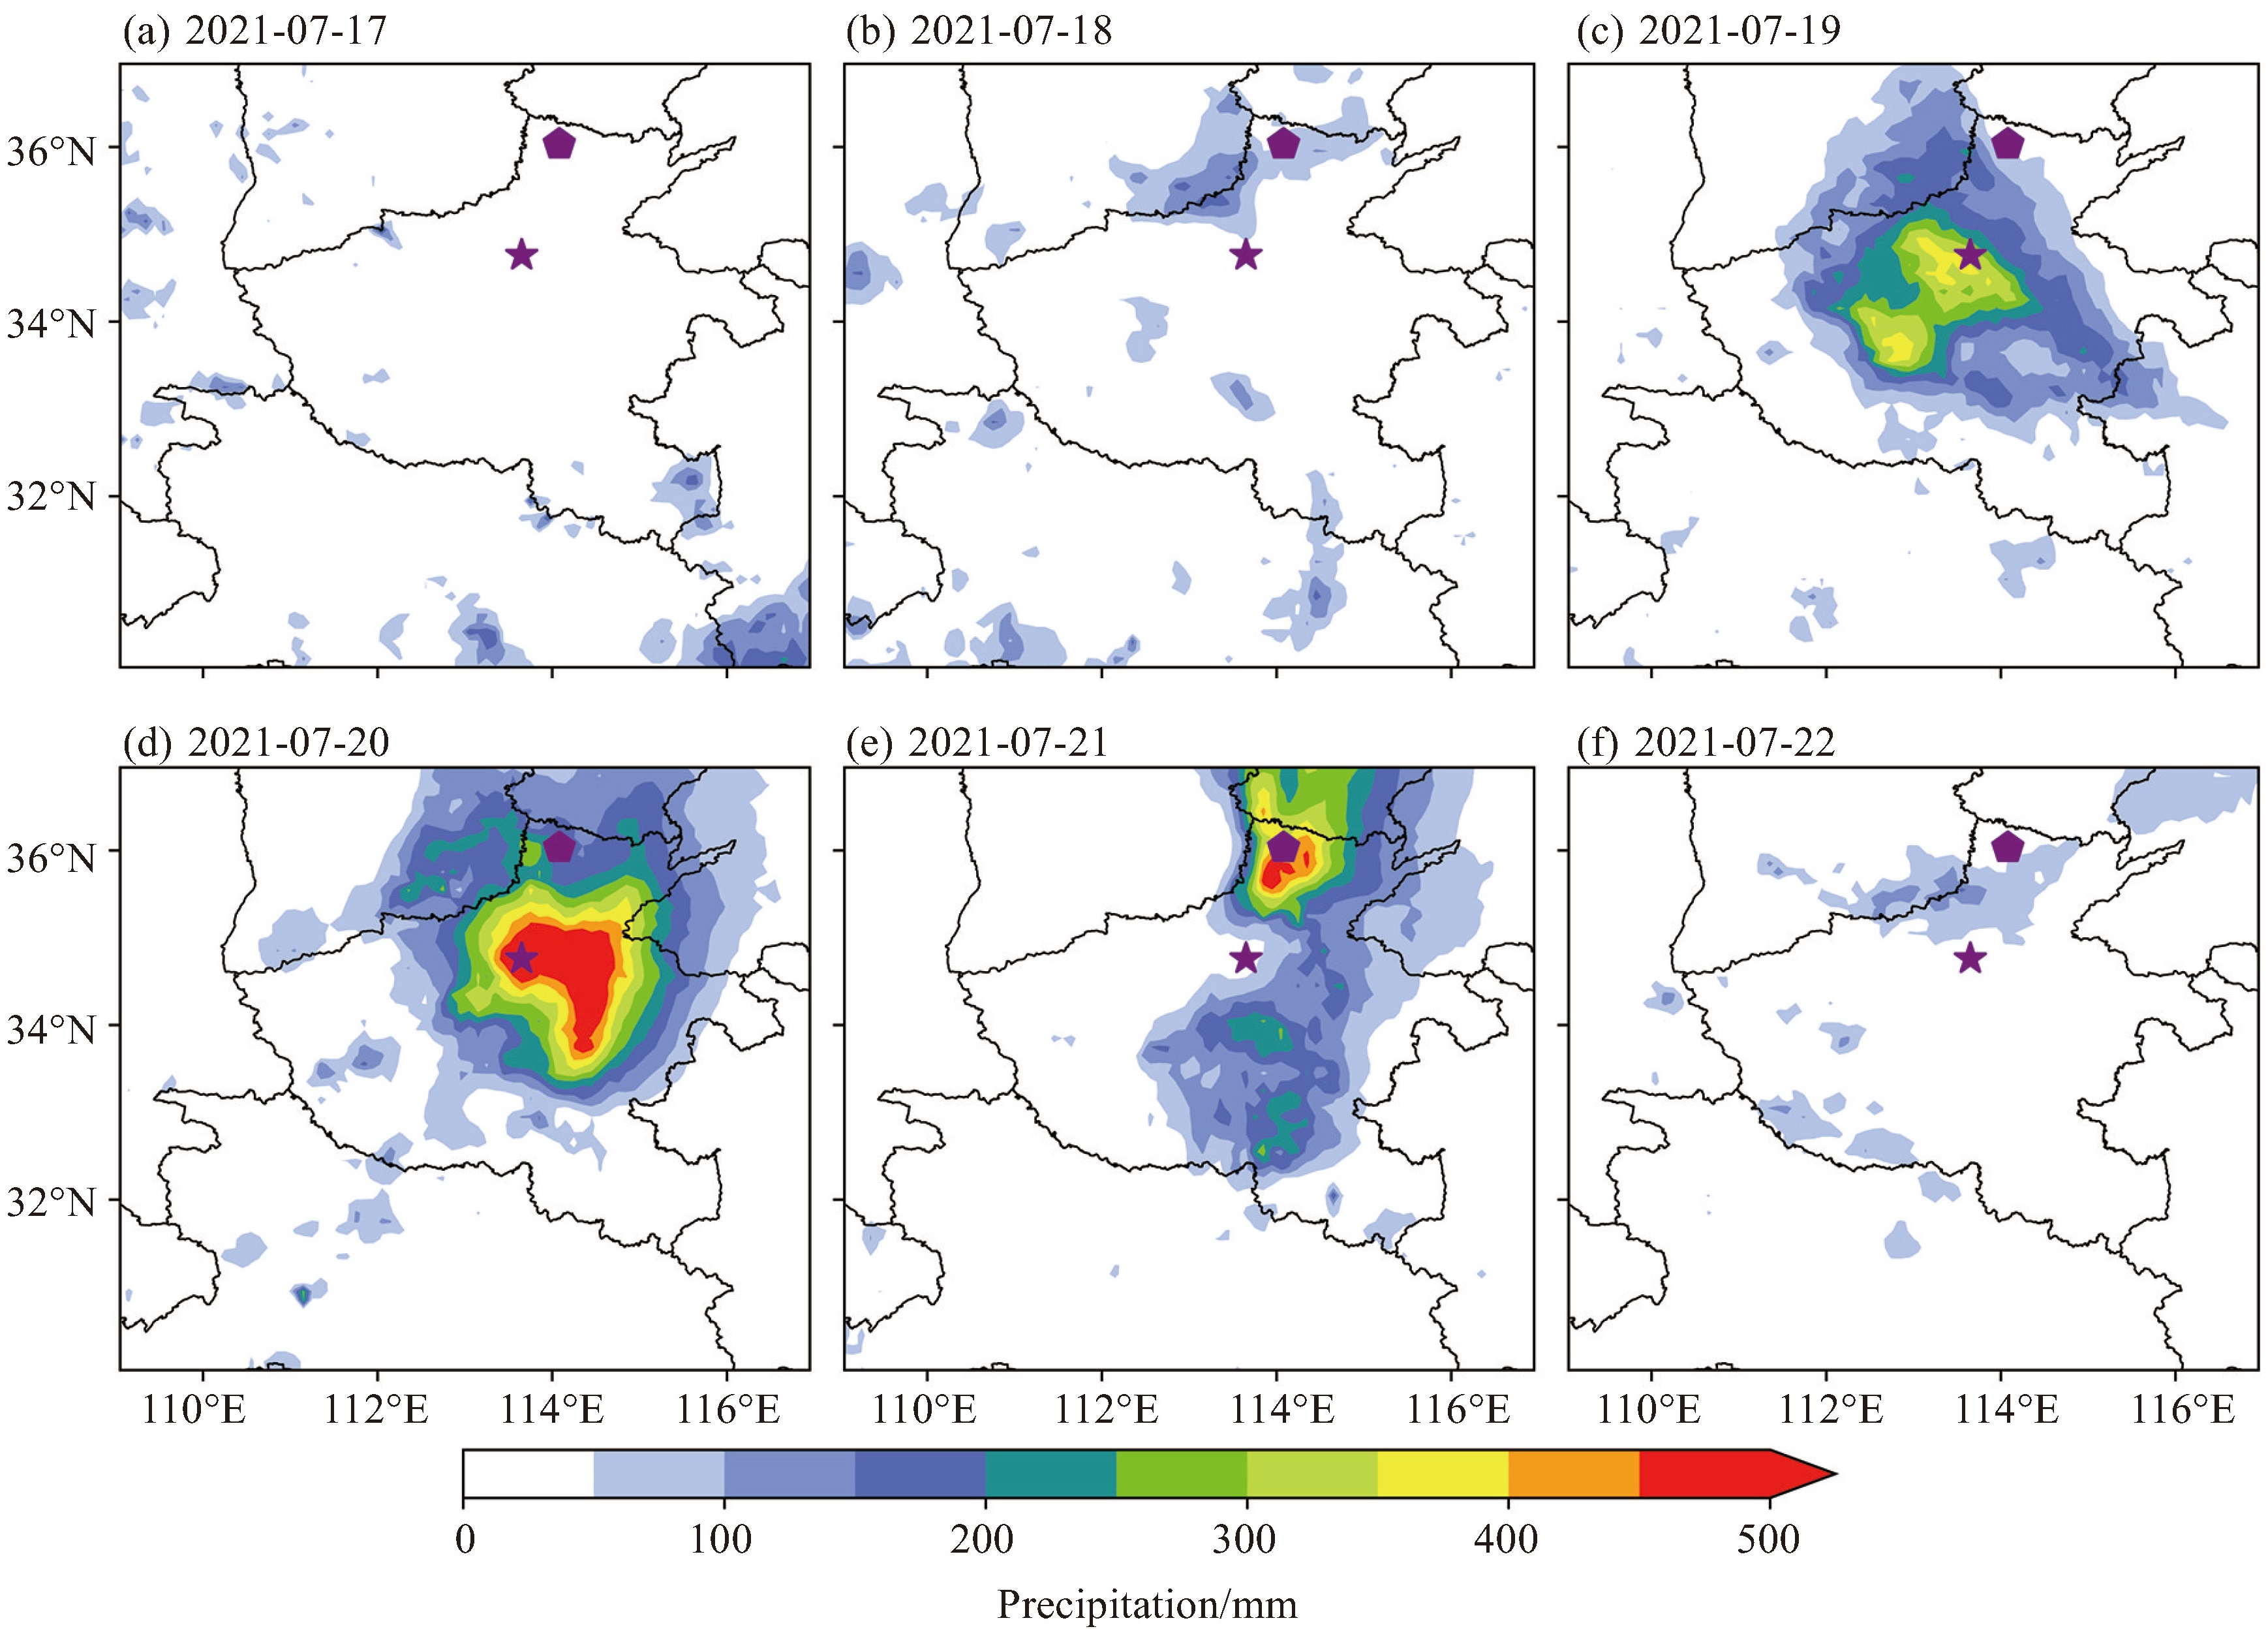
图 1 每日0时—次日0时(UTC世界时)GPM累计降水量分布(单位:mm,紫色五角星为郑州,紫色五边形为安阳),时间为2021年7月17日(a)、18日(b)、19日(c)、20日(d)、21日(e)、22日(f)

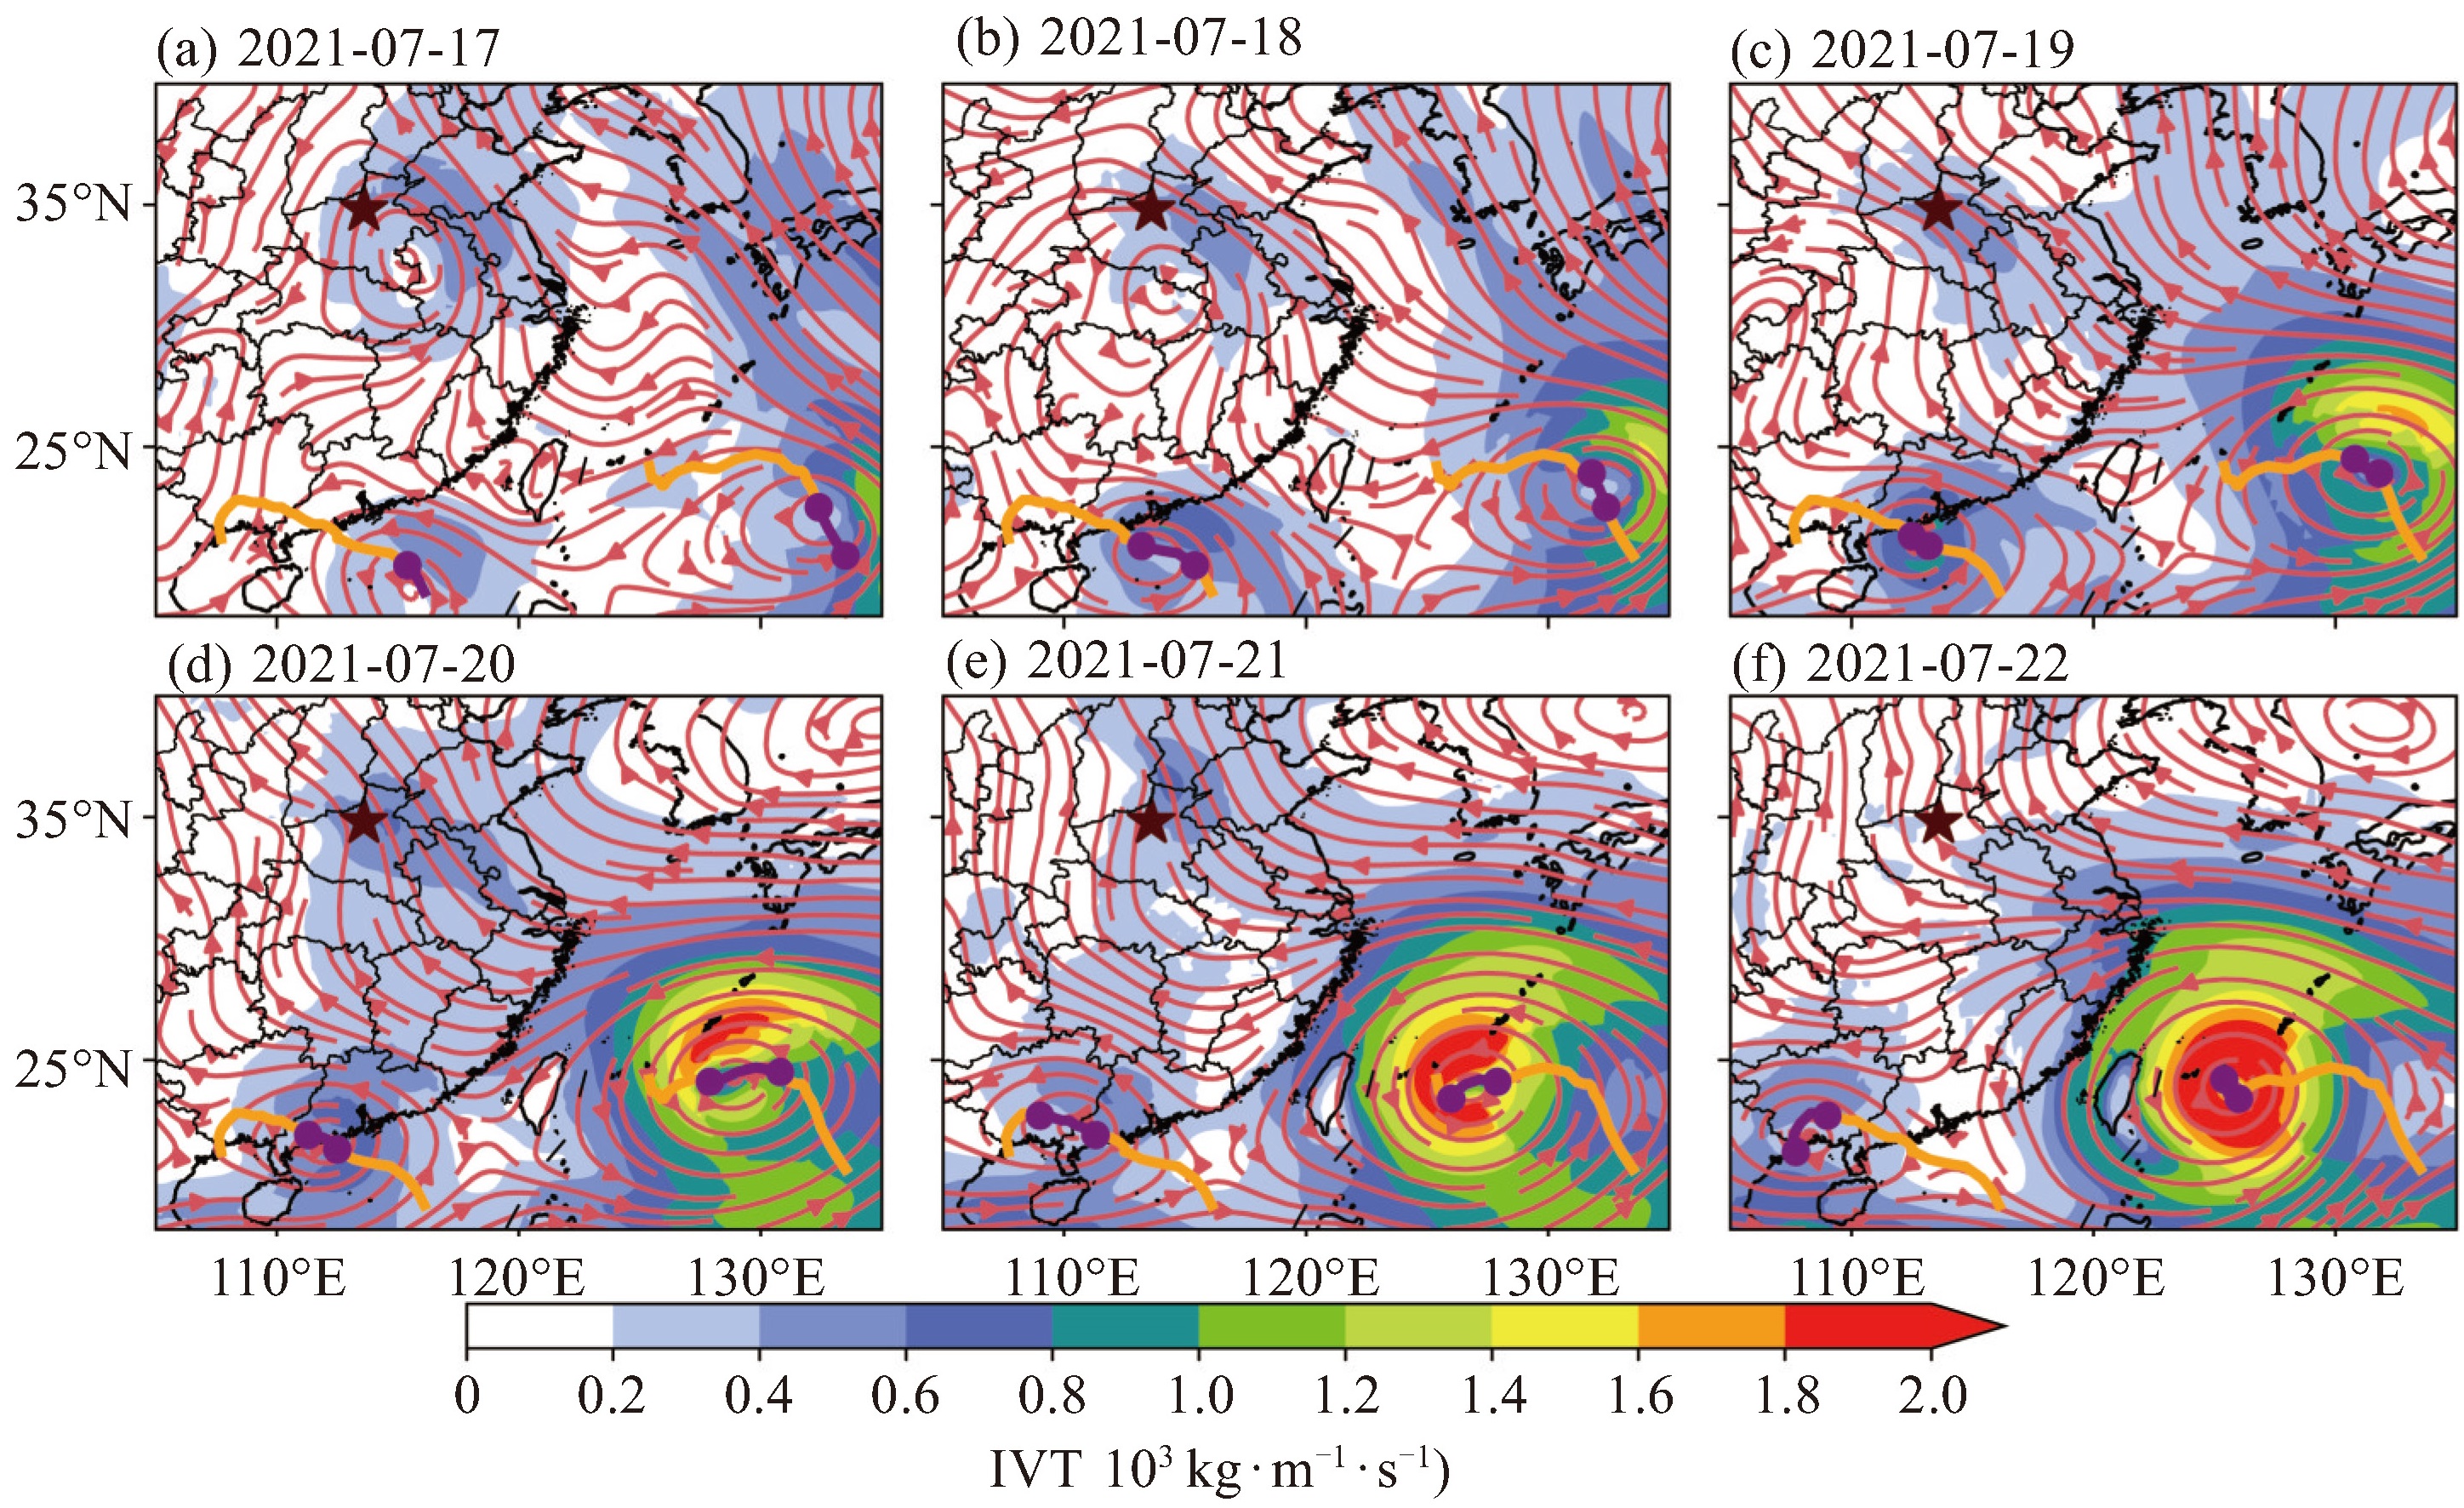
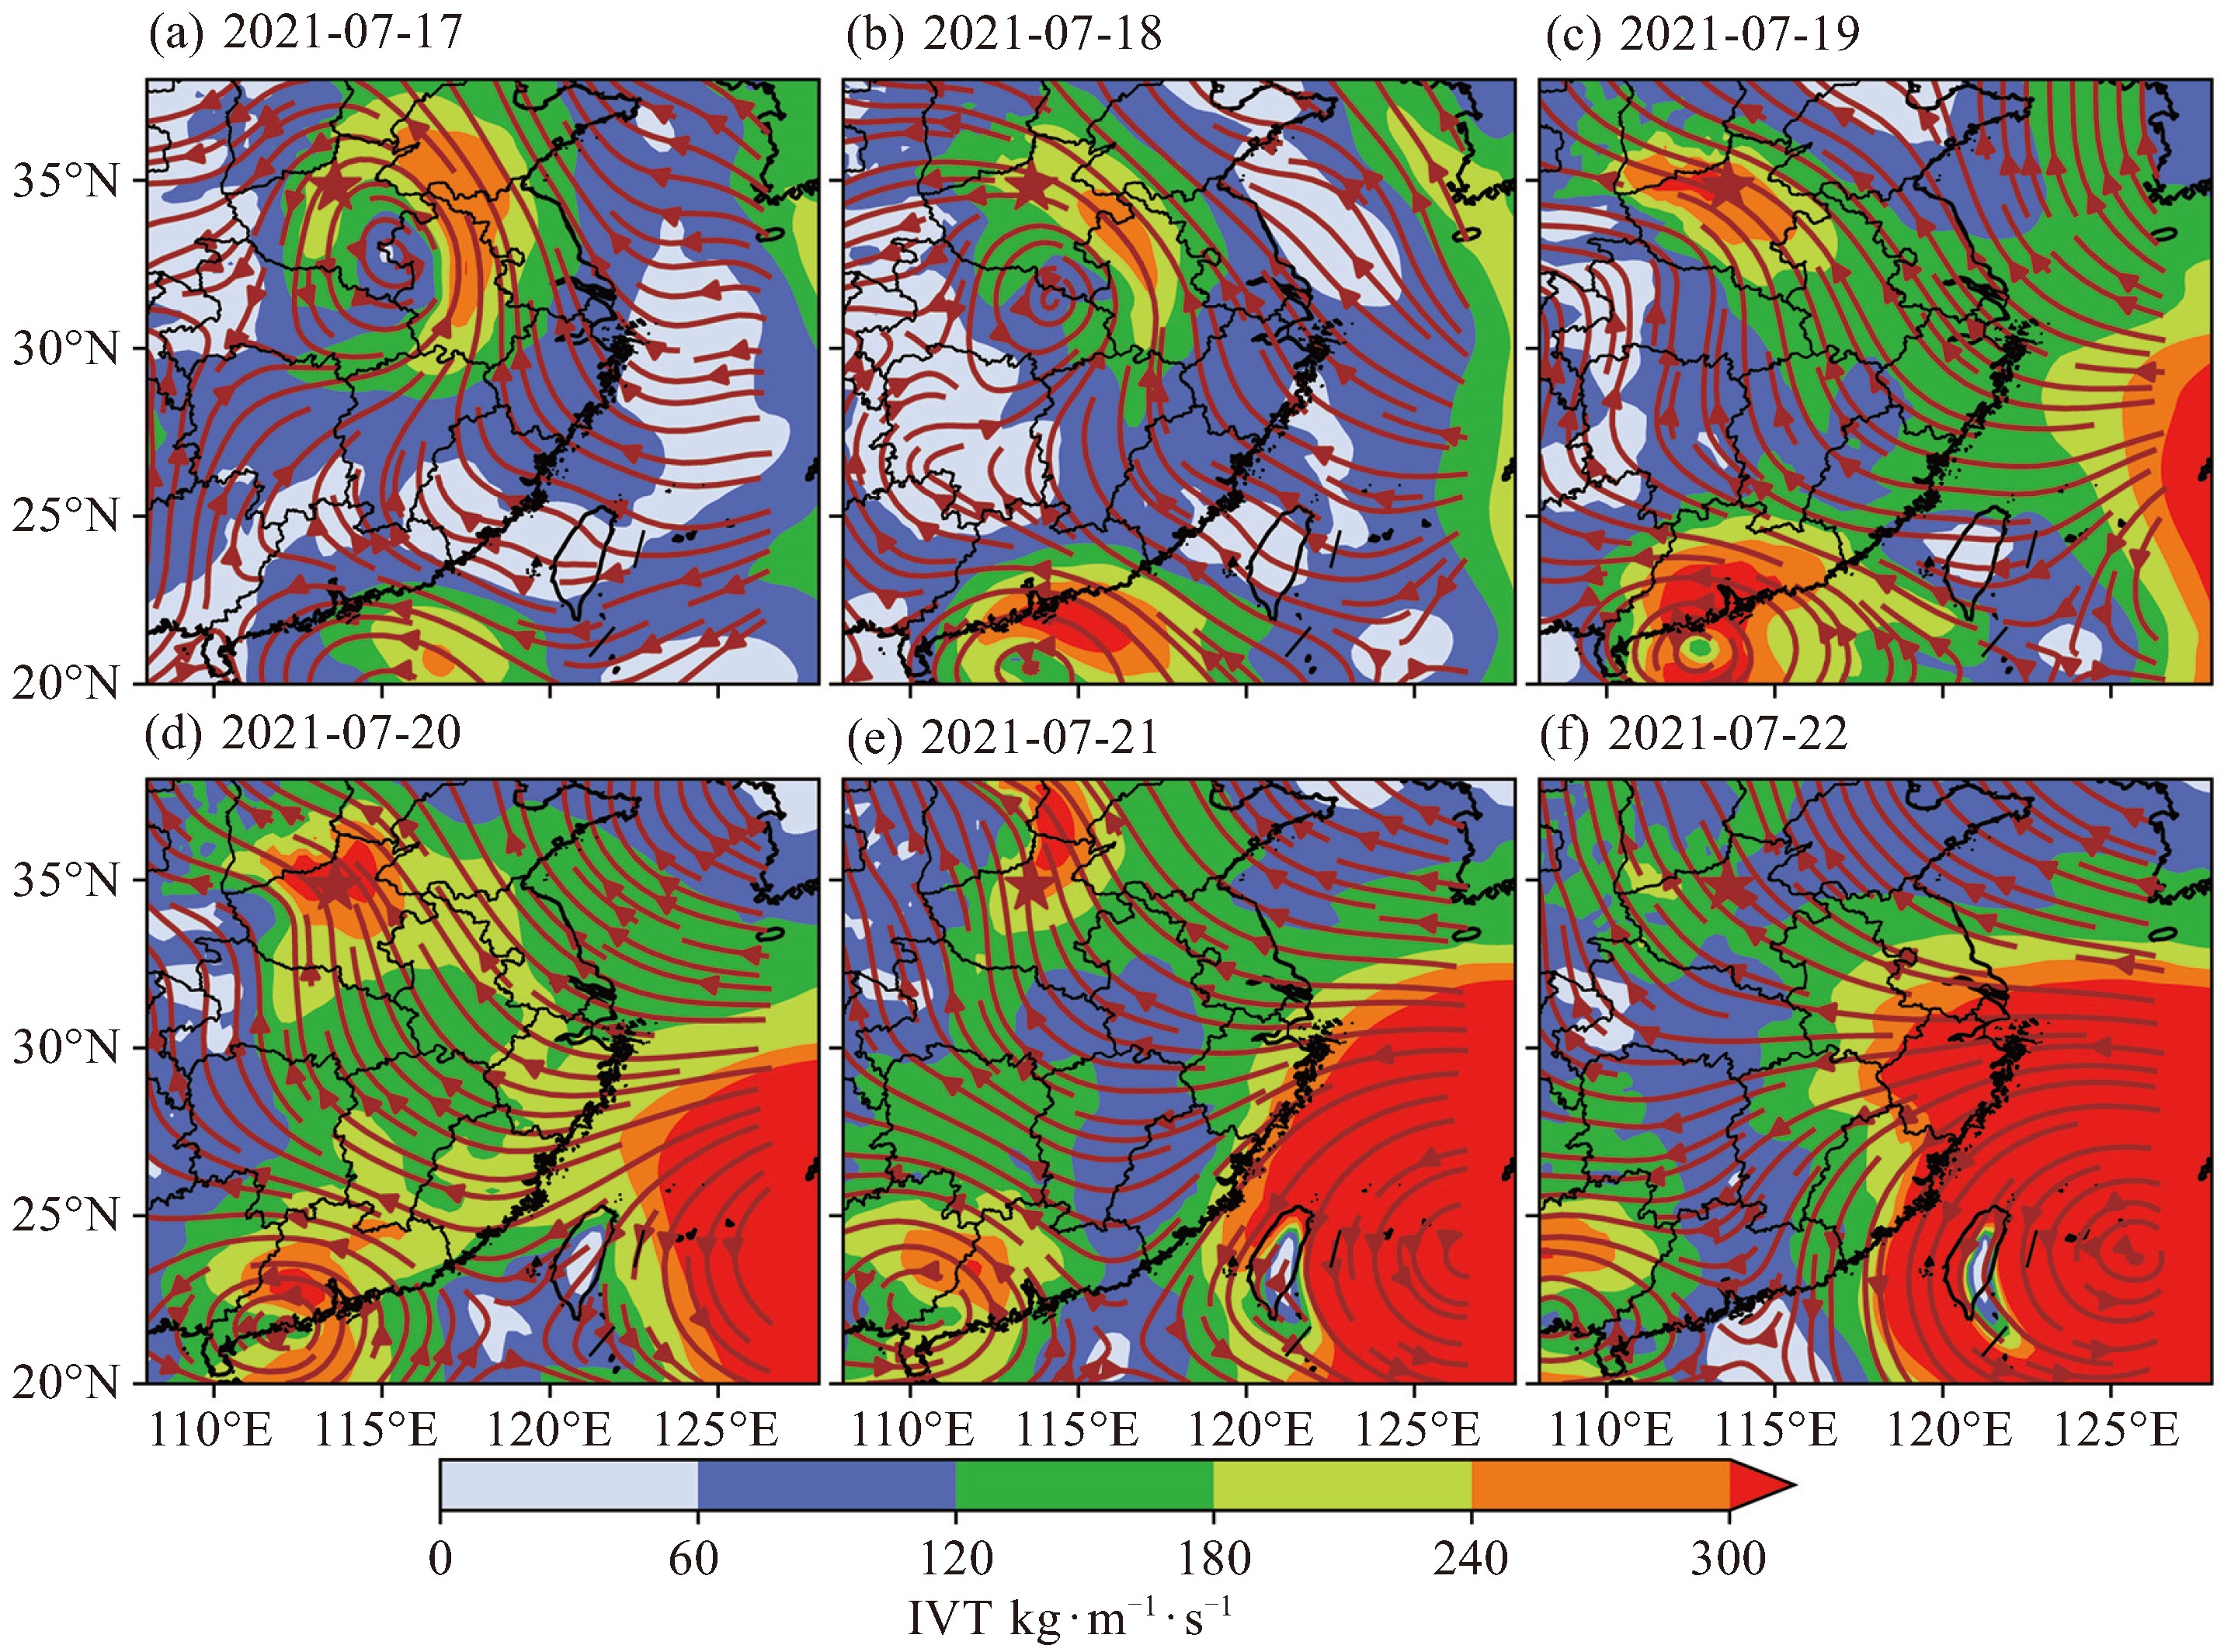
图 2 每日0时—次日0时(UTC世界时)平均IVT(单位:103 kg∙m-1·s-1)填色和流场图(时间为2021年7月17日(a)、18日(b)、19日(c)、20日(d)、21日(e)、22日(f),五角星为河南郑州,橙色线条为17—22日台风“烟花”和“查帕卡”的台风路径,紫色线条部分为当日台风移动路径)

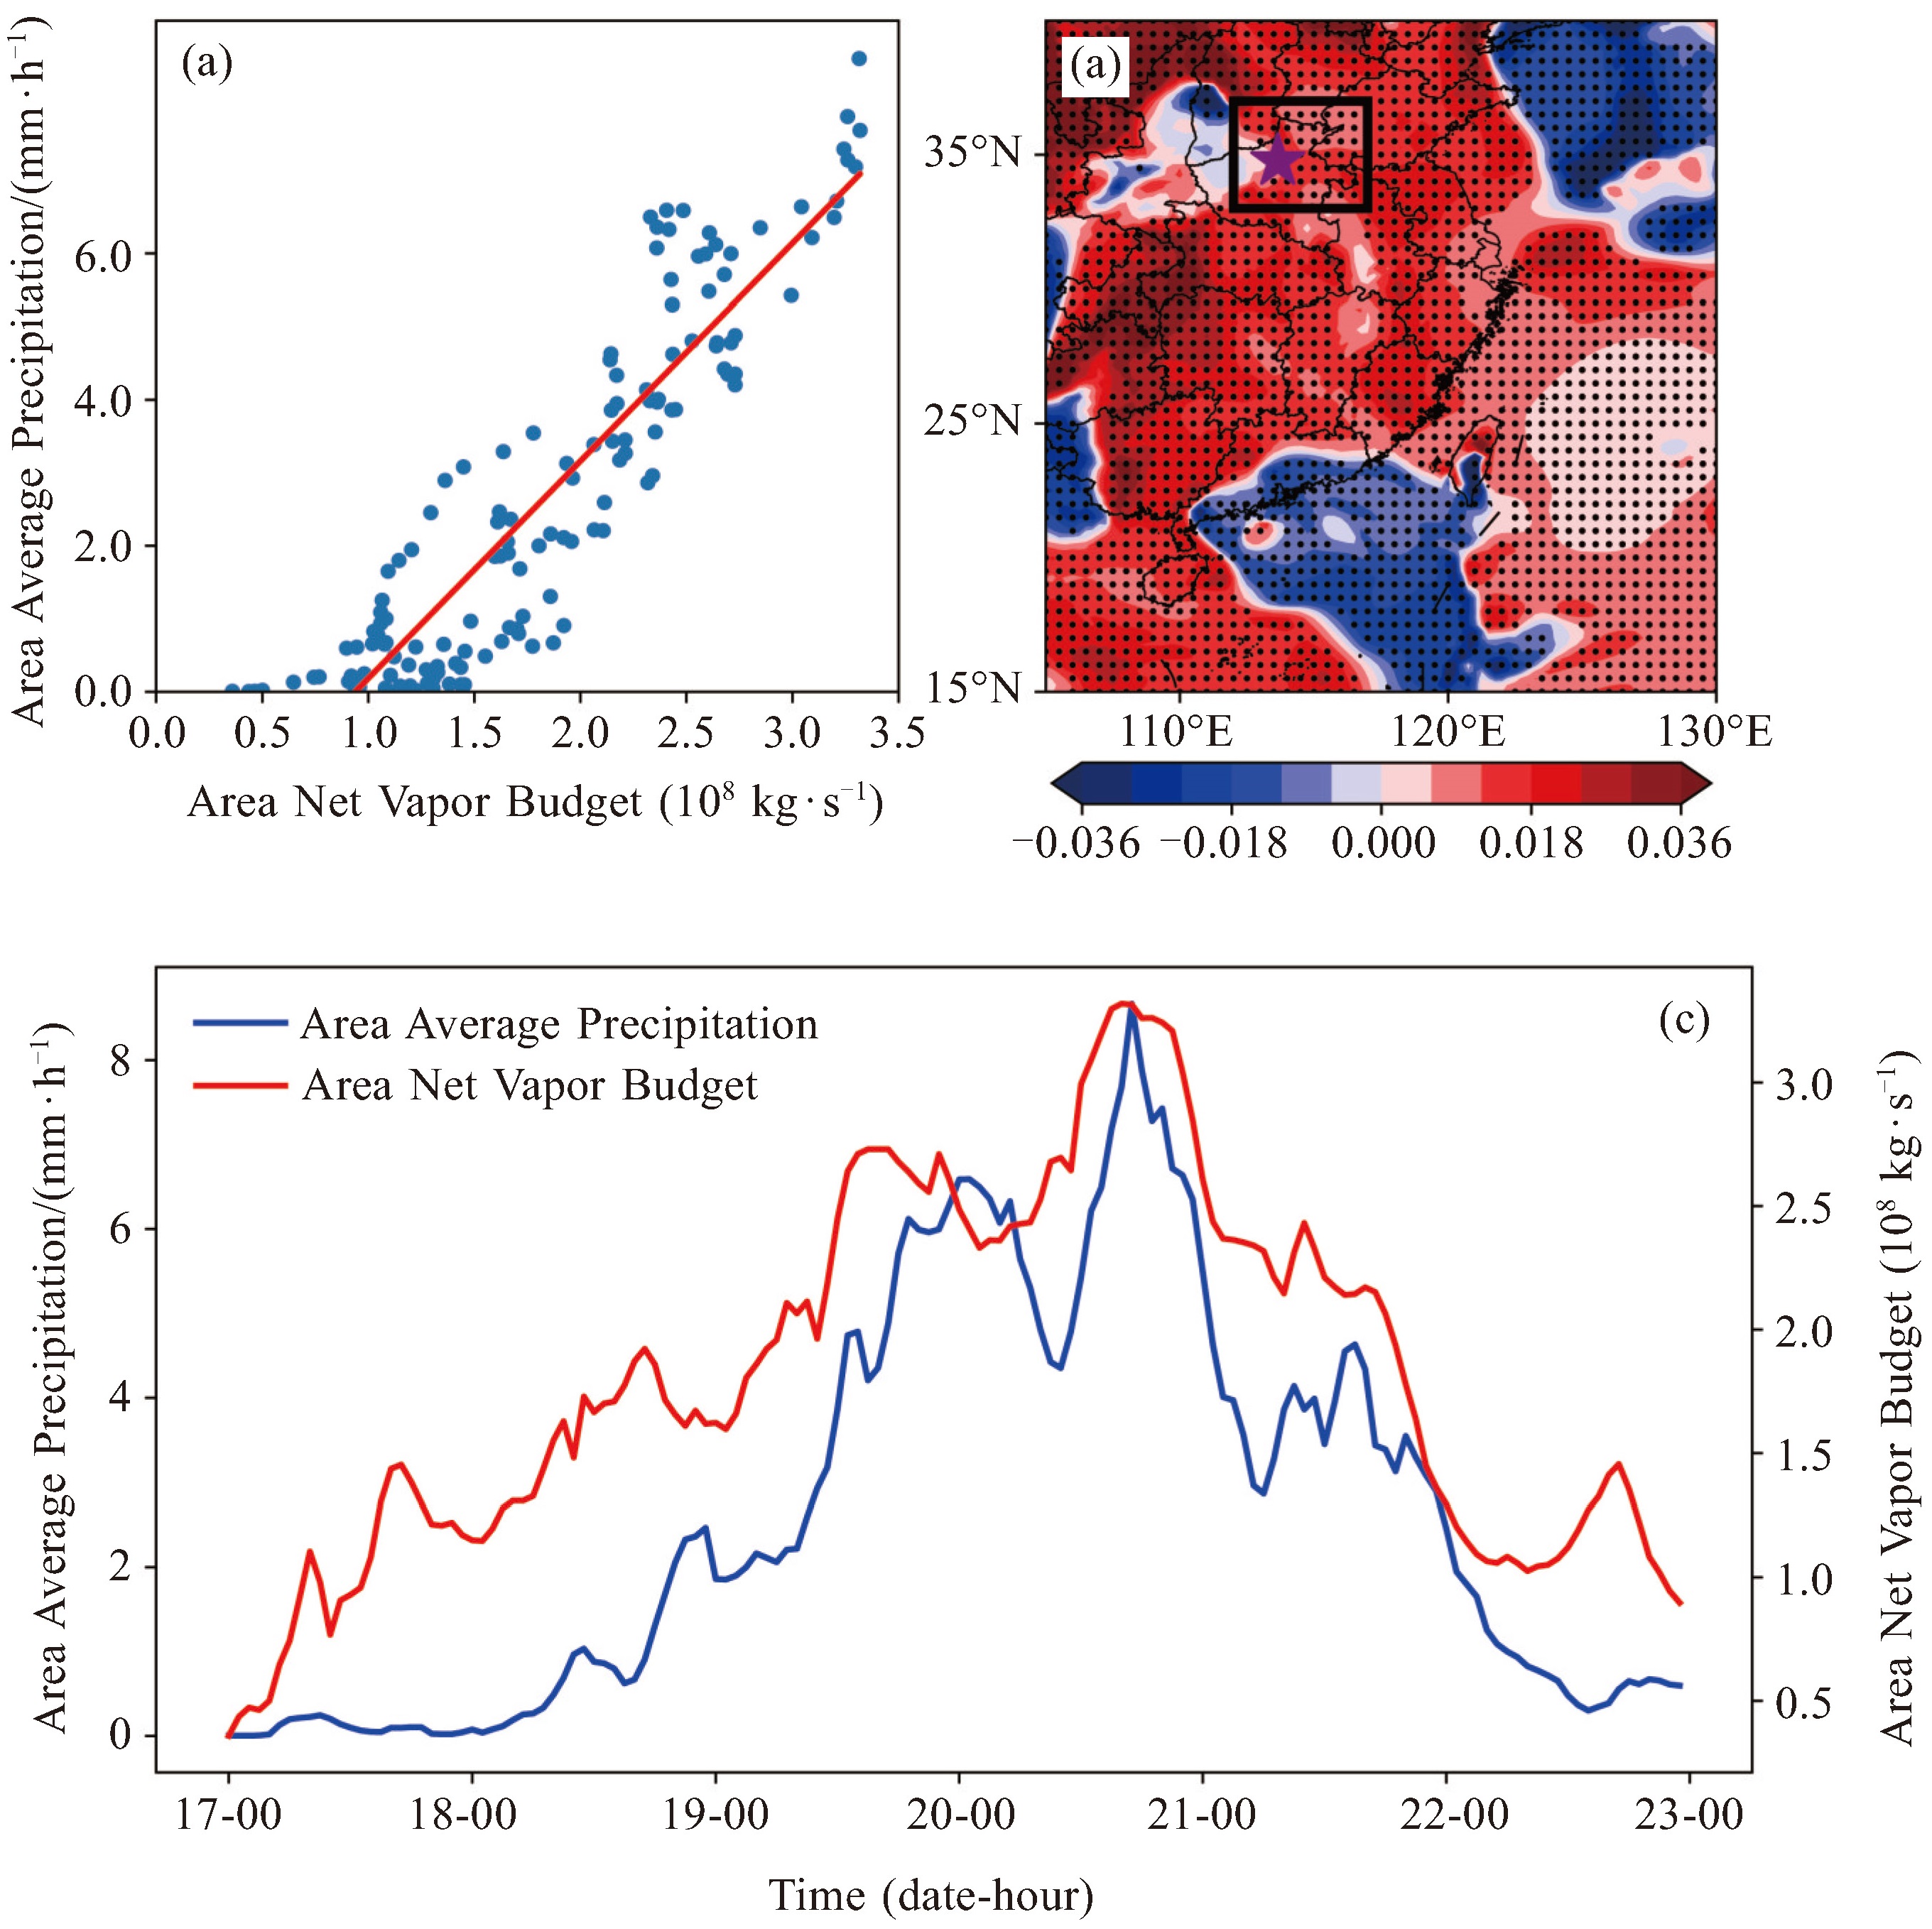
图 3 暴雨期间降水区域平均降水速率(单位:mm∙h-1)与区域水汽总收入速度(单位:108 kg∙s-1)的回归方程(a)(统计区域为图b黑色方框);降水区域平均降水速率(单位:mm∙h-1)与IVT(单位:kg∙m-1·s-1)回归系数的填色图(b)(打点部分通过99%置信度检验,五角星为郑州,黑色方框为降水区域,范围112~117 °E,33~37 °N);2021年7月17日0时—23日0时(UTC世界时)降水区域平均降水速率(单位:mm∙h-1)与水汽总收入速度的时间折线图(c)(单位:108 kg∙s-1,统计区域为图b黑色方框)

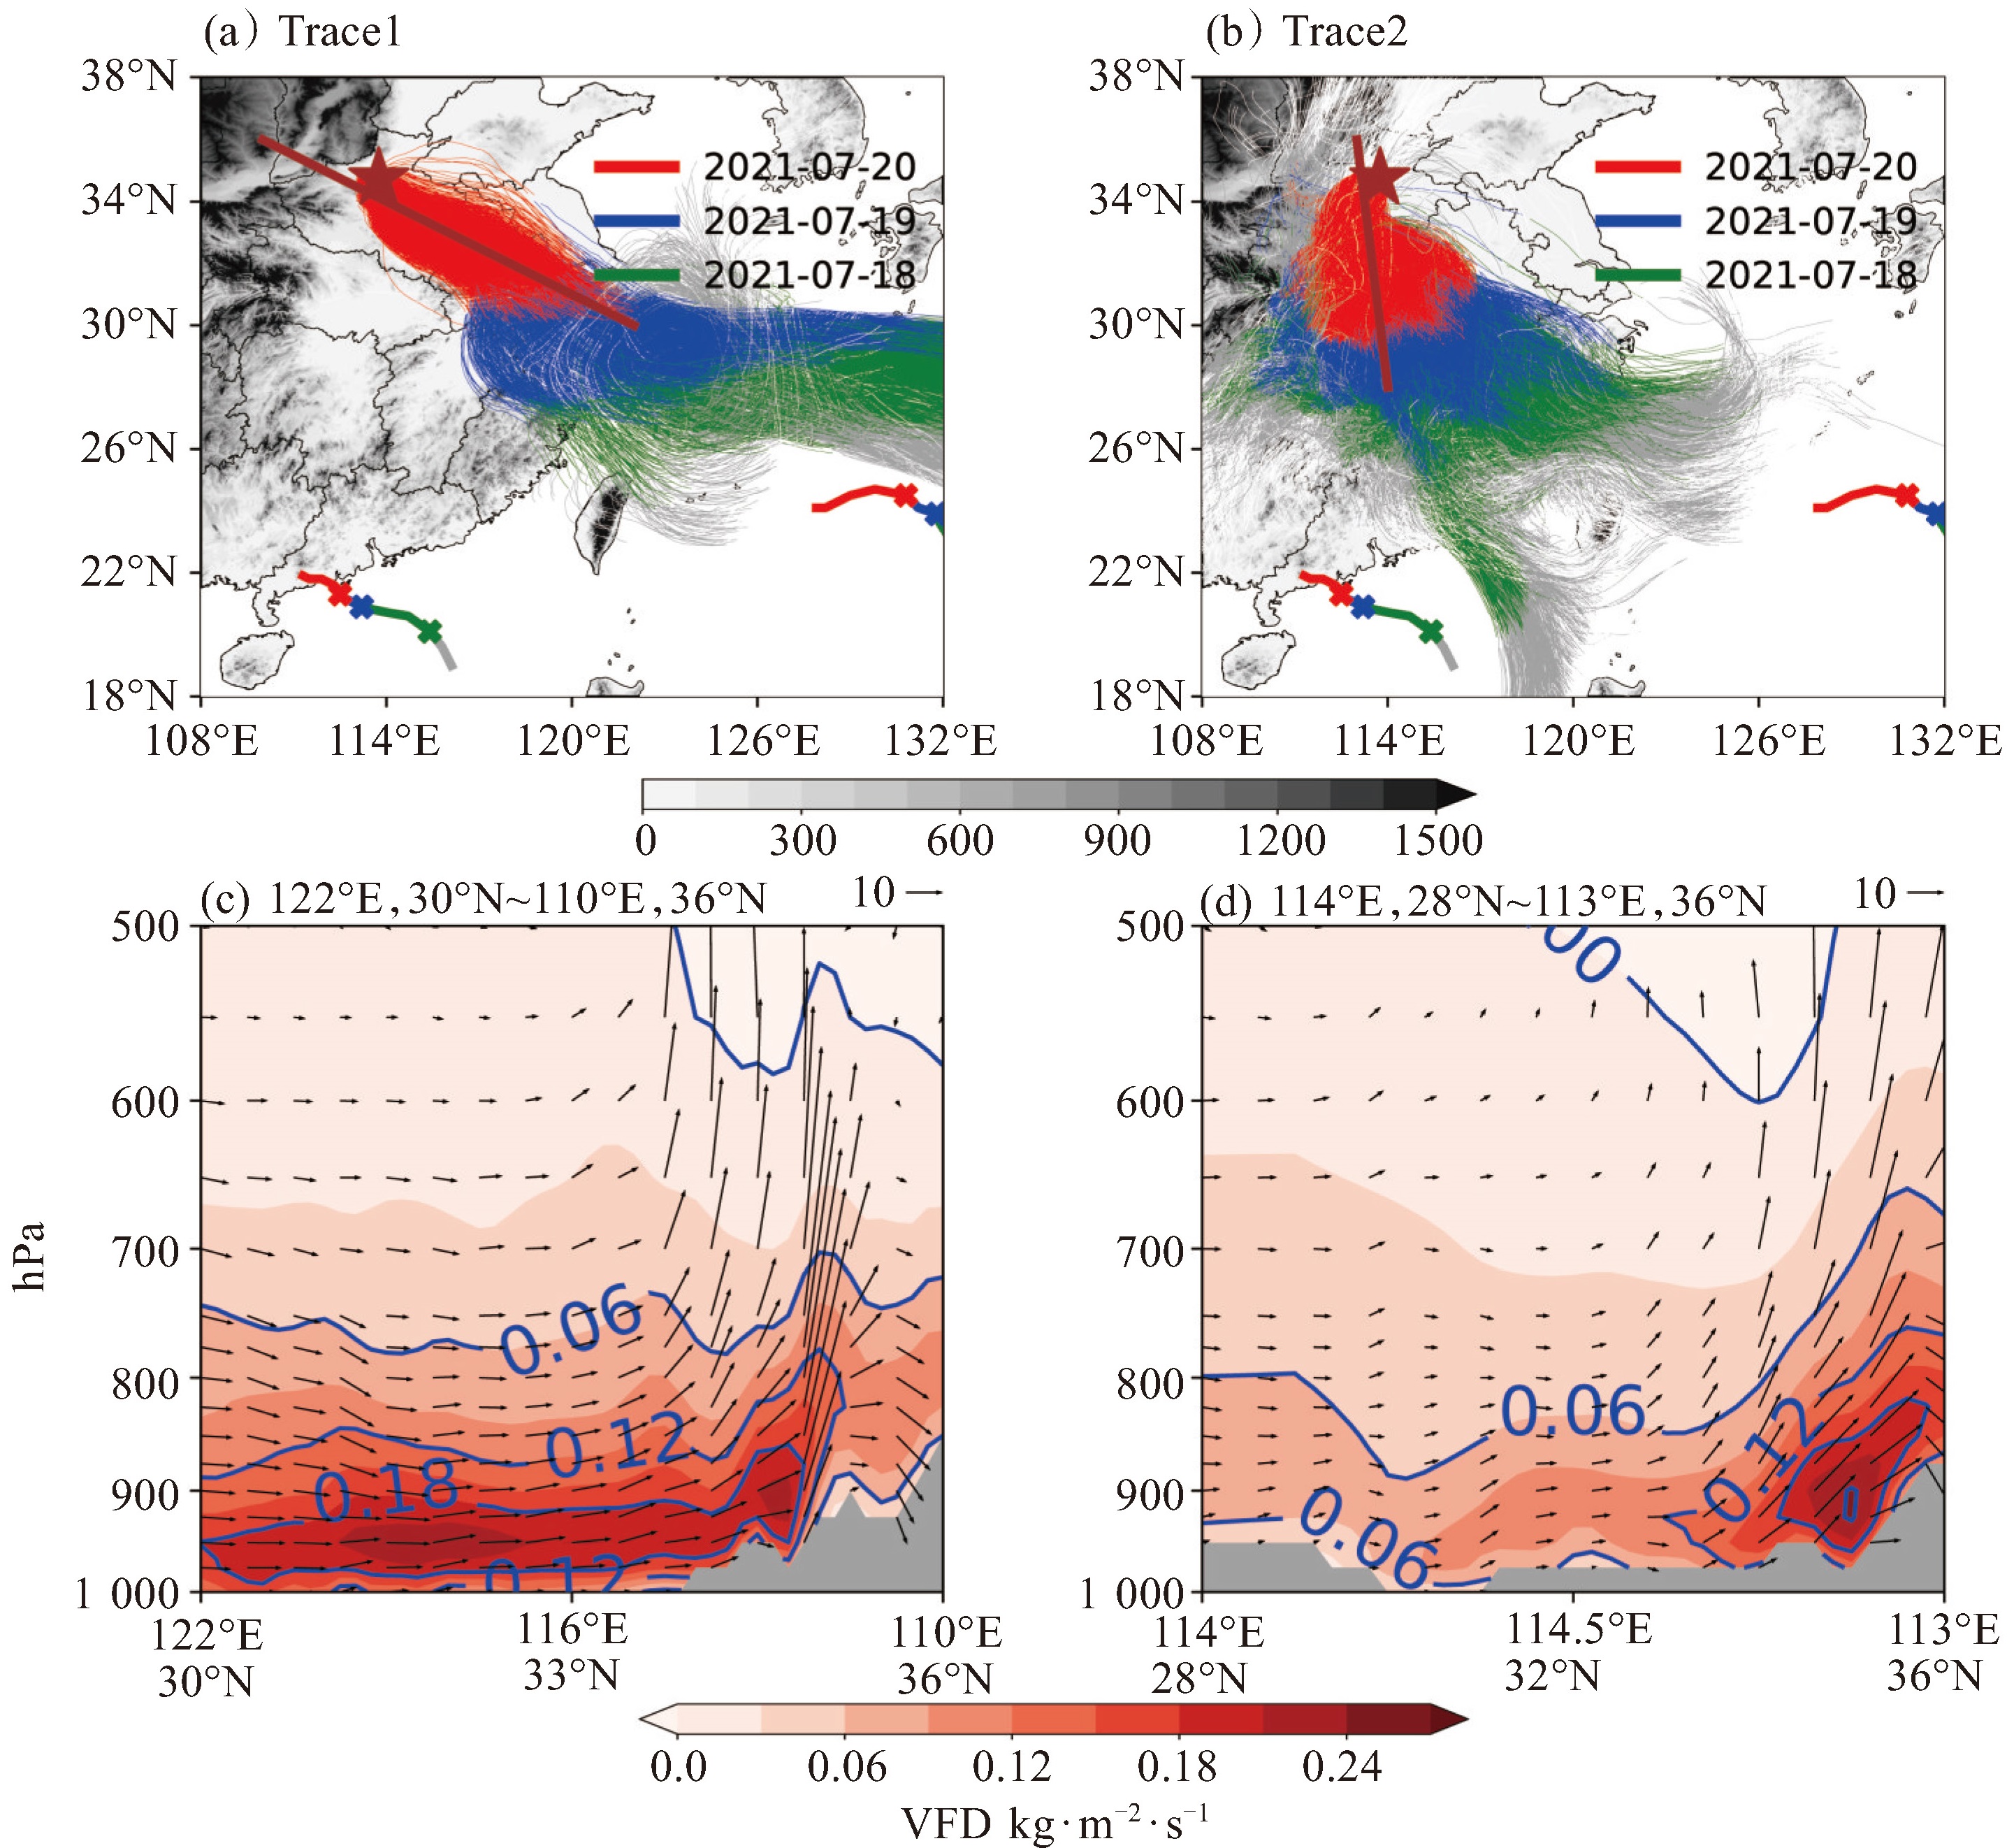
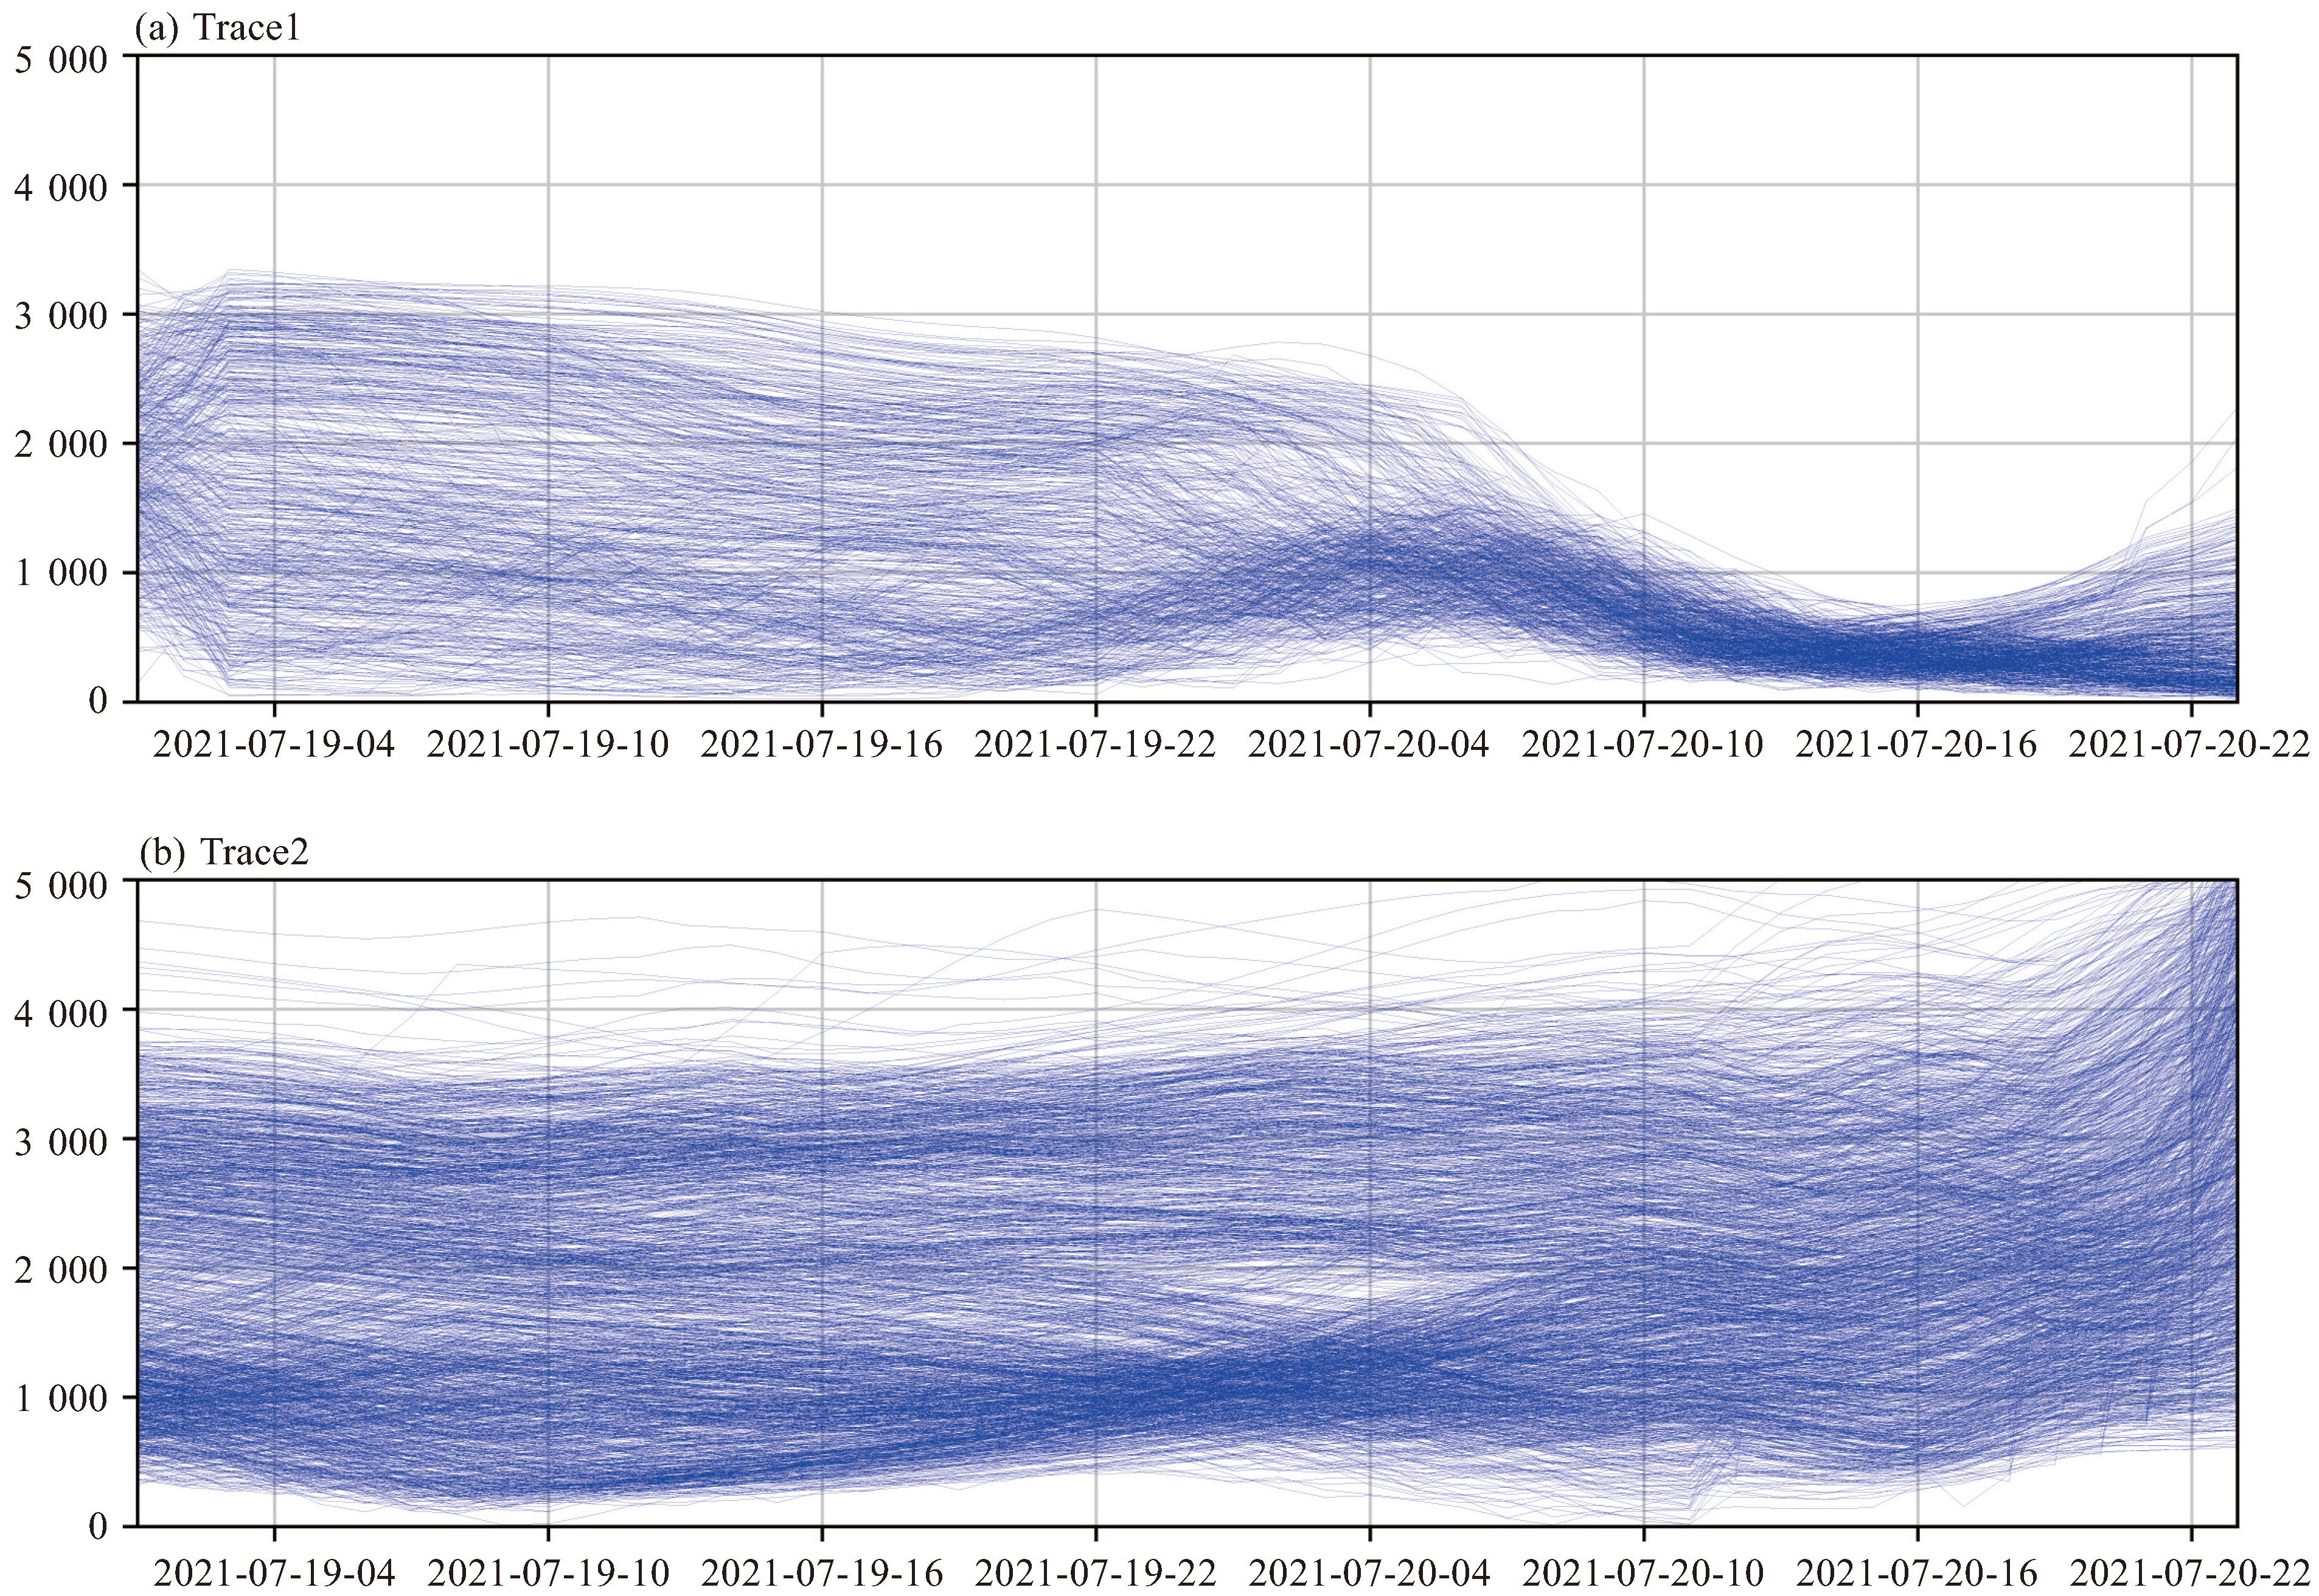
图 4 K-means聚类得到的第一类水汽轨迹(a)和第二类水汽轨迹(b)的时空变化图(UTC世界时,图a、b的棕线分别对应图c、d剖面的位置),以及沿122 °E,30 °N到110 °E,36 °N方向(c)和沿114 °E,28 °N到113 °E,36 °N方向(d)的20日0时—次日0时(UTC世界时)平均VFD(填色和等值线,单位:kg∙m-2∙s-1)、水平风速(箭头,单位:m∙s-1)和垂直速度(箭头,单位:5×10⁻³ Pa∙s-1)的剖面

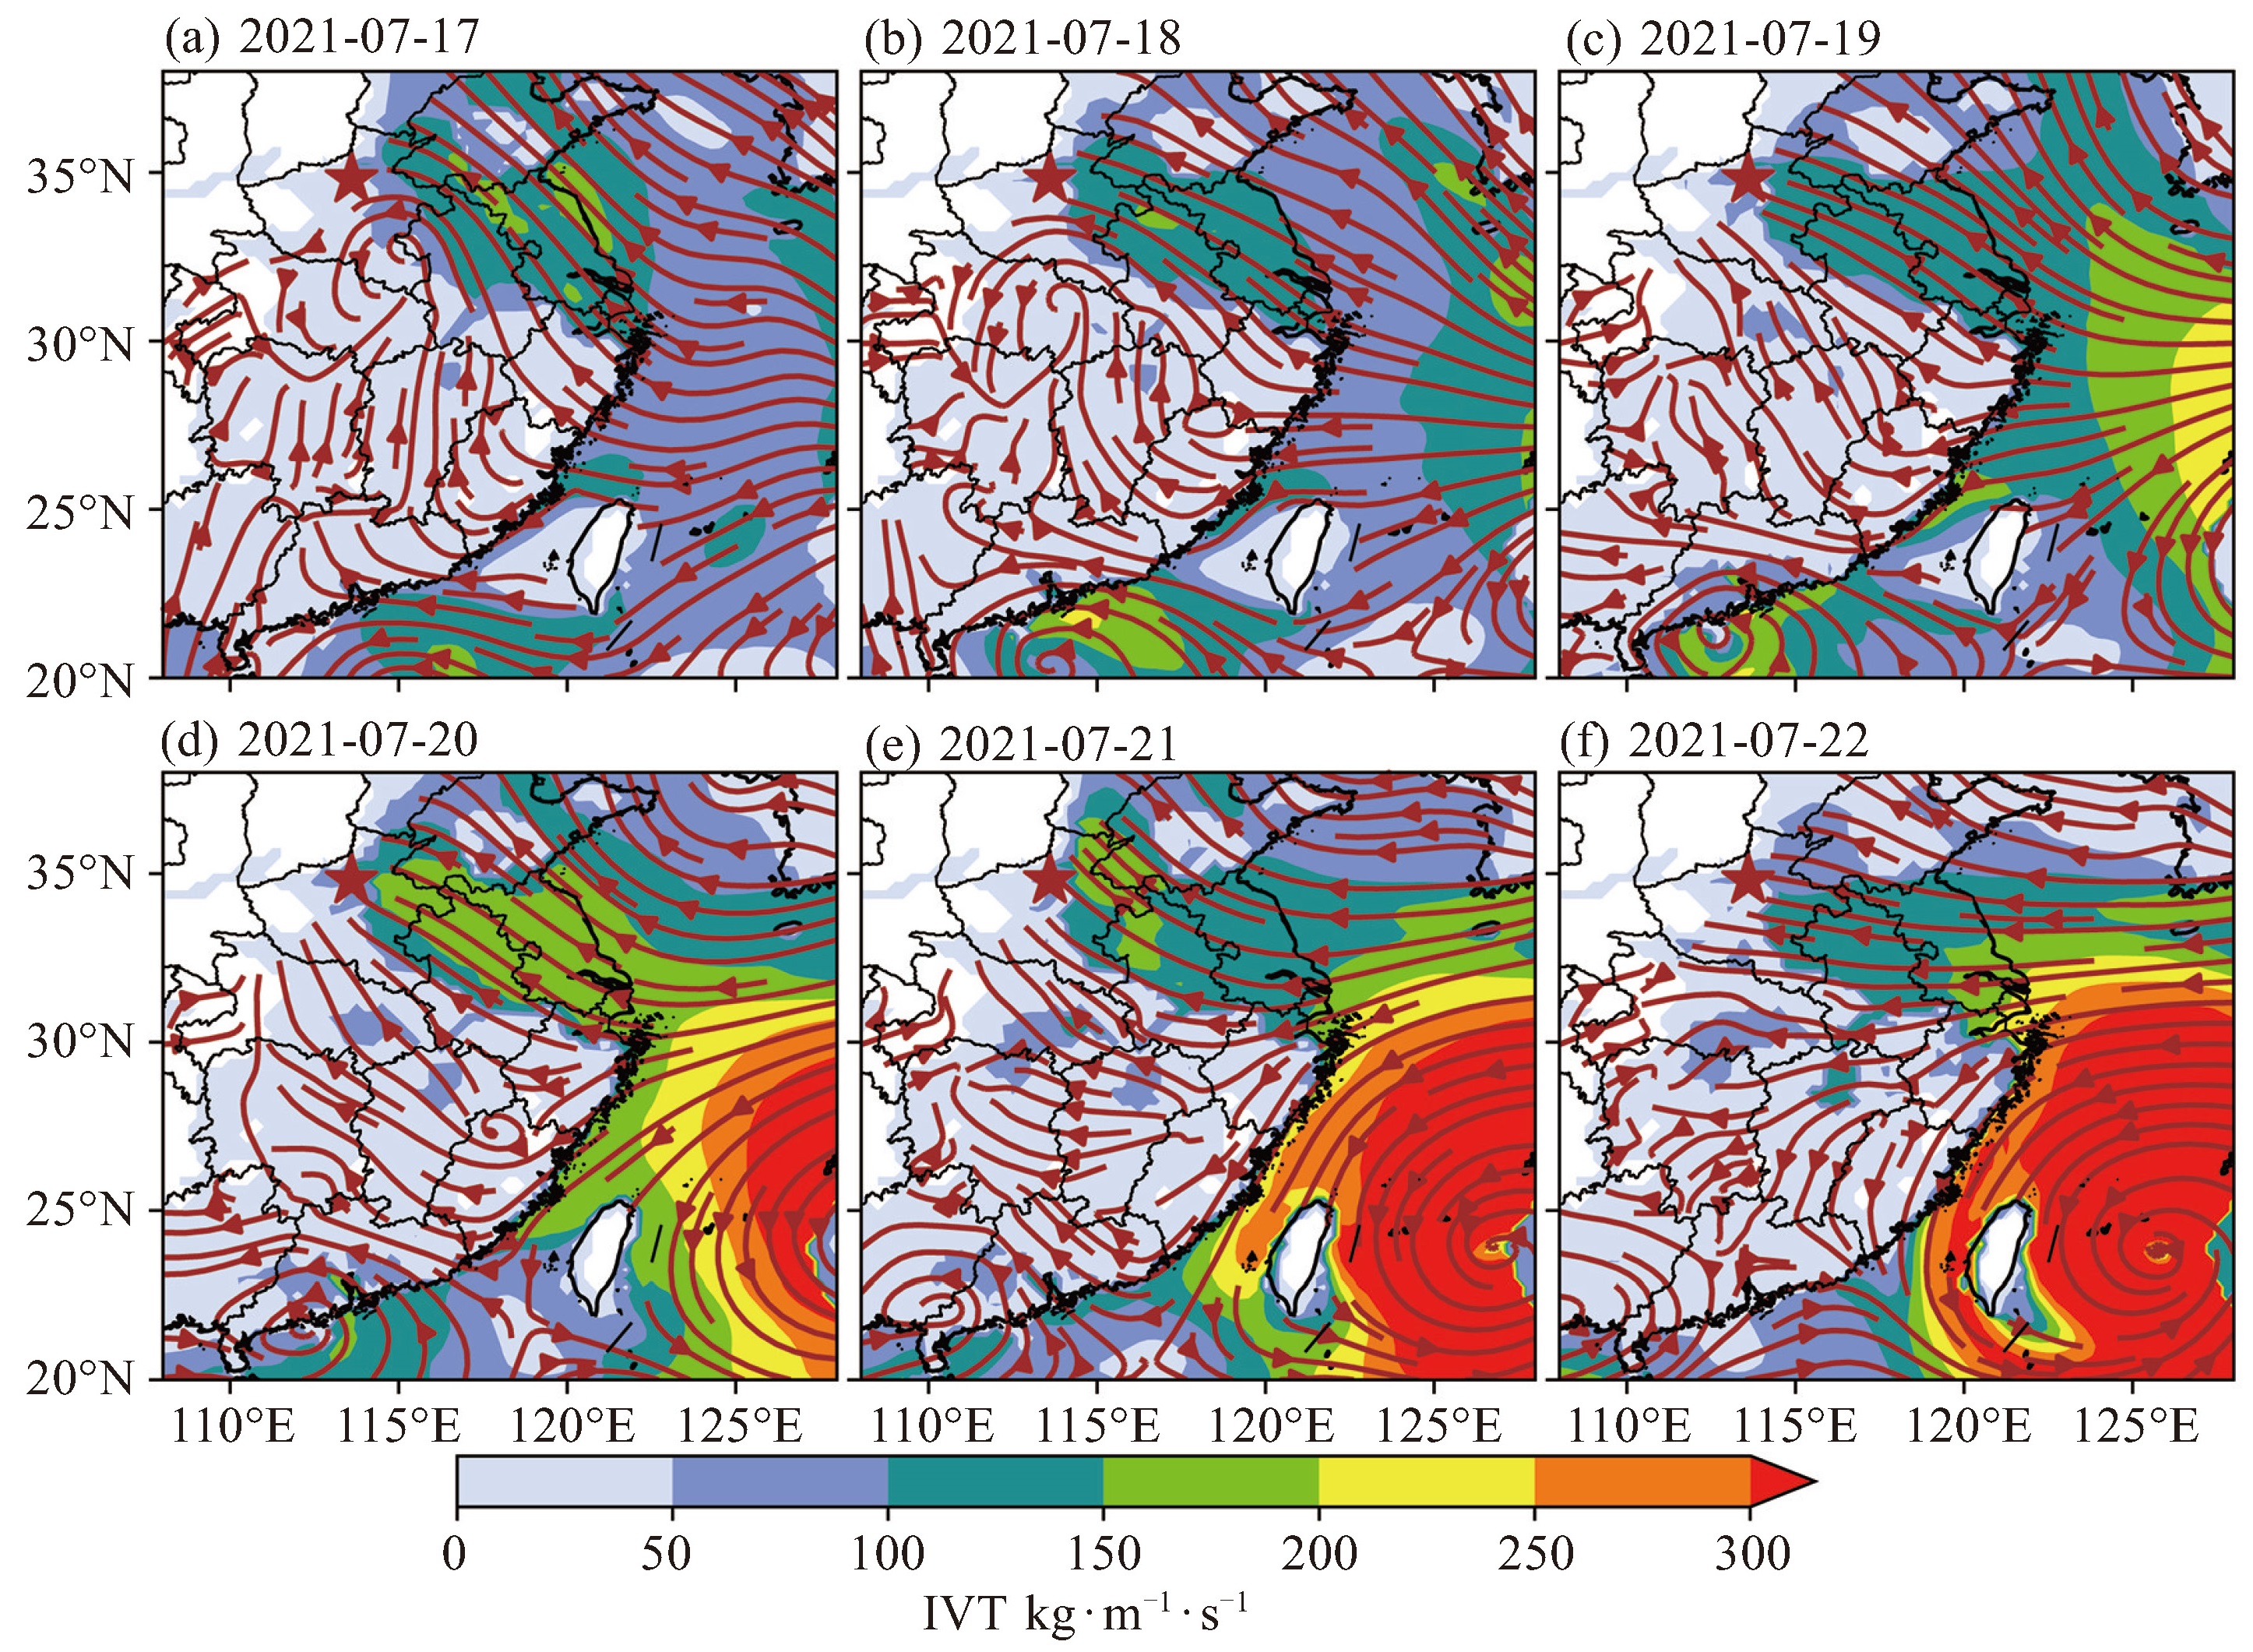
图 6 900~700 hPa高度上每日0时—次日0时(UTC世界时)平均IVT(单位:kg∙m-1∙s-1)填色和流场图,时间为2021年7月17日(a)、18日(b)、19日(c)、20日(d)、21日(e)、22日(f)(五角星为河南郑州);台风“烟花”和“查帕卡”分别位于西北太平洋和南海
-
[1] Myhre G, Alterskjær K, Stjern C W, et al. Frequency of extreme precipitation increases extensively with event rareness under global warming [J]. Scientific reports, 2019, 9(1): 16063. [2] Vazquez M, Nieto R, Liberato M L R, et al. Atmospheric moisture sources associated with extreme precipitation during the peak precipitation month[J]. Weather and Climate Extremes, 2020, 30: 100289. [3] Shearer E J, Afzali Gorooh V, Nguyen P, et al. Unveiling four decades of intensifying precipitation from tropical cyclones using satellite measurements[J]. Scientific reports, 2022, 12(1): 13569. [4] Guzman O, Jiang H. Global increase in tropical cyclone rain rate[J]. Nature communications, 2021, 12(1): 5344. [5] 杨浩, 周文, 汪小康, 等. "21·7"河南特大暴雨降水特征及极端性分析[J]. 气象, 2022, 48(5): 571-579. [6] 崔晓鹏, 杨玉婷. "21·7"河南暴雨水汽源地追踪和定量贡献分析[J]. 大气科学, 2022, 46(6): 1 543-1 556. [7] Wang Z, Wu Y, Xi S, et al. Predictive study on extreme precipitation trends in Henan and their impact on population exposure[J]. Atmosphere, 2023, 14(10): 1484. [8] 陶诗言. 中国之暴雨[M]. 北京: 科学出版社, 1980. [9] 钟敏, 车钦, 张蒙蒙, 等. 华中区域极端降水天气形势及物理量异常度特征[J]. 气象, 2020, 46(04): 503-516. [10] 邱贵强, 武永利, 董春卿, 等. 太行山中南段暖季极端降水的水汽输送特征[J]. 应用气象学报, 2024, 35(3): 285-297. [11] 周璇, 孙继松, 张琳娜, 等. 华北地区持续性极端暴雨过程的分类特征[J]. 气象学报, 2020, 78(5): 761-777. [12] 李超, 崔春光, 徐慧燕, 等. 河南"21 · 7"特大暴雨水汽输送、收支和转化特征对局地强降水的影响机制研究[J]. 气象, 2022, 48(12): 1 497-1 511. [13] 苏爱芳, 席乐, 吕晓娜, 等. 豫北"21·7"极端暴雨过程特征及成因分析[J]. 气象, 2022, 48(5): 556-570. [14] Nieto R, Gimeno L. A database of optimal integration times for Lagrangian studies of atmospheric moisture sources and sinks[J]. Scientific Data, 2019, 6(1): 59. [15] Trenberth K E. Atmospheric moisture residence times and cycling: Implications for rainfall rates and climate change[J]. Climatic Change, 1998, 39: 667-694. [16] Numaguti A. Origin and recycling processes of precipitating water over the Eurasian continent: Experiments using an atmospheric general circulation model[J]. Journal of Geophysical Research: Atmospheres, 1999, 104(D2): 1 957-1 972. [17] Wang N, Zeng X M, Zheng Y, et al. The atmospheric moisture residence time and reference time for moisture tracking over China[J]. Journal of Hydrometeorology, 2018, 19(7): 1 131-1 147. [18] Van Der Ent R J, Tuinenburg O A. The residence time of water in the atmosphere revisited[J]. Hydrology and Earth System Sciences, 2017, 21(2): 779-790. [19] 罗亚丽, 孙继松, 李英, 等. 中国暴雨的科学与预报: 改革开放40年研究成果[J]. 气象学报, 2020, 78(3): 32. [20] 孙建华, 赵思雄, 傅慎明, 等. 2012年7月21日北京特大暴雨的多尺度特征[J]. 大气科学, 2013, 37(3): 705-718. [21] Xue M. Preface to the special collection on the July 2021 Zhengzhou, Henan extreme rainfall event[J]. Advances in Atmospheric Sciences, 2023, 40(3): 335-336. [22] 马长健, 李艳, 徐邦琪. 双低空急流对"21·7"河南极端暴雨的影响[J]. 大气科学, 2023, 47(5): 1 611-1 625. [23] 谷皓东. 河南"21·7"极端降水事件数值模拟研究[D]. 北京: 中国气象科学研究院, 2022. [24] 布和朝鲁, 诸葛安然, 谢作威, 等. 2021年"7.20"河南暴雨水汽输送特征及其关键天气尺度系统[J]. 大气科学, 2022, 46(3): 725-744. [25] Ying M, Zhang W, Yu H, et al. An overview of the China Meteorological Administration tropical cyclone database[J]. Journal of Atmospheric and Oceanic Technology, 2014, 31(2): 287-301. [26] Lu X, Yu H, Ying M, et al. Western North Pacific tropical cyclone database created by the China Meteorological Administration[J]. Advances in Atmospheric Sciences, 2021, 38: 690-699. [27] Hersbach H, Bell B, Berrisford P, et al. The ERA5 global reanalysis[J]. Quarterly Journal of the Royal Meteorological Society, 2020, 146 (730): 1 999-2 049. [28] Muñoz-Sabater J, Dutra E, Agustí-Panareda A, et al. ERA5-Land: A state-of-the-art global reanalysis dataset for land applications[J]. Earth System Science Data, 2021, 13(9): 4 349-4 383. [29] Yilmaz M. Accuracy assessment of temperature trends from ERA5 and ERA5-Land[J]. Science of The Total Environment, 2023, 856: 159182. [30] Jiang Q, Li W, Fan Z, et al. Evaluation of the ERA5 reanalysis precipitation dataset over Chinese Mainland[J]. Journal of Hydrology, 2021, 595: 125660. [31] Skofronick-Jackson G, Petersen W A, Berg W, et al. The Global Precipitation Measurement (GPM) mission for science and society[J]. Bulletin of the American Meteorological Society, 2017, 98(8): 1 679-1 695. [32] 施丽娟, 冯婉悦, 雷勇, 等. GPM日降水产品在中国大陆的准确性评估[J]. 气象, 2022, 48(11): 1 428-1 438. [33] 李麒崙, 张万昌, 易路, 等. GPM与TRMM降水数据在中国大陆的精度评估与对比[J]. 水科学进展, 2018, 29(3): 303-313. [34] Stohl A, James P. A Lagrangian analysis of the atmospheric branch of the global water cycle. Part Ⅰ: Method description, validation, and demonstration for the August 2002 flooding in central Europe[J]. Journal of Hydrometeorology, 2004, 5(4): 656-678. [35] Stohl A, Hittenberger M, Wotawa G. Validation of the Lagrangian particle dispersion model FLEXPART against large-scale tracer experiment data[J]. Atmospheric Environment, 1998, 32(24): 4 245-4 264. [36] 陈斌, 徐祥德, 施晓晖. 拉格朗日方法诊断2007年7月中国东部系列极端降水的水汽输送路径及其可能蒸发源区[J]. 气象学报, 2011, 69(5): 810-818. [37] 朱丽, 刘蓉, 王欣, 等. 基于FLEXPART模式对黄河源区盛夏降水异常的水汽源地及输送特征研究[J]. 高原气象, 2019, 38(3): 484-496. [38] Pérez-Alarcón A, Sorí R, Fernández-Alvarez J C, et al. Moisture source for the precipitation of tropical cyclones over the Pacific Ocean through a Lagrangian approach[J]. Journal of Climate, 2023, 36(4): 1 059-1 083. [39] Sinaga K P, Yang M S. Unsupervised K-means clustering algorithm[J]. IEEE access, 2020, 8: 80 716-80 727. [40] Selvida D, Zarlis M, Situmorang Z. Analysis of the effect early cluster centre points on the combination of k-means algorithms and sum of squared error on k centroid[C]//IOP Conference Series: Materials Science and Engineering. IOP Publishing, 2020, 725(1): 012089. [41] Qin Z, Yang J, Yang T, et al. Vertical transport of water in isolated convective clouds in the interior western United States as observed using airborne in-situ measurements[J]. Atmospheric Research, 2023, 285: 106629. [42] Jorgensen D P, LeMone M A. Vertical velocity characteristics of oceanic convection[J]. Journal of the Atmospheric Sciences, 1989, 46(5): 621-640. [43] Yang J, Wang Z, Heymsfield A J, et al. Characteristics of vertical air motion in isolated convective clouds[J]. Atmospheric Chemistry and Physics, 2016, 16(15): 10 159-10 173. [44] Ralph F M, Iacobellis S F, Neiman P J, et al. Dropsonde observations of total integrated water vapor transport within North Pacific atmospheric rivers[J]. Journal of Hydrometeorology, 2017, 18(9): 2 577-2 596. -

 下载:
下载:
 点击查看大图
计量
- 文章访问数: 3
- HTML全文浏览量: 3
- PDF下载量: 2
- 被引次数: 0
 粤公网安备 4401069904700003号