


Temporal and Spatial Variation of PM2.5 Concentration in the Pearl River Delta Urban Agglomeration from 2000 to 2022
-
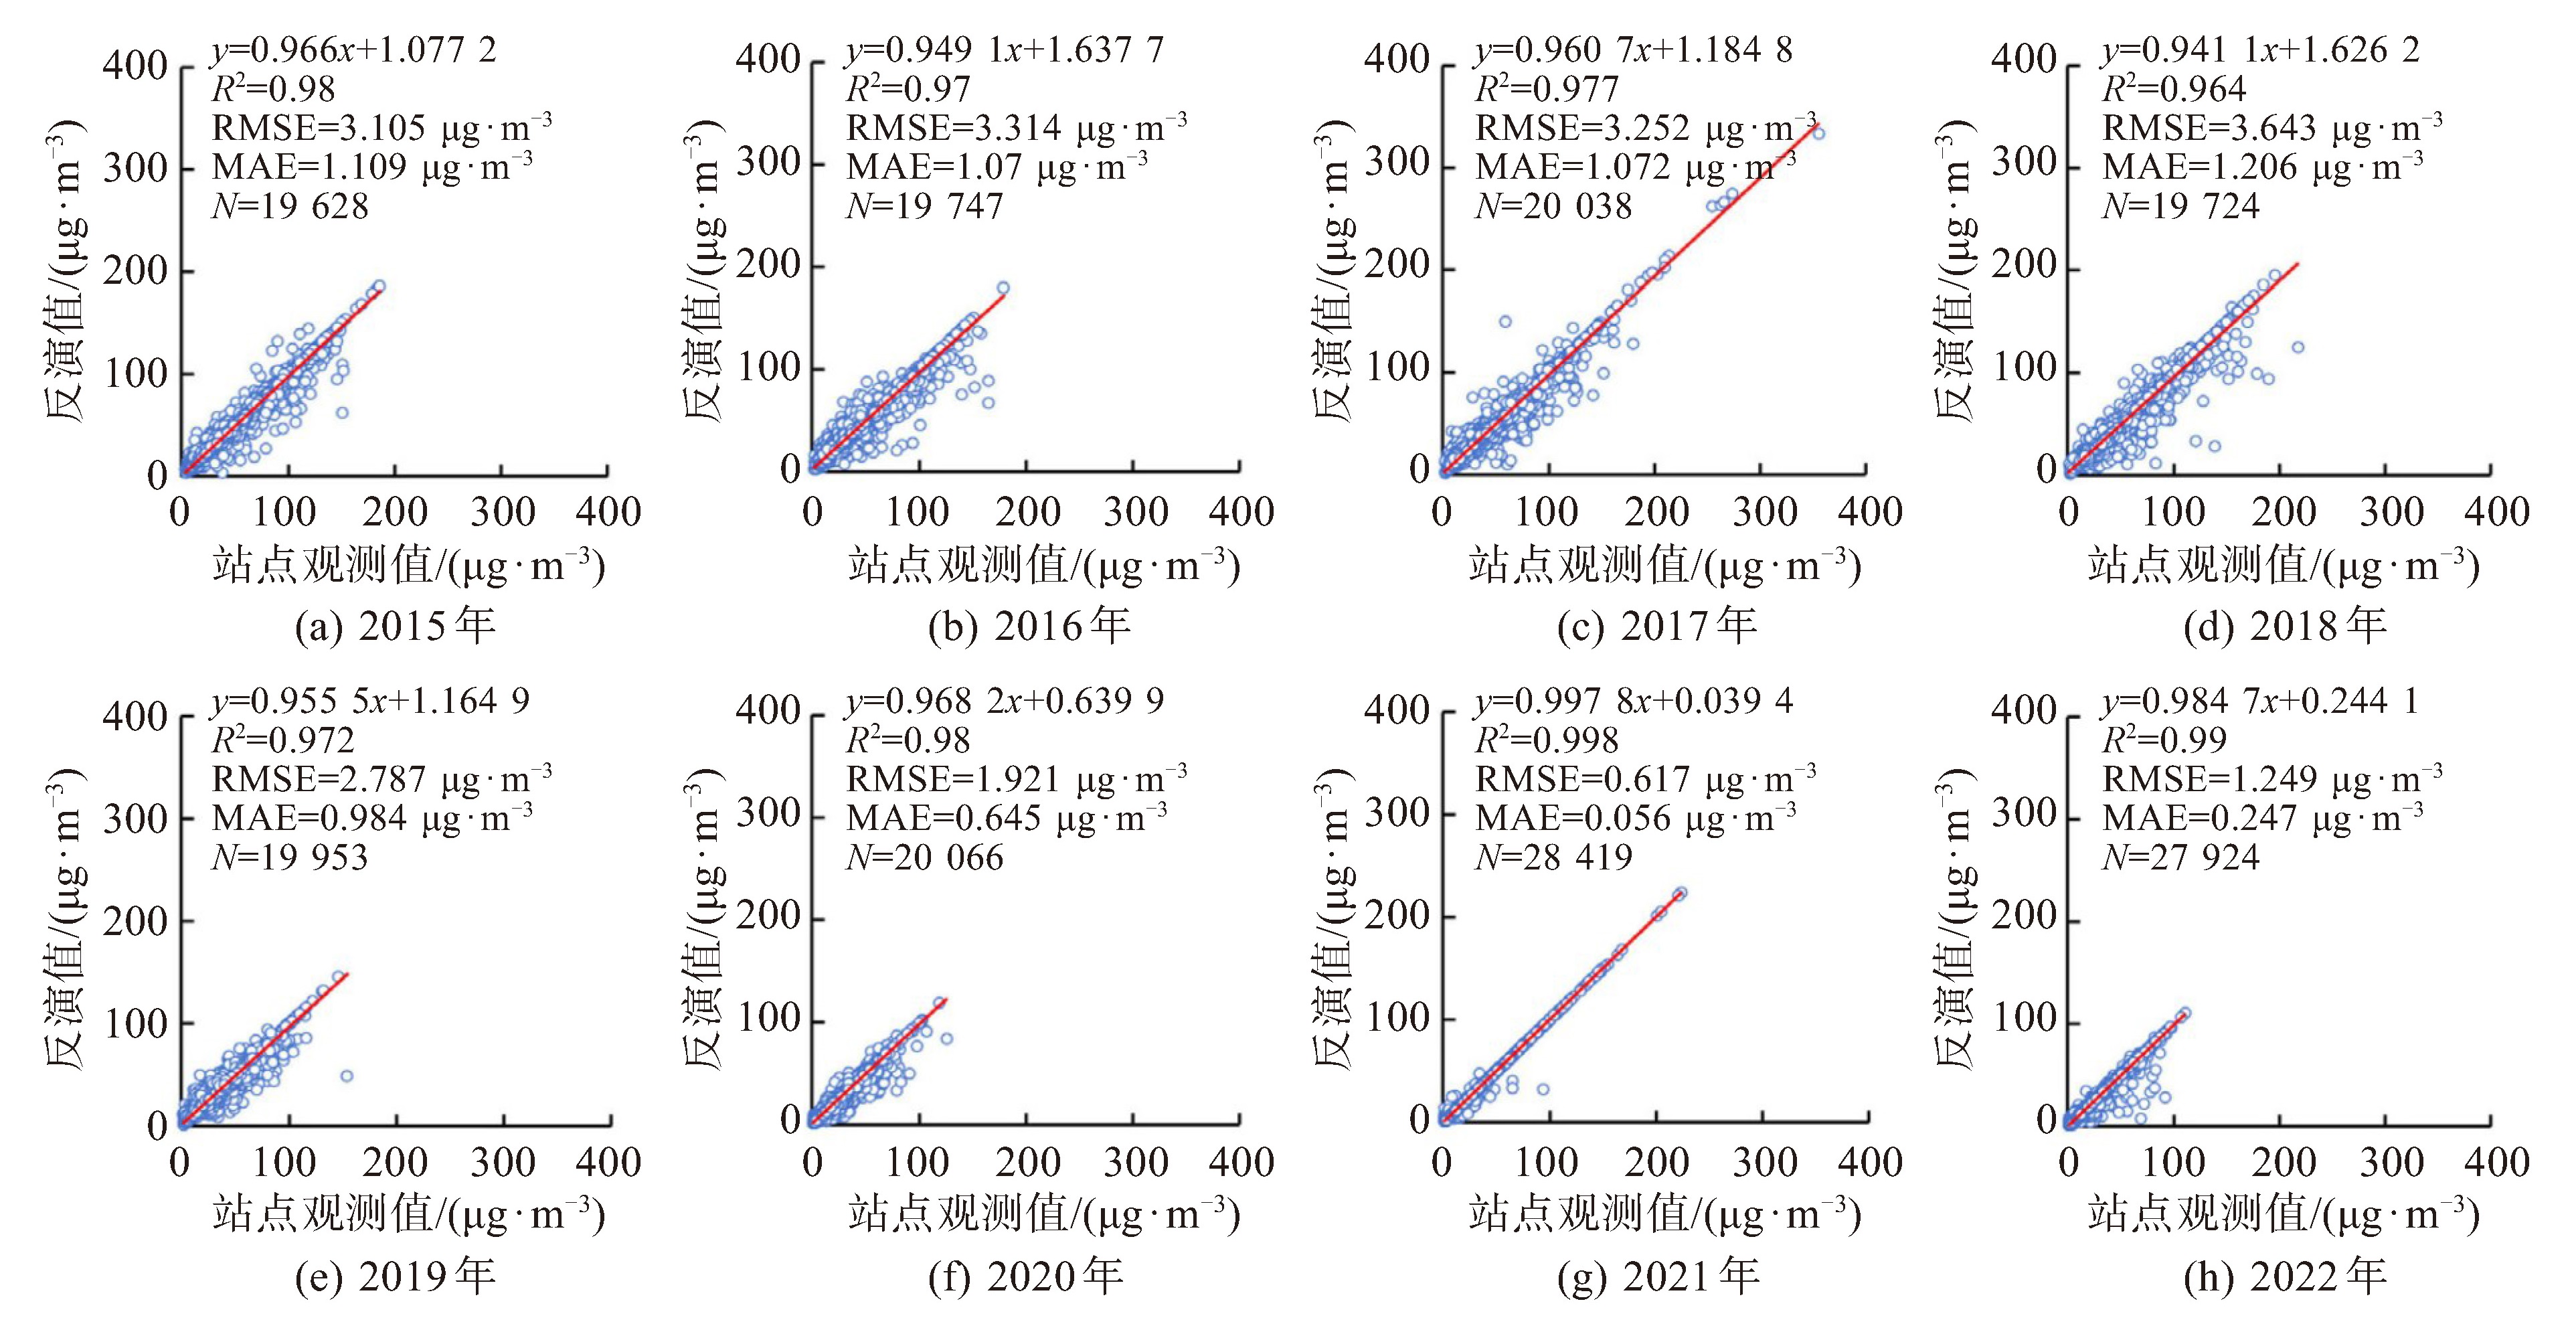
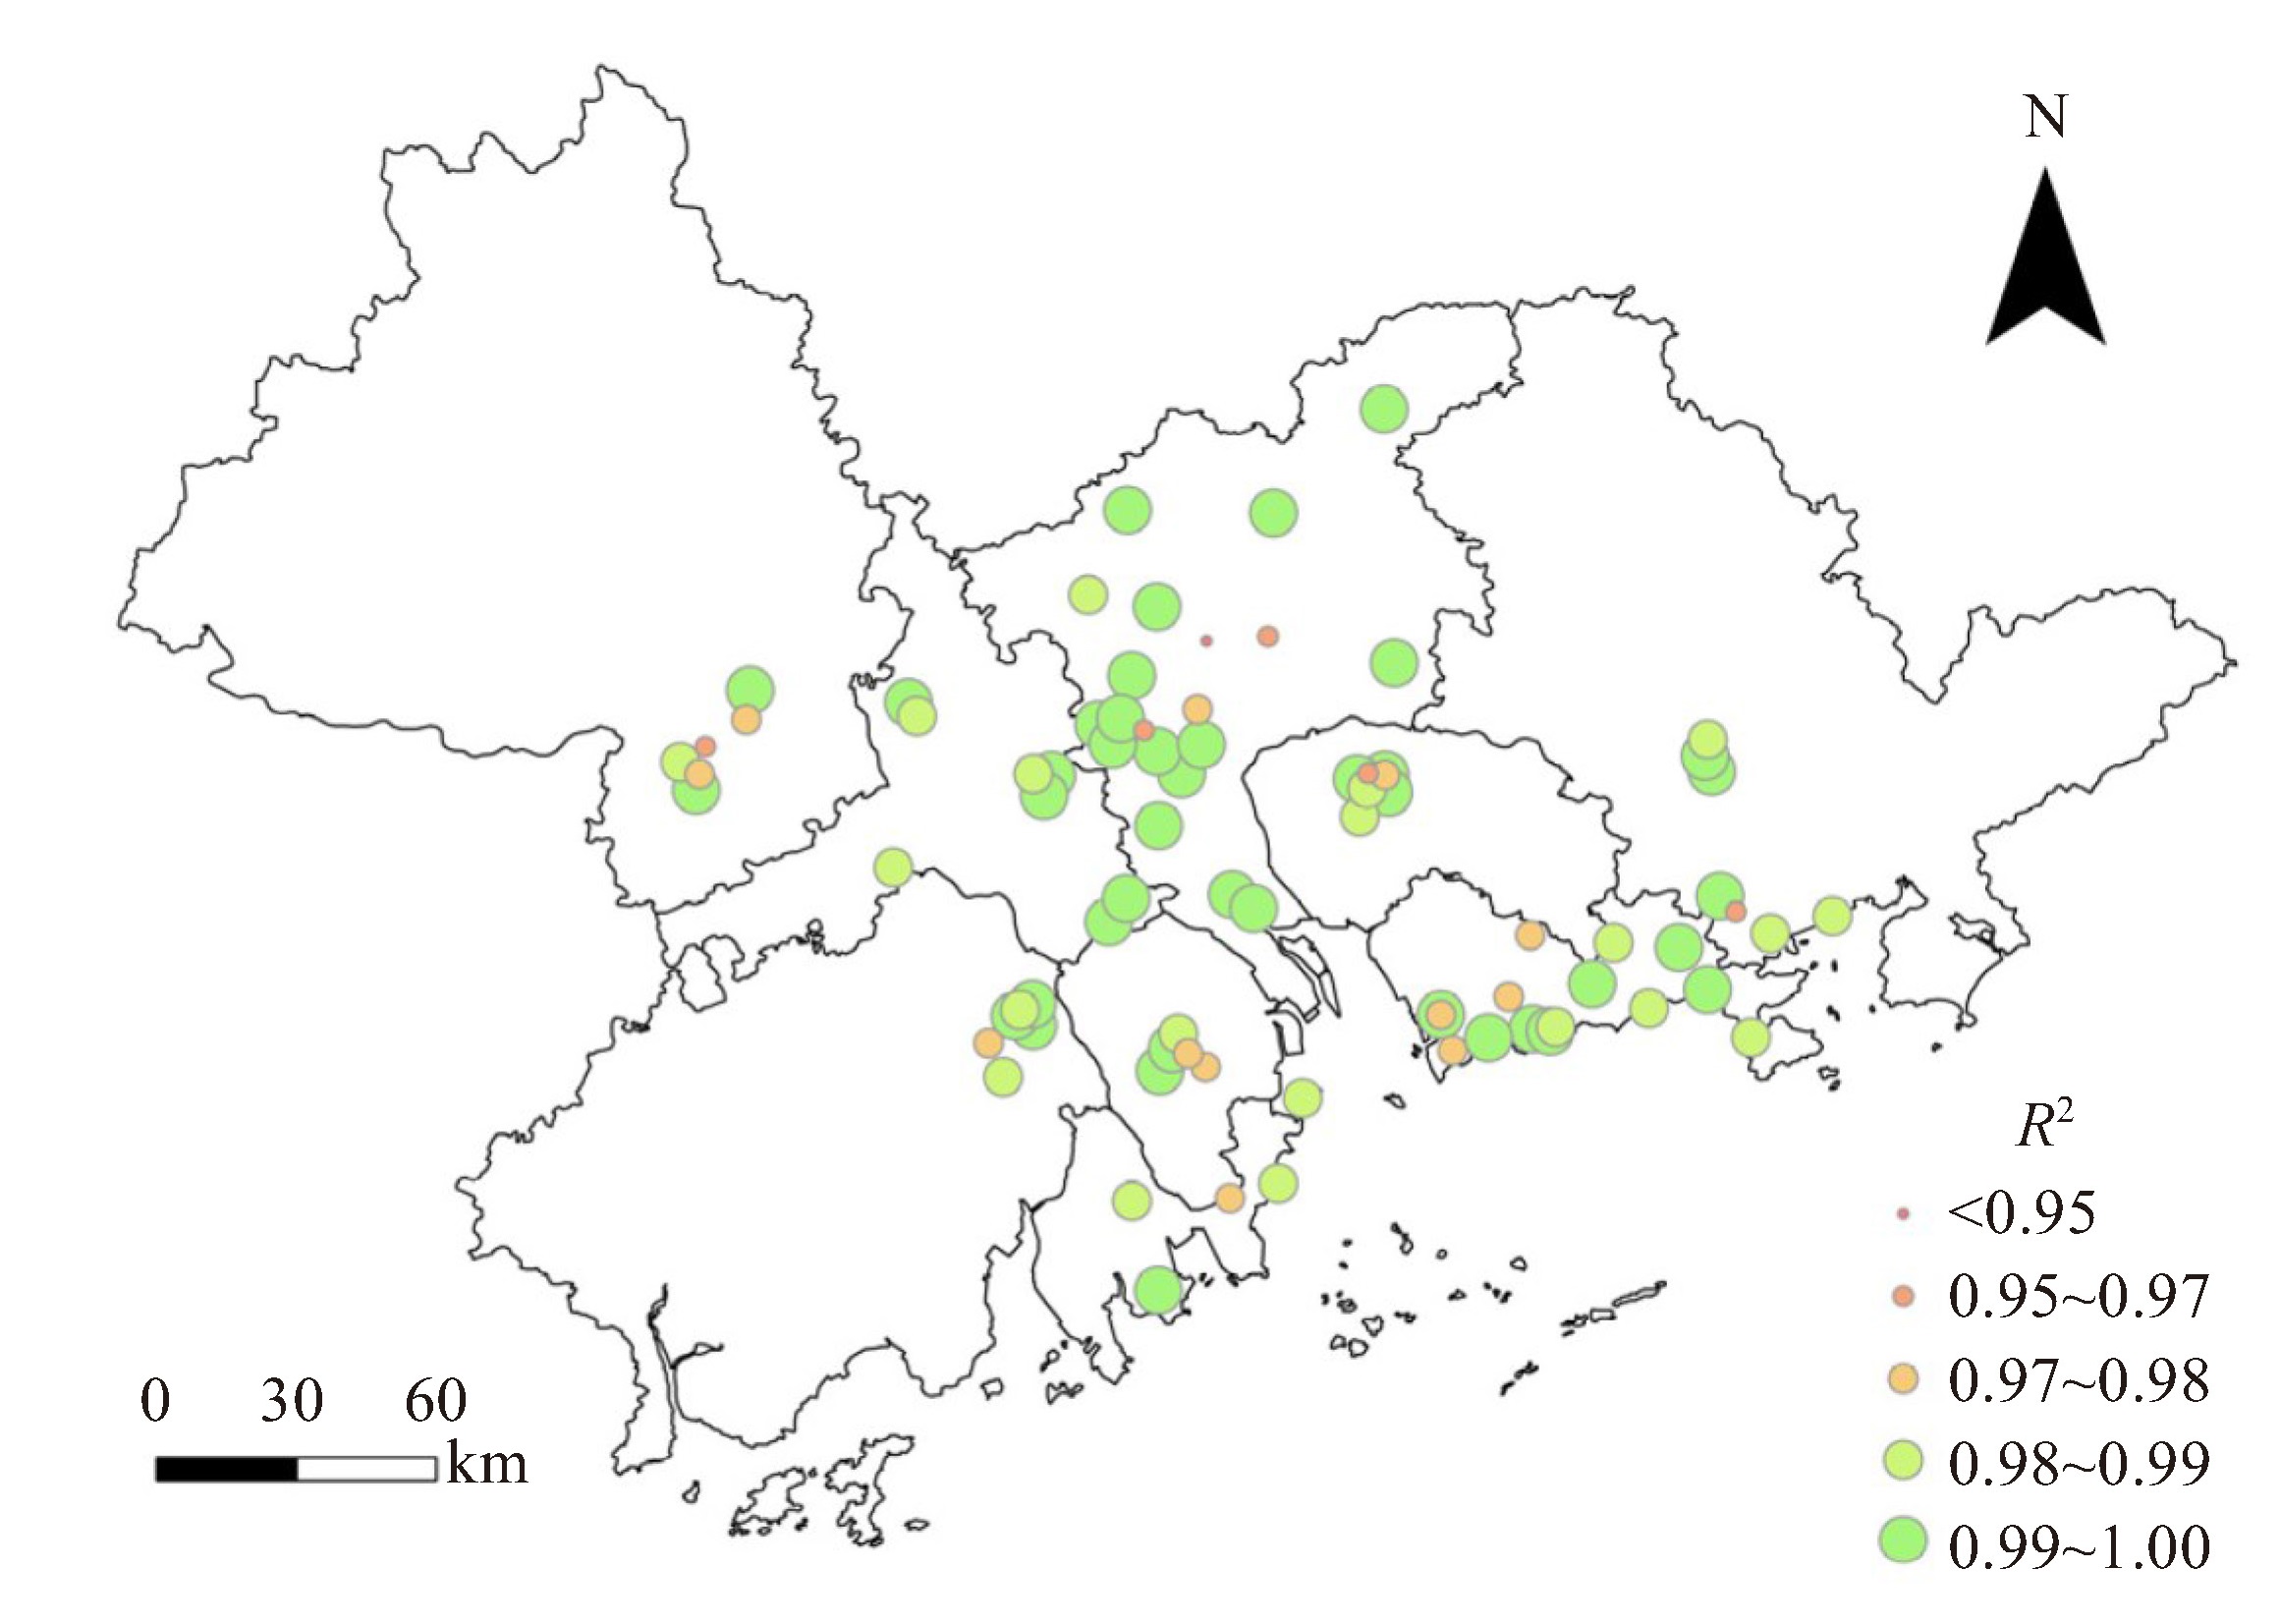
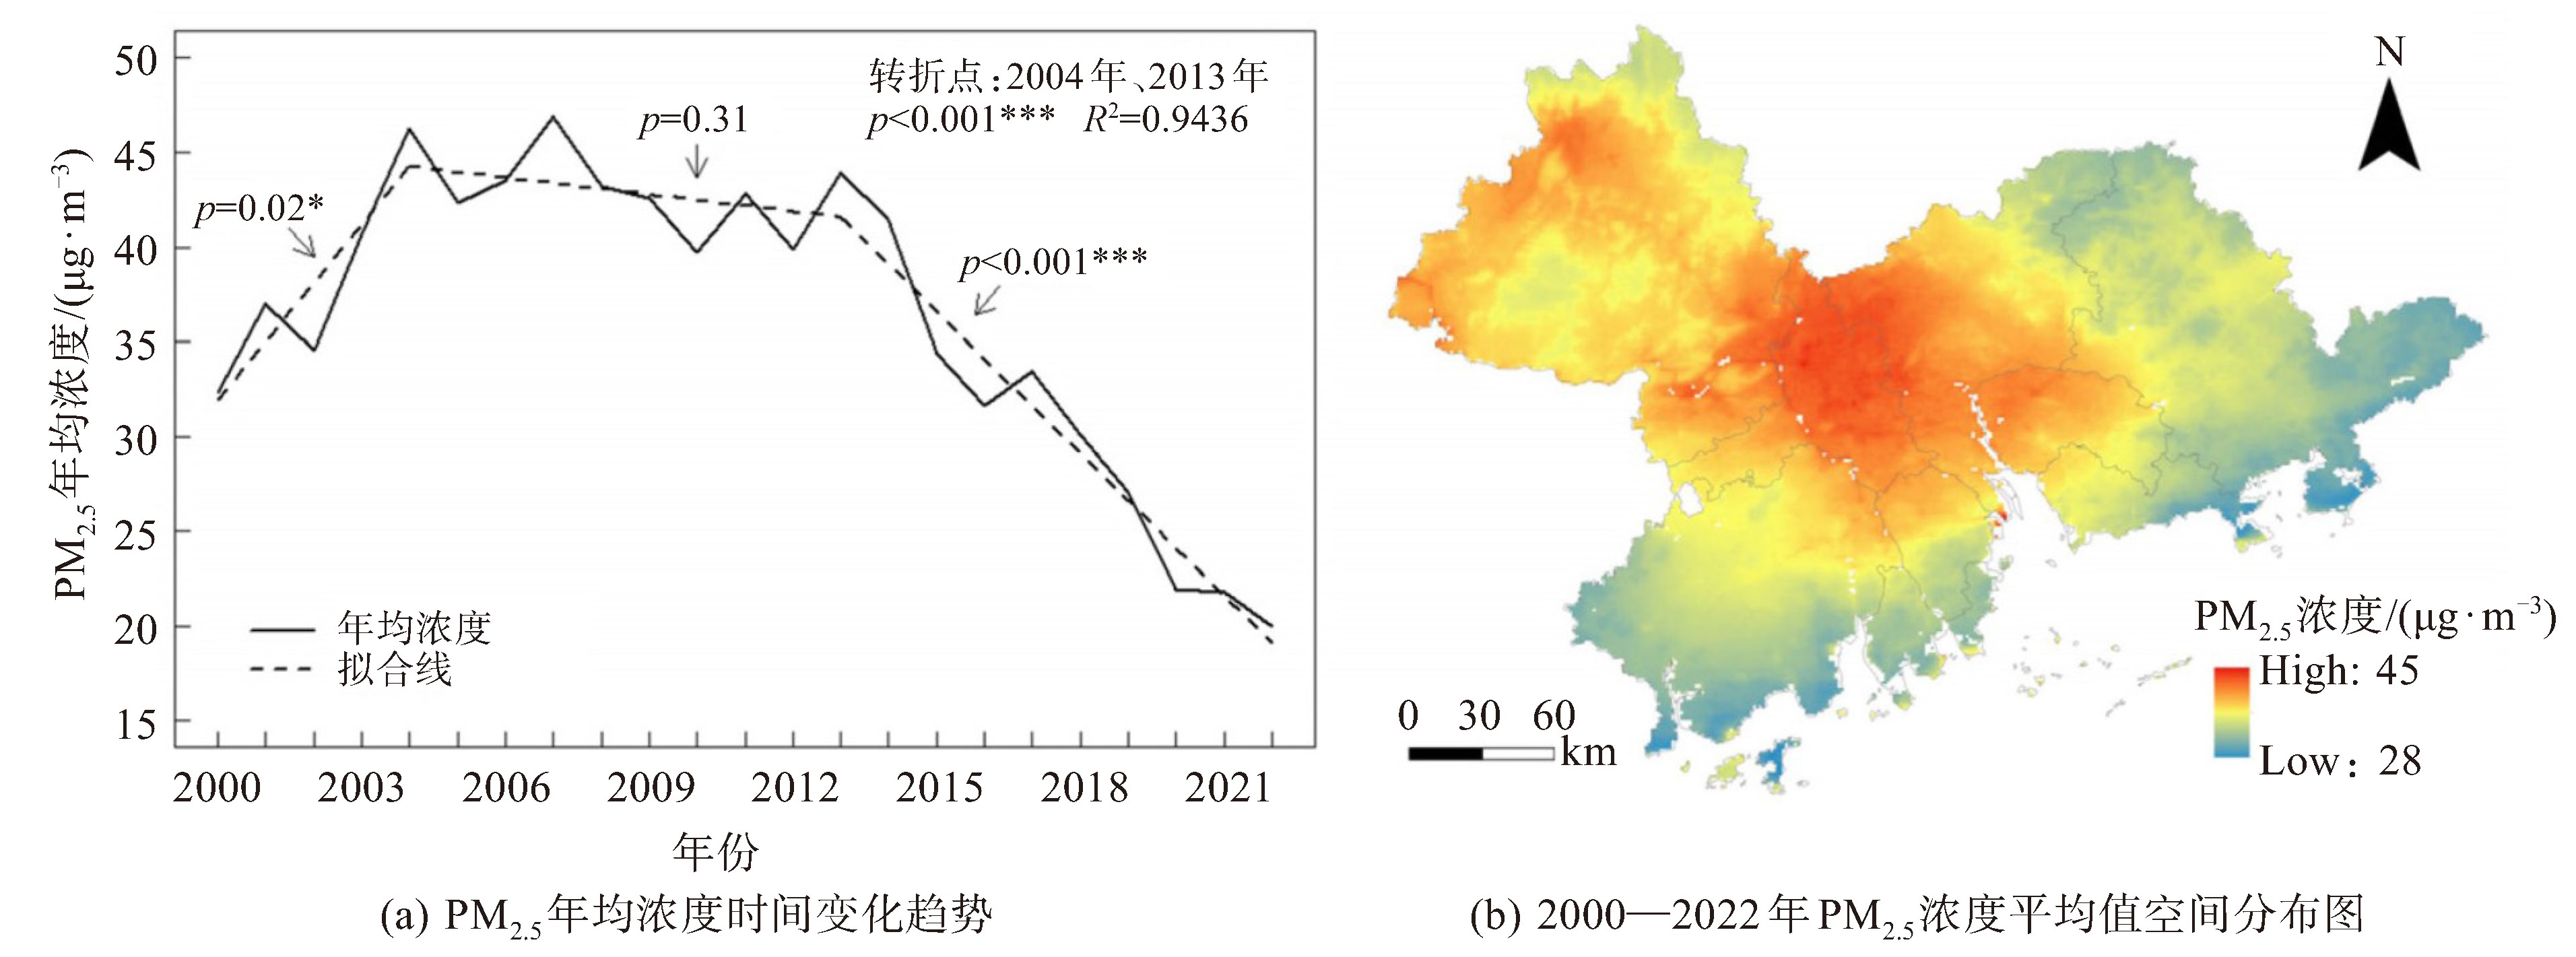
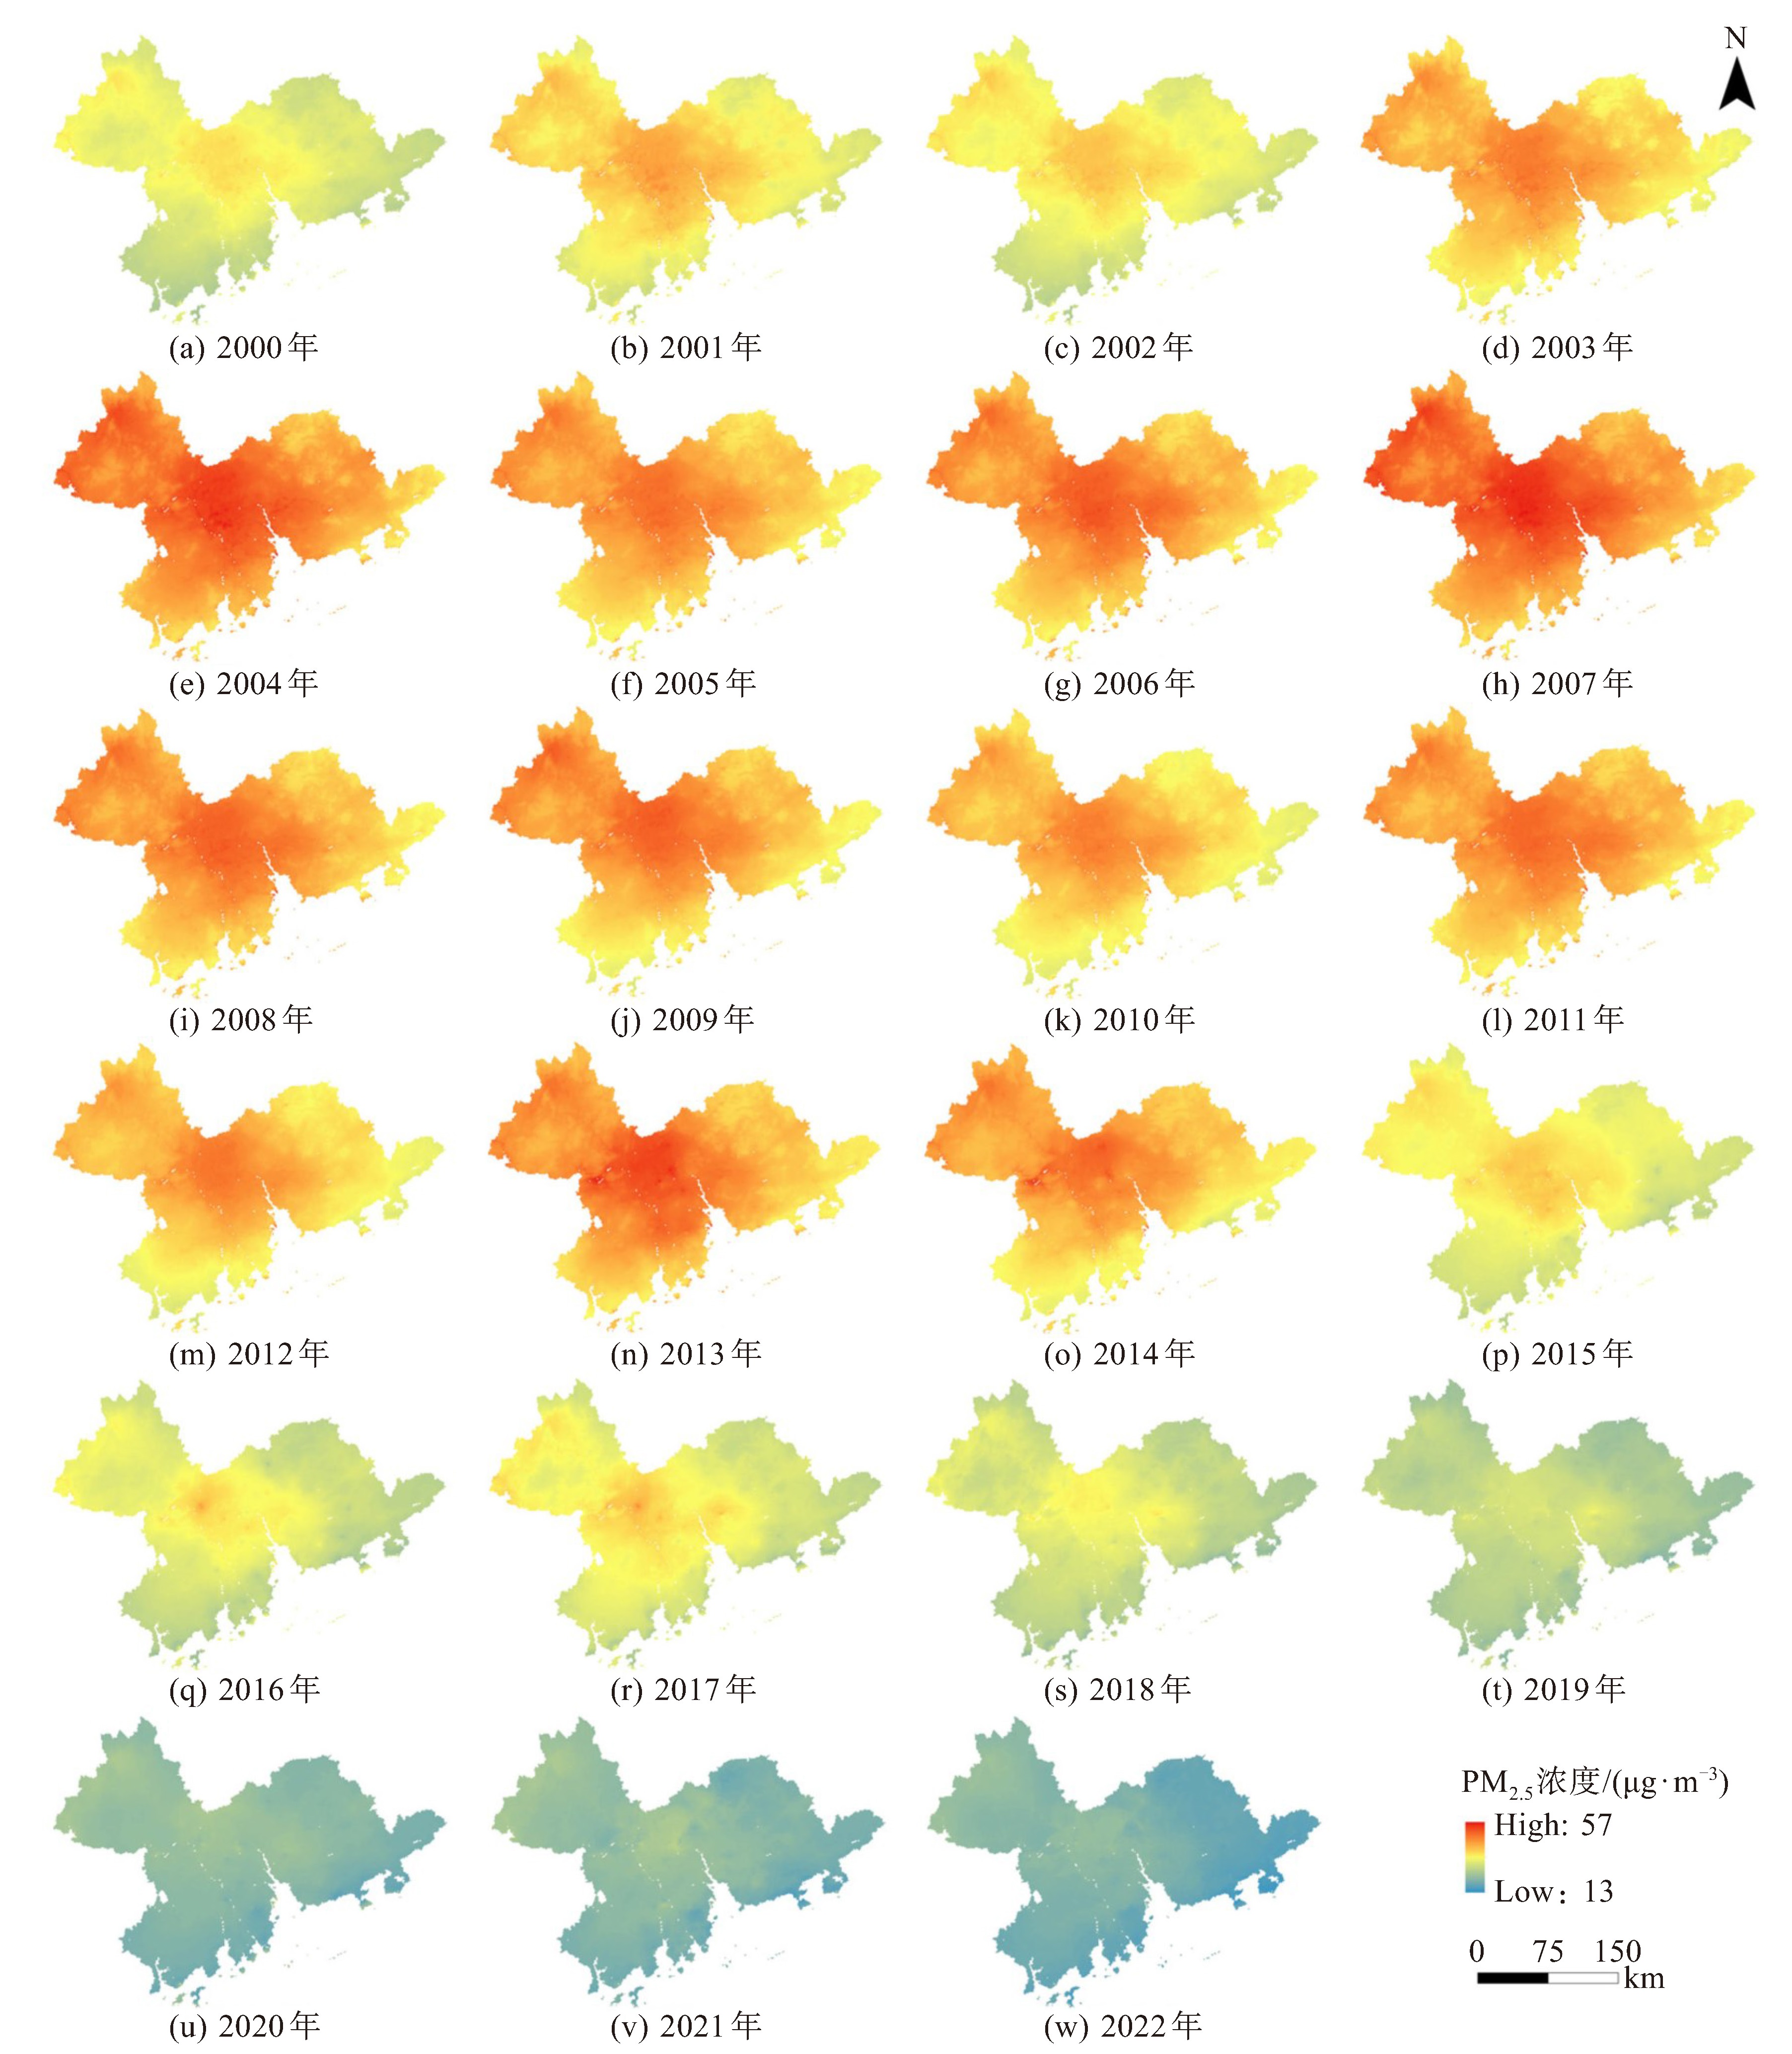
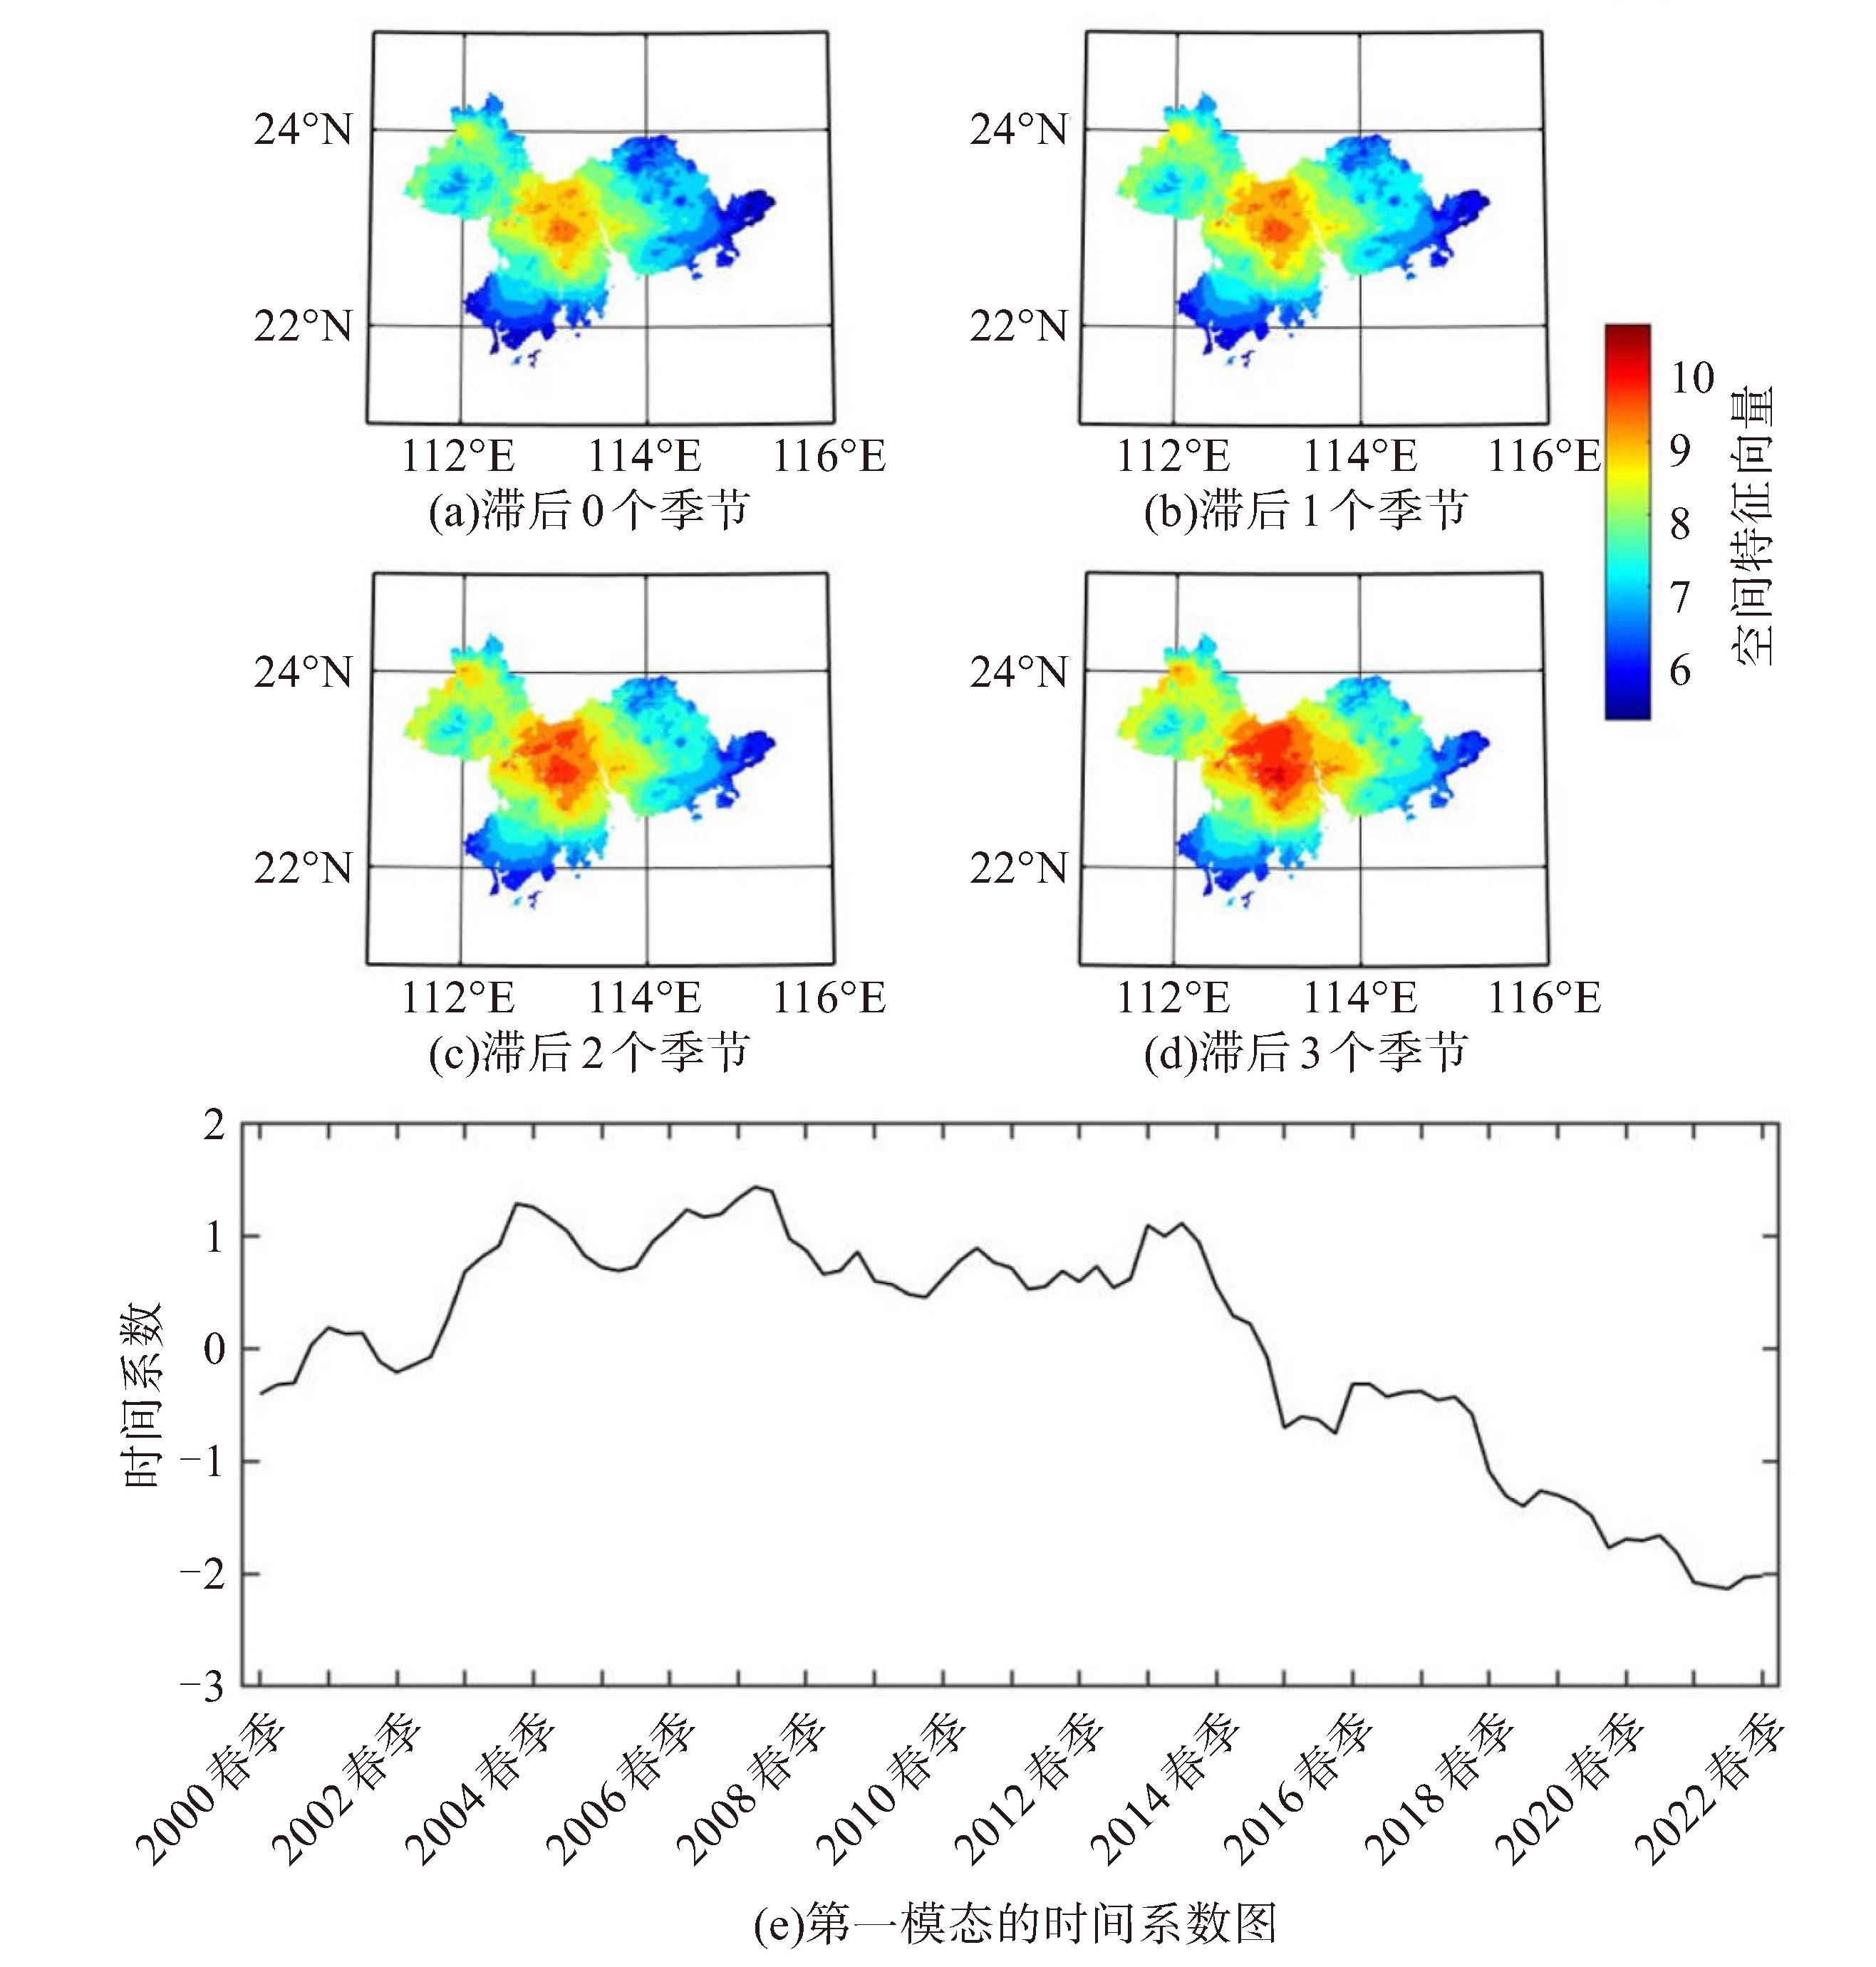
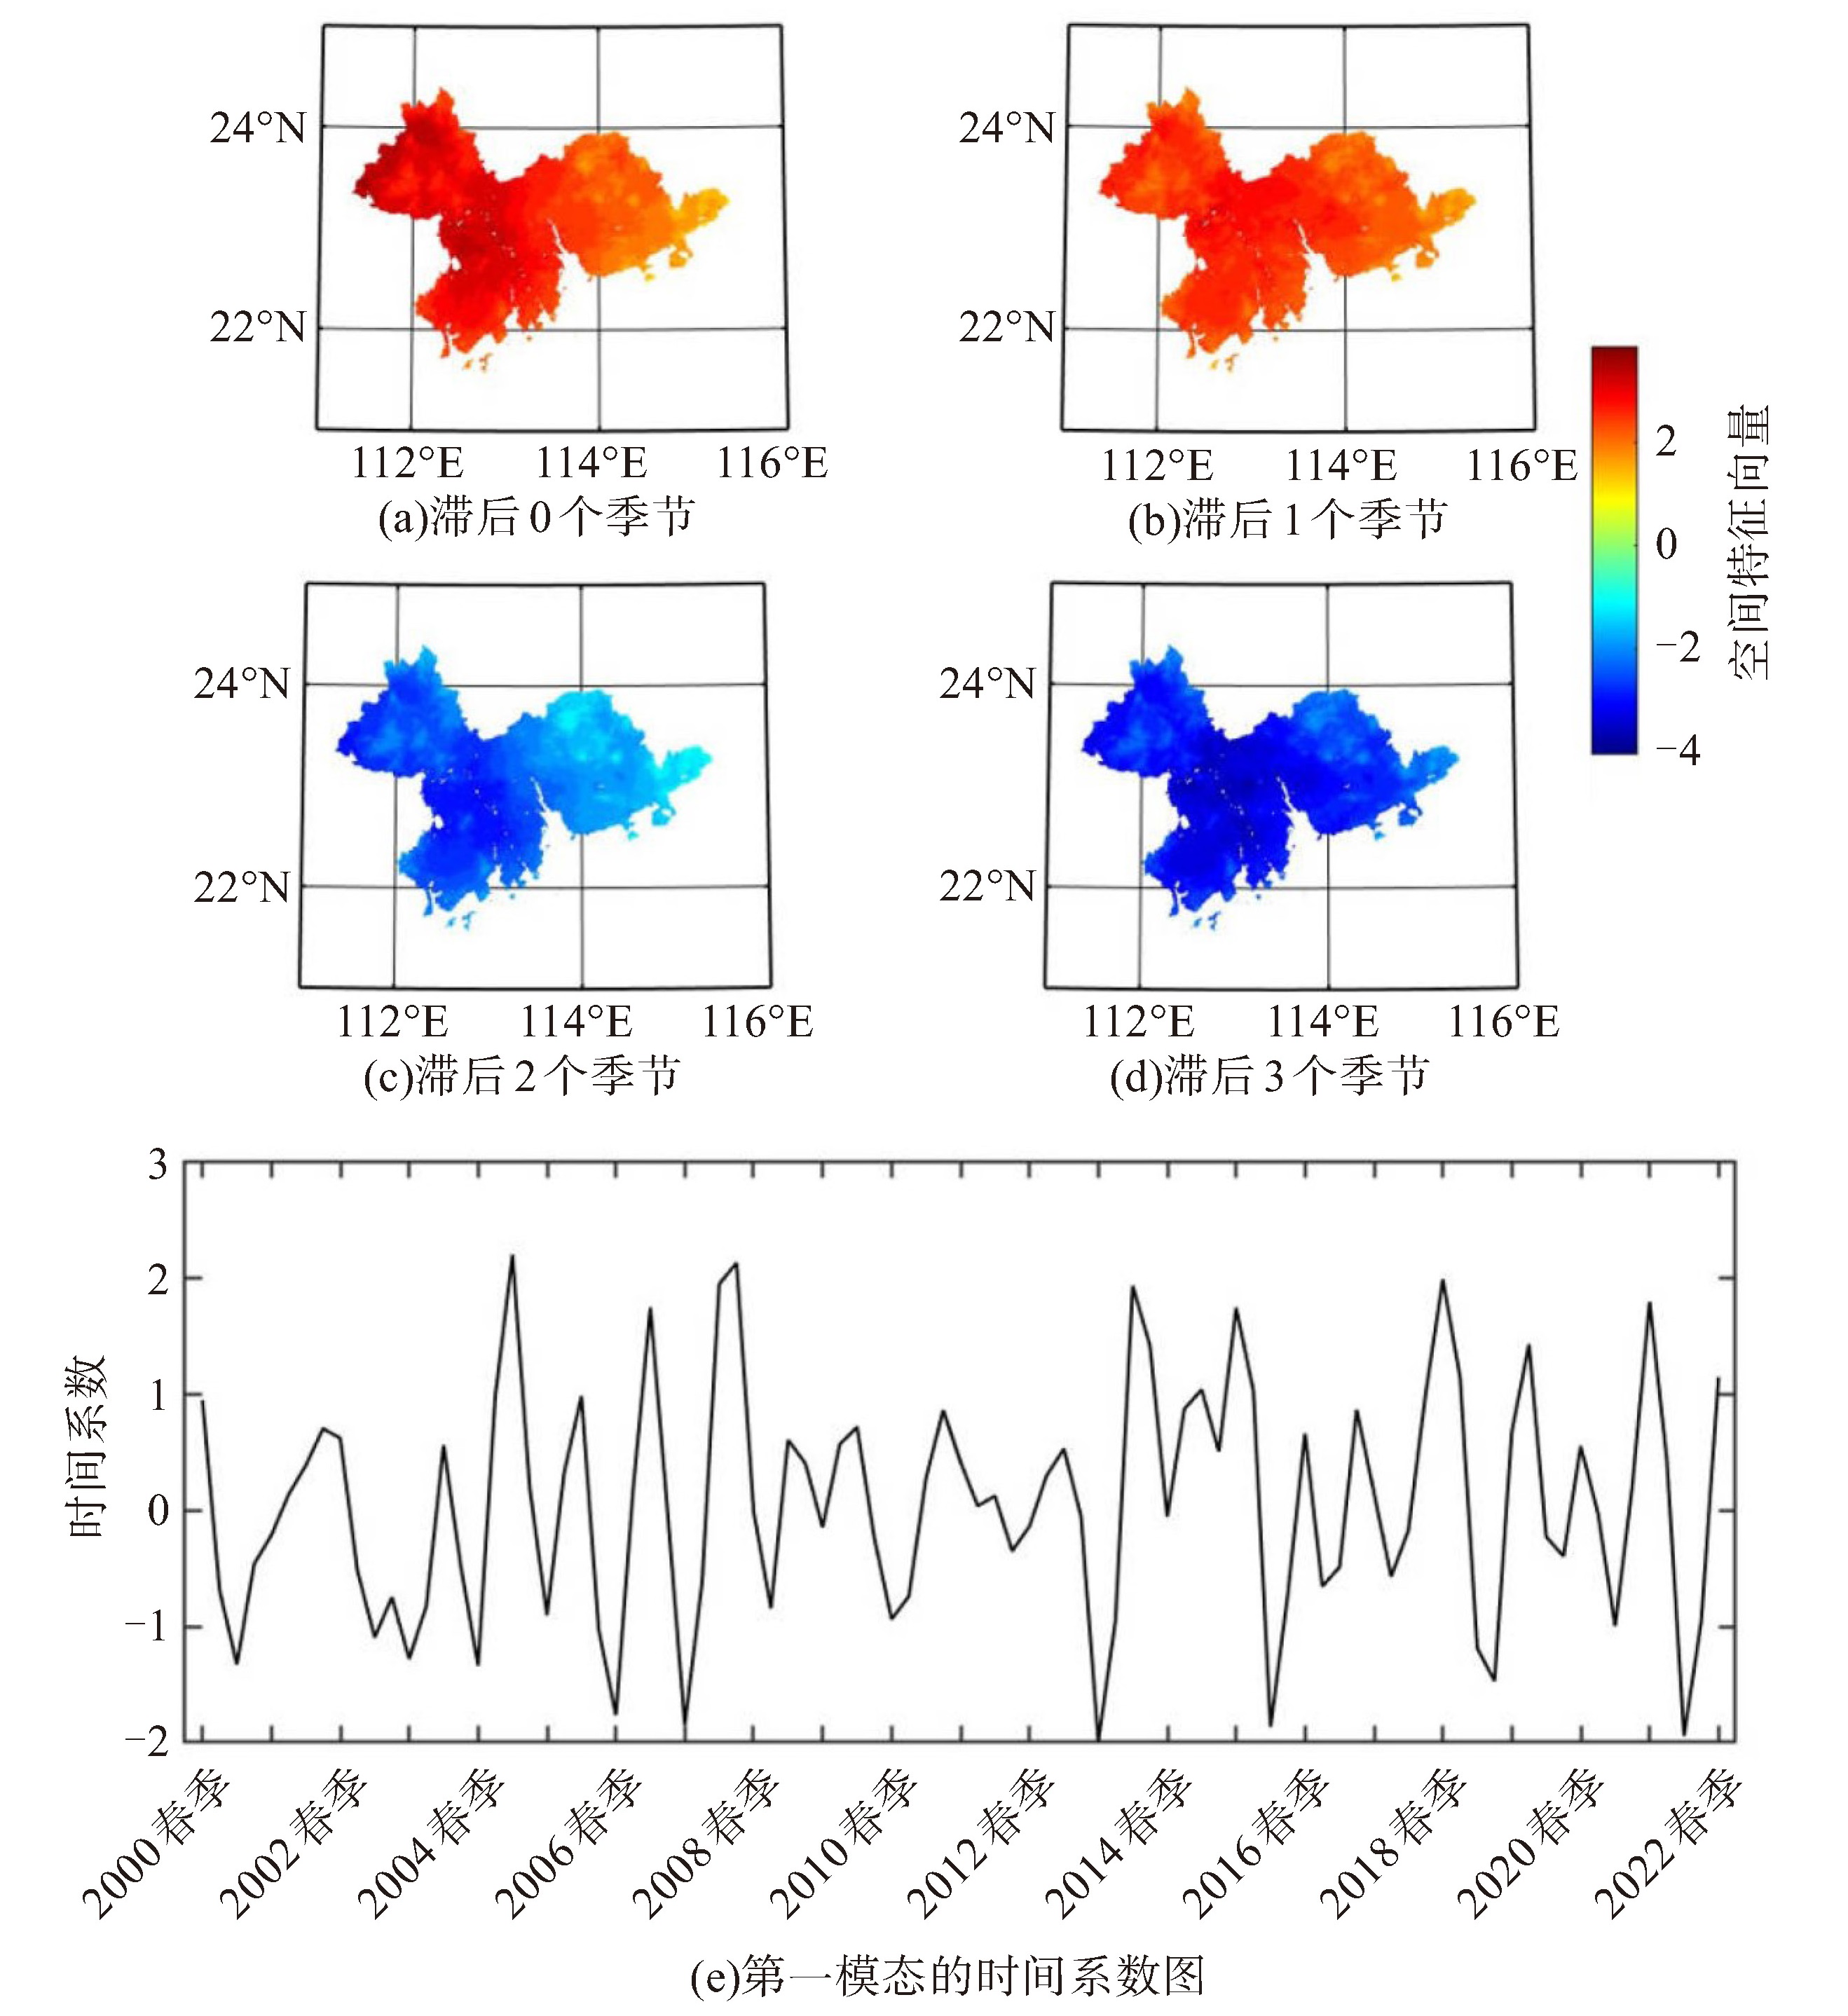
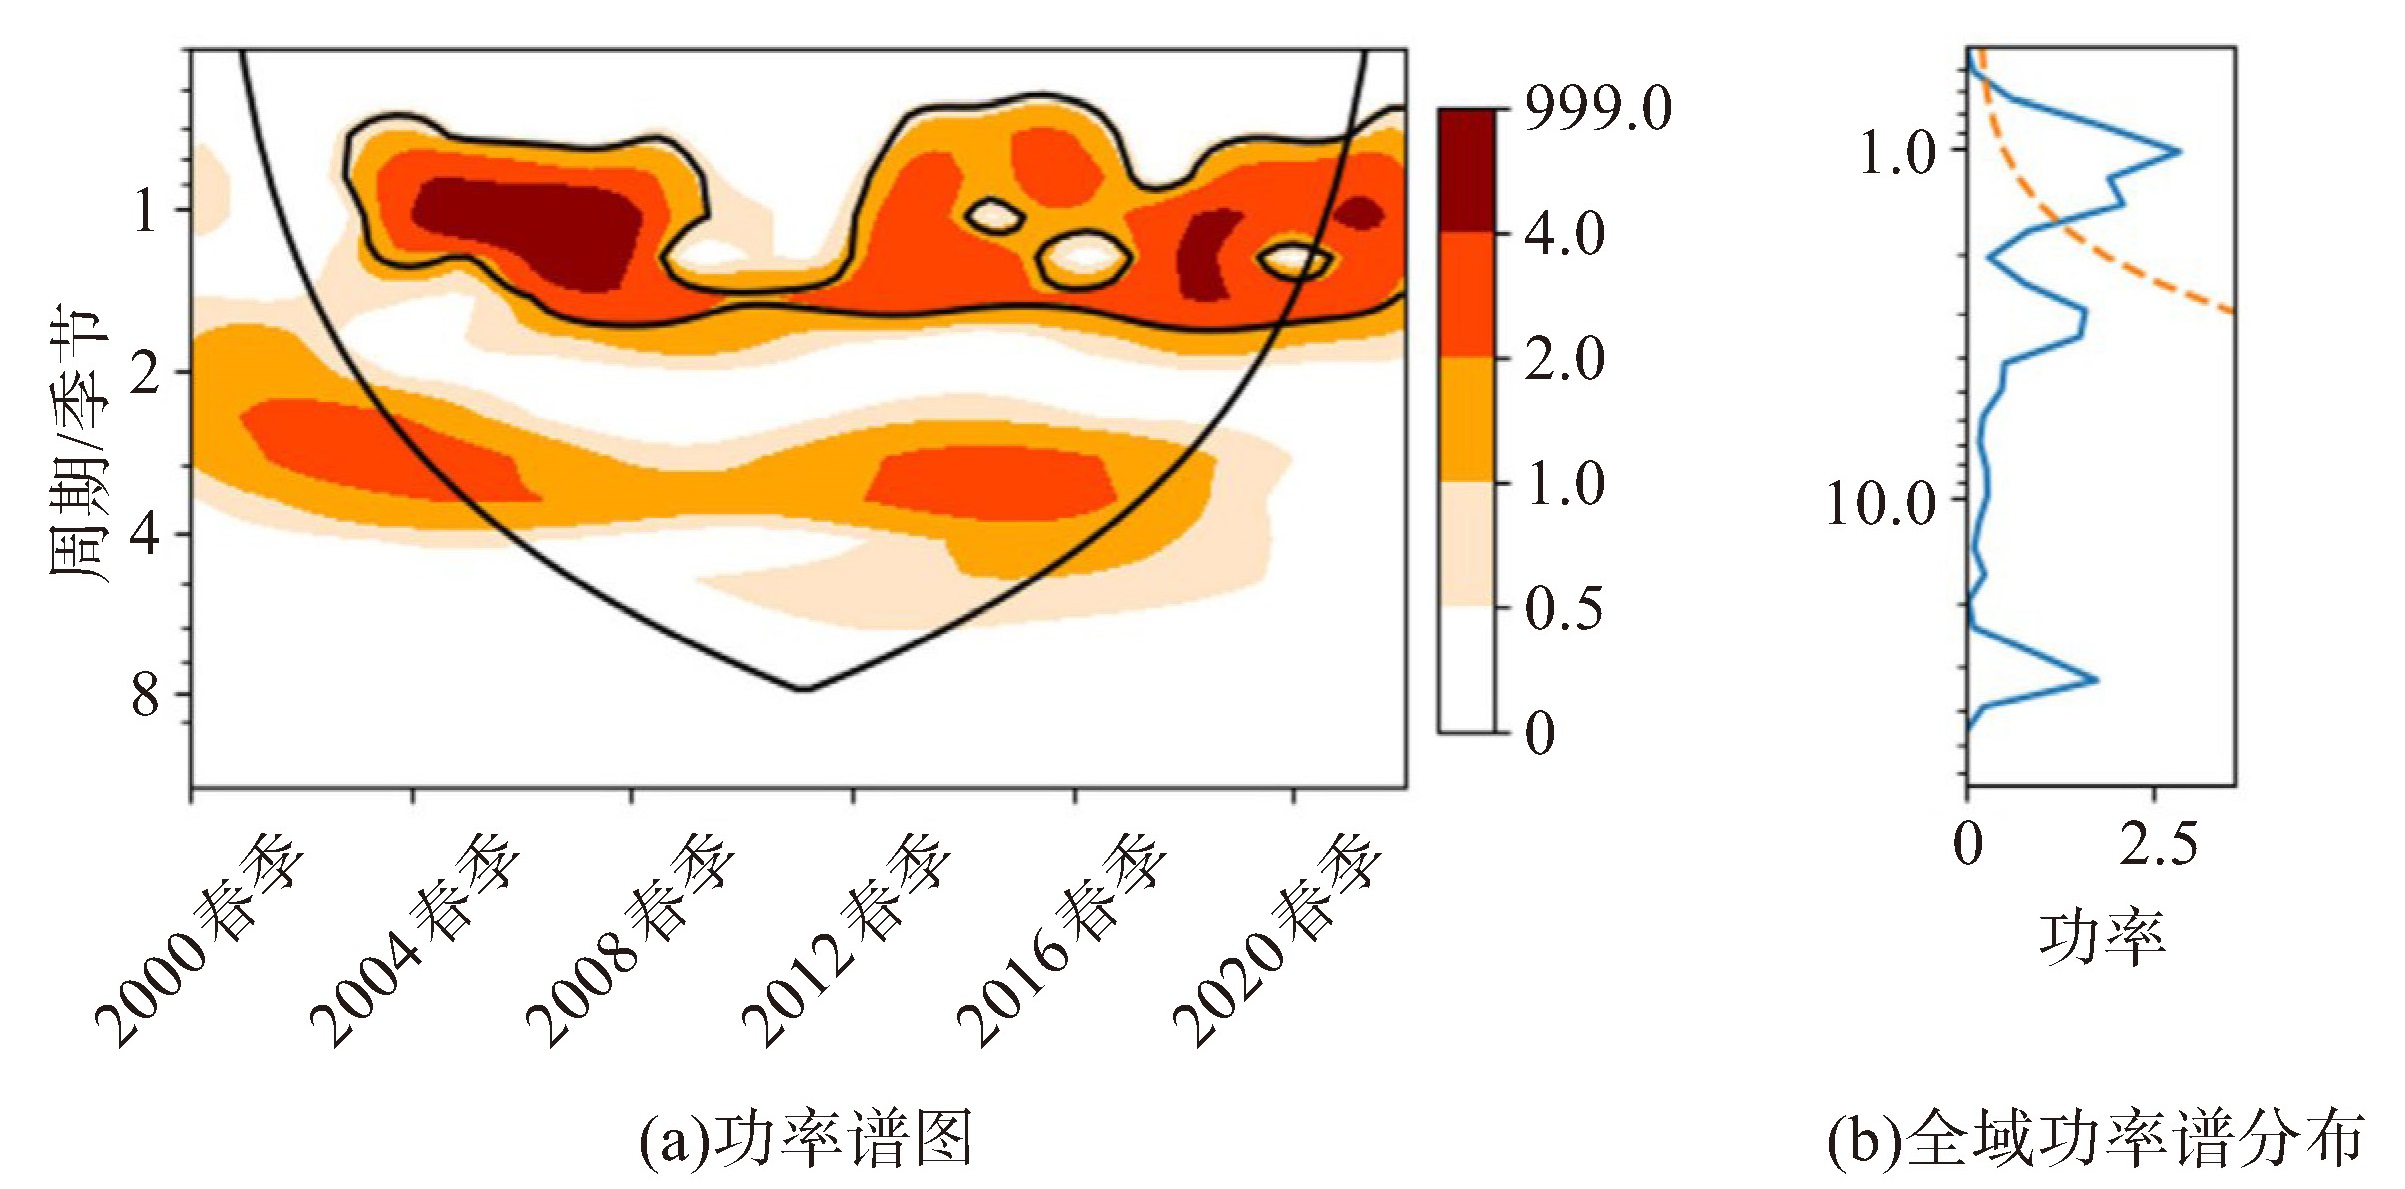
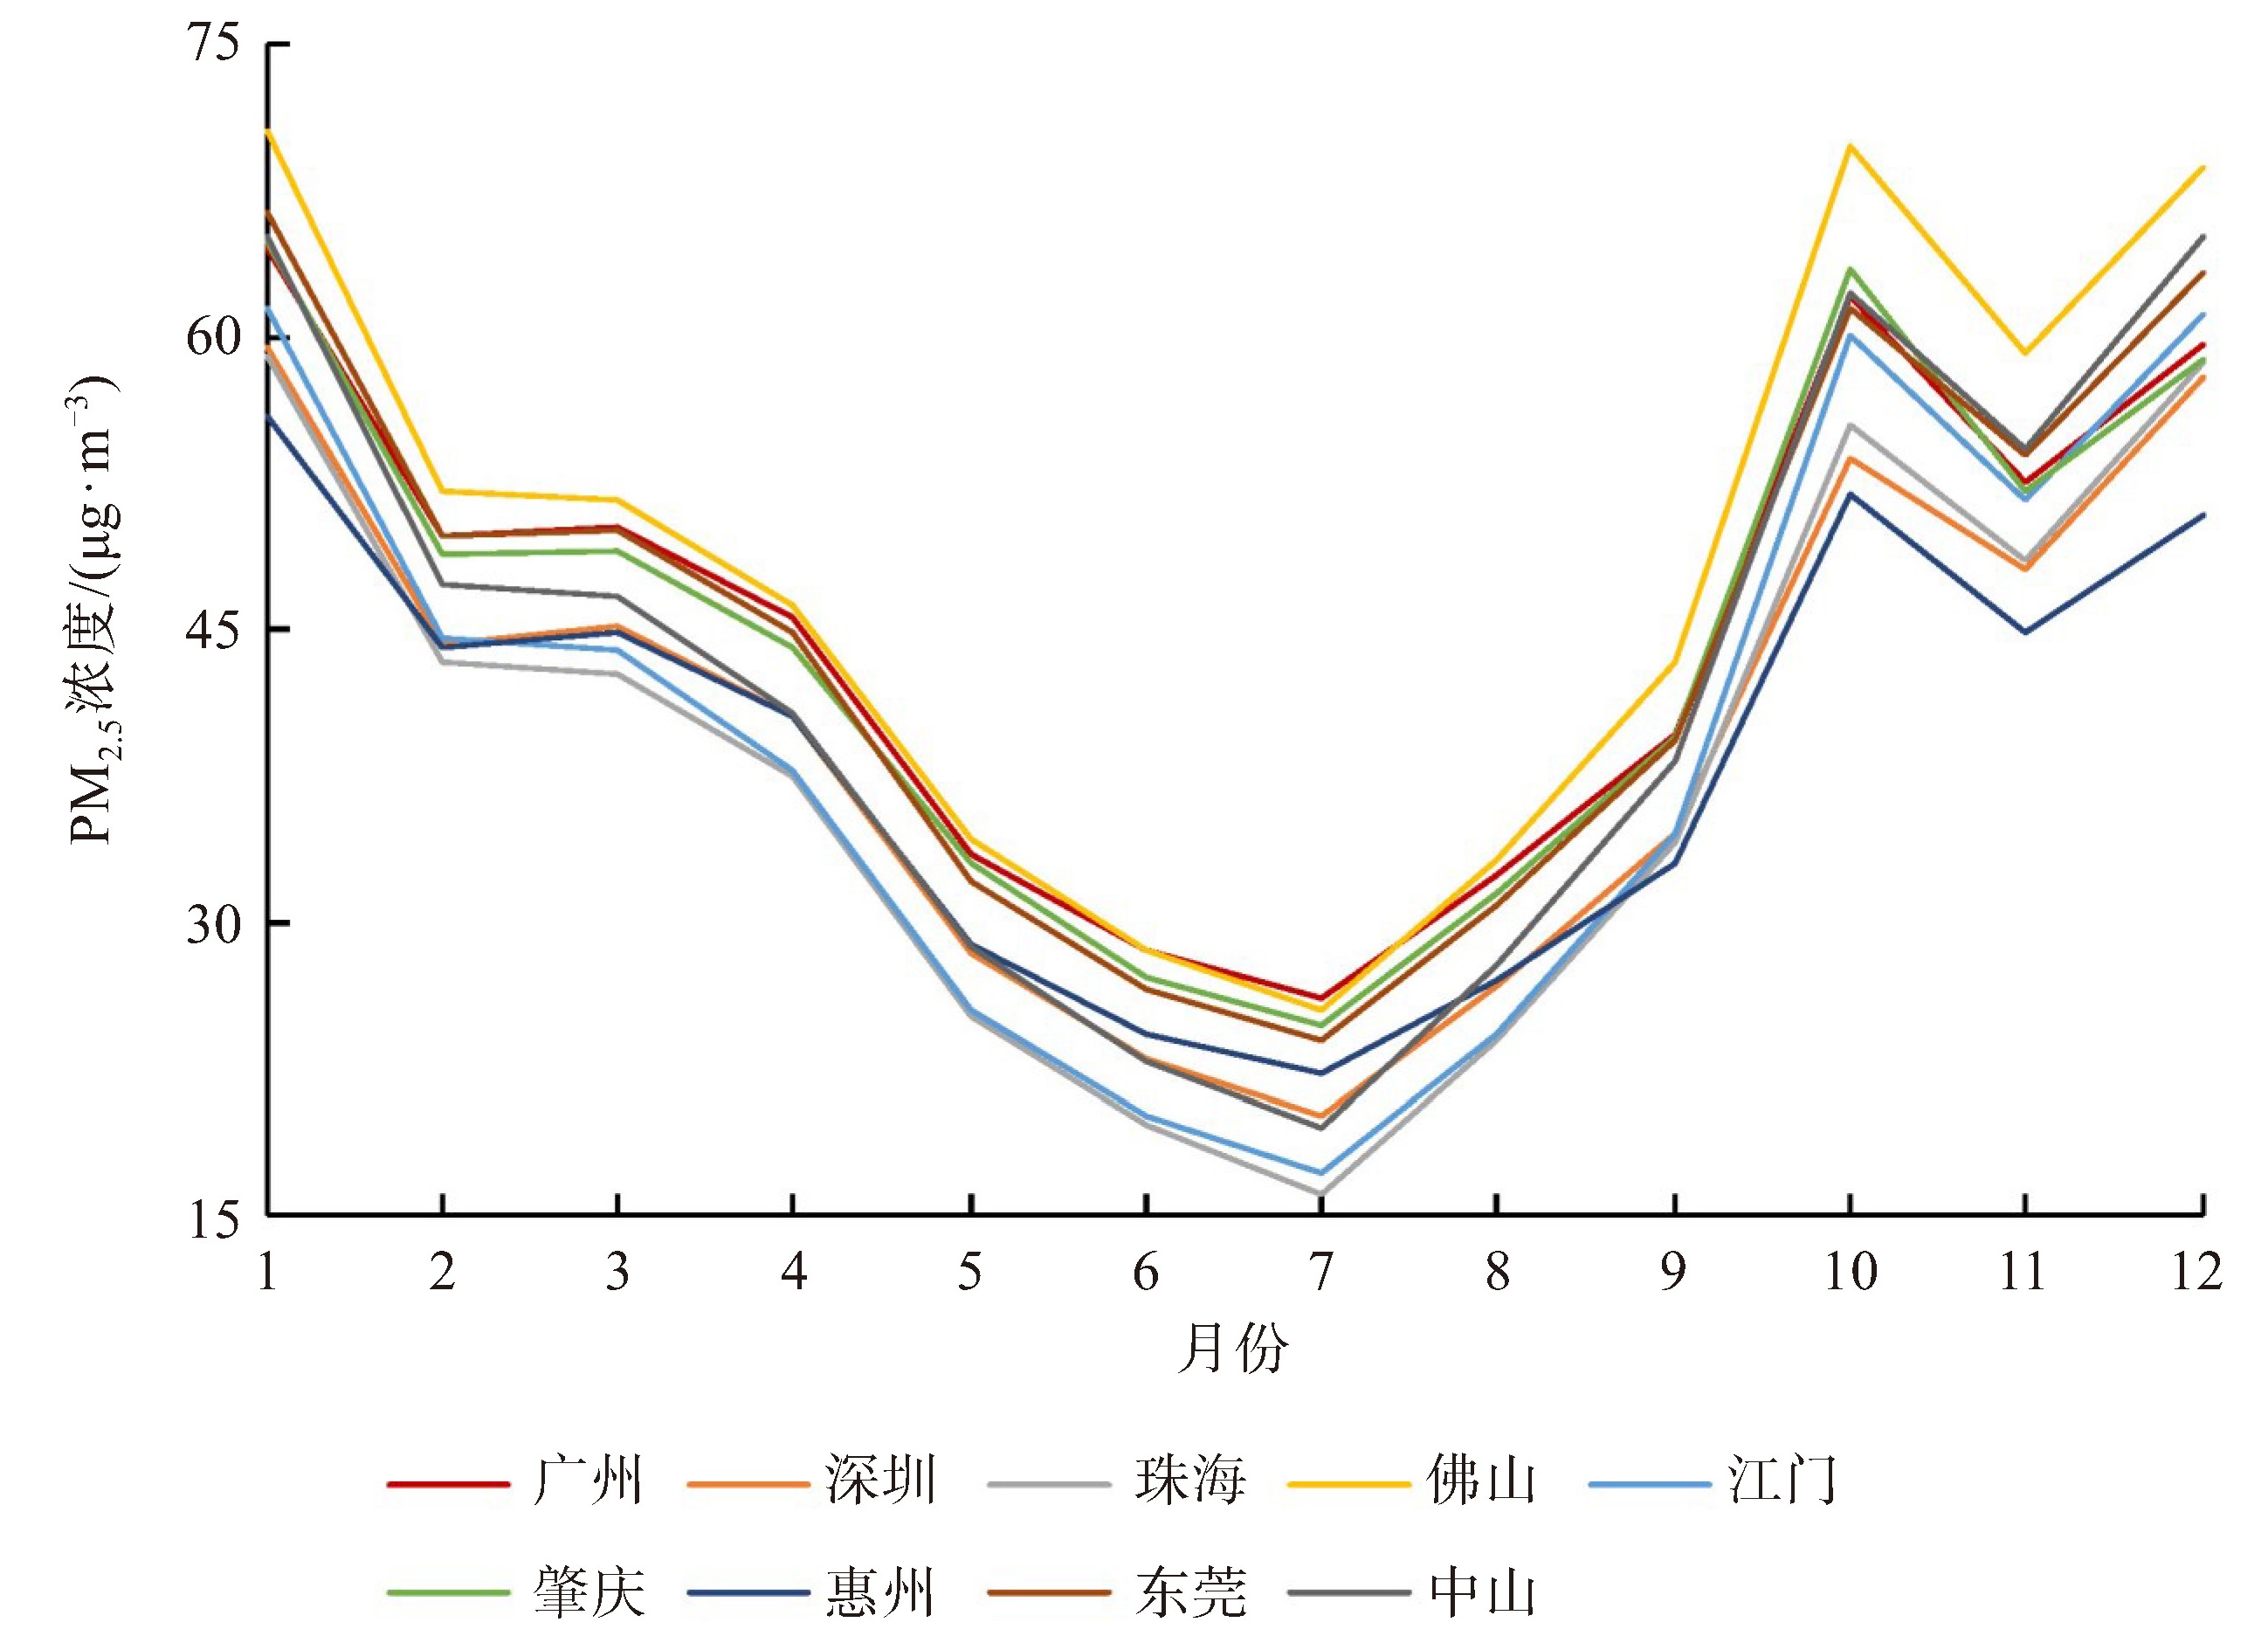
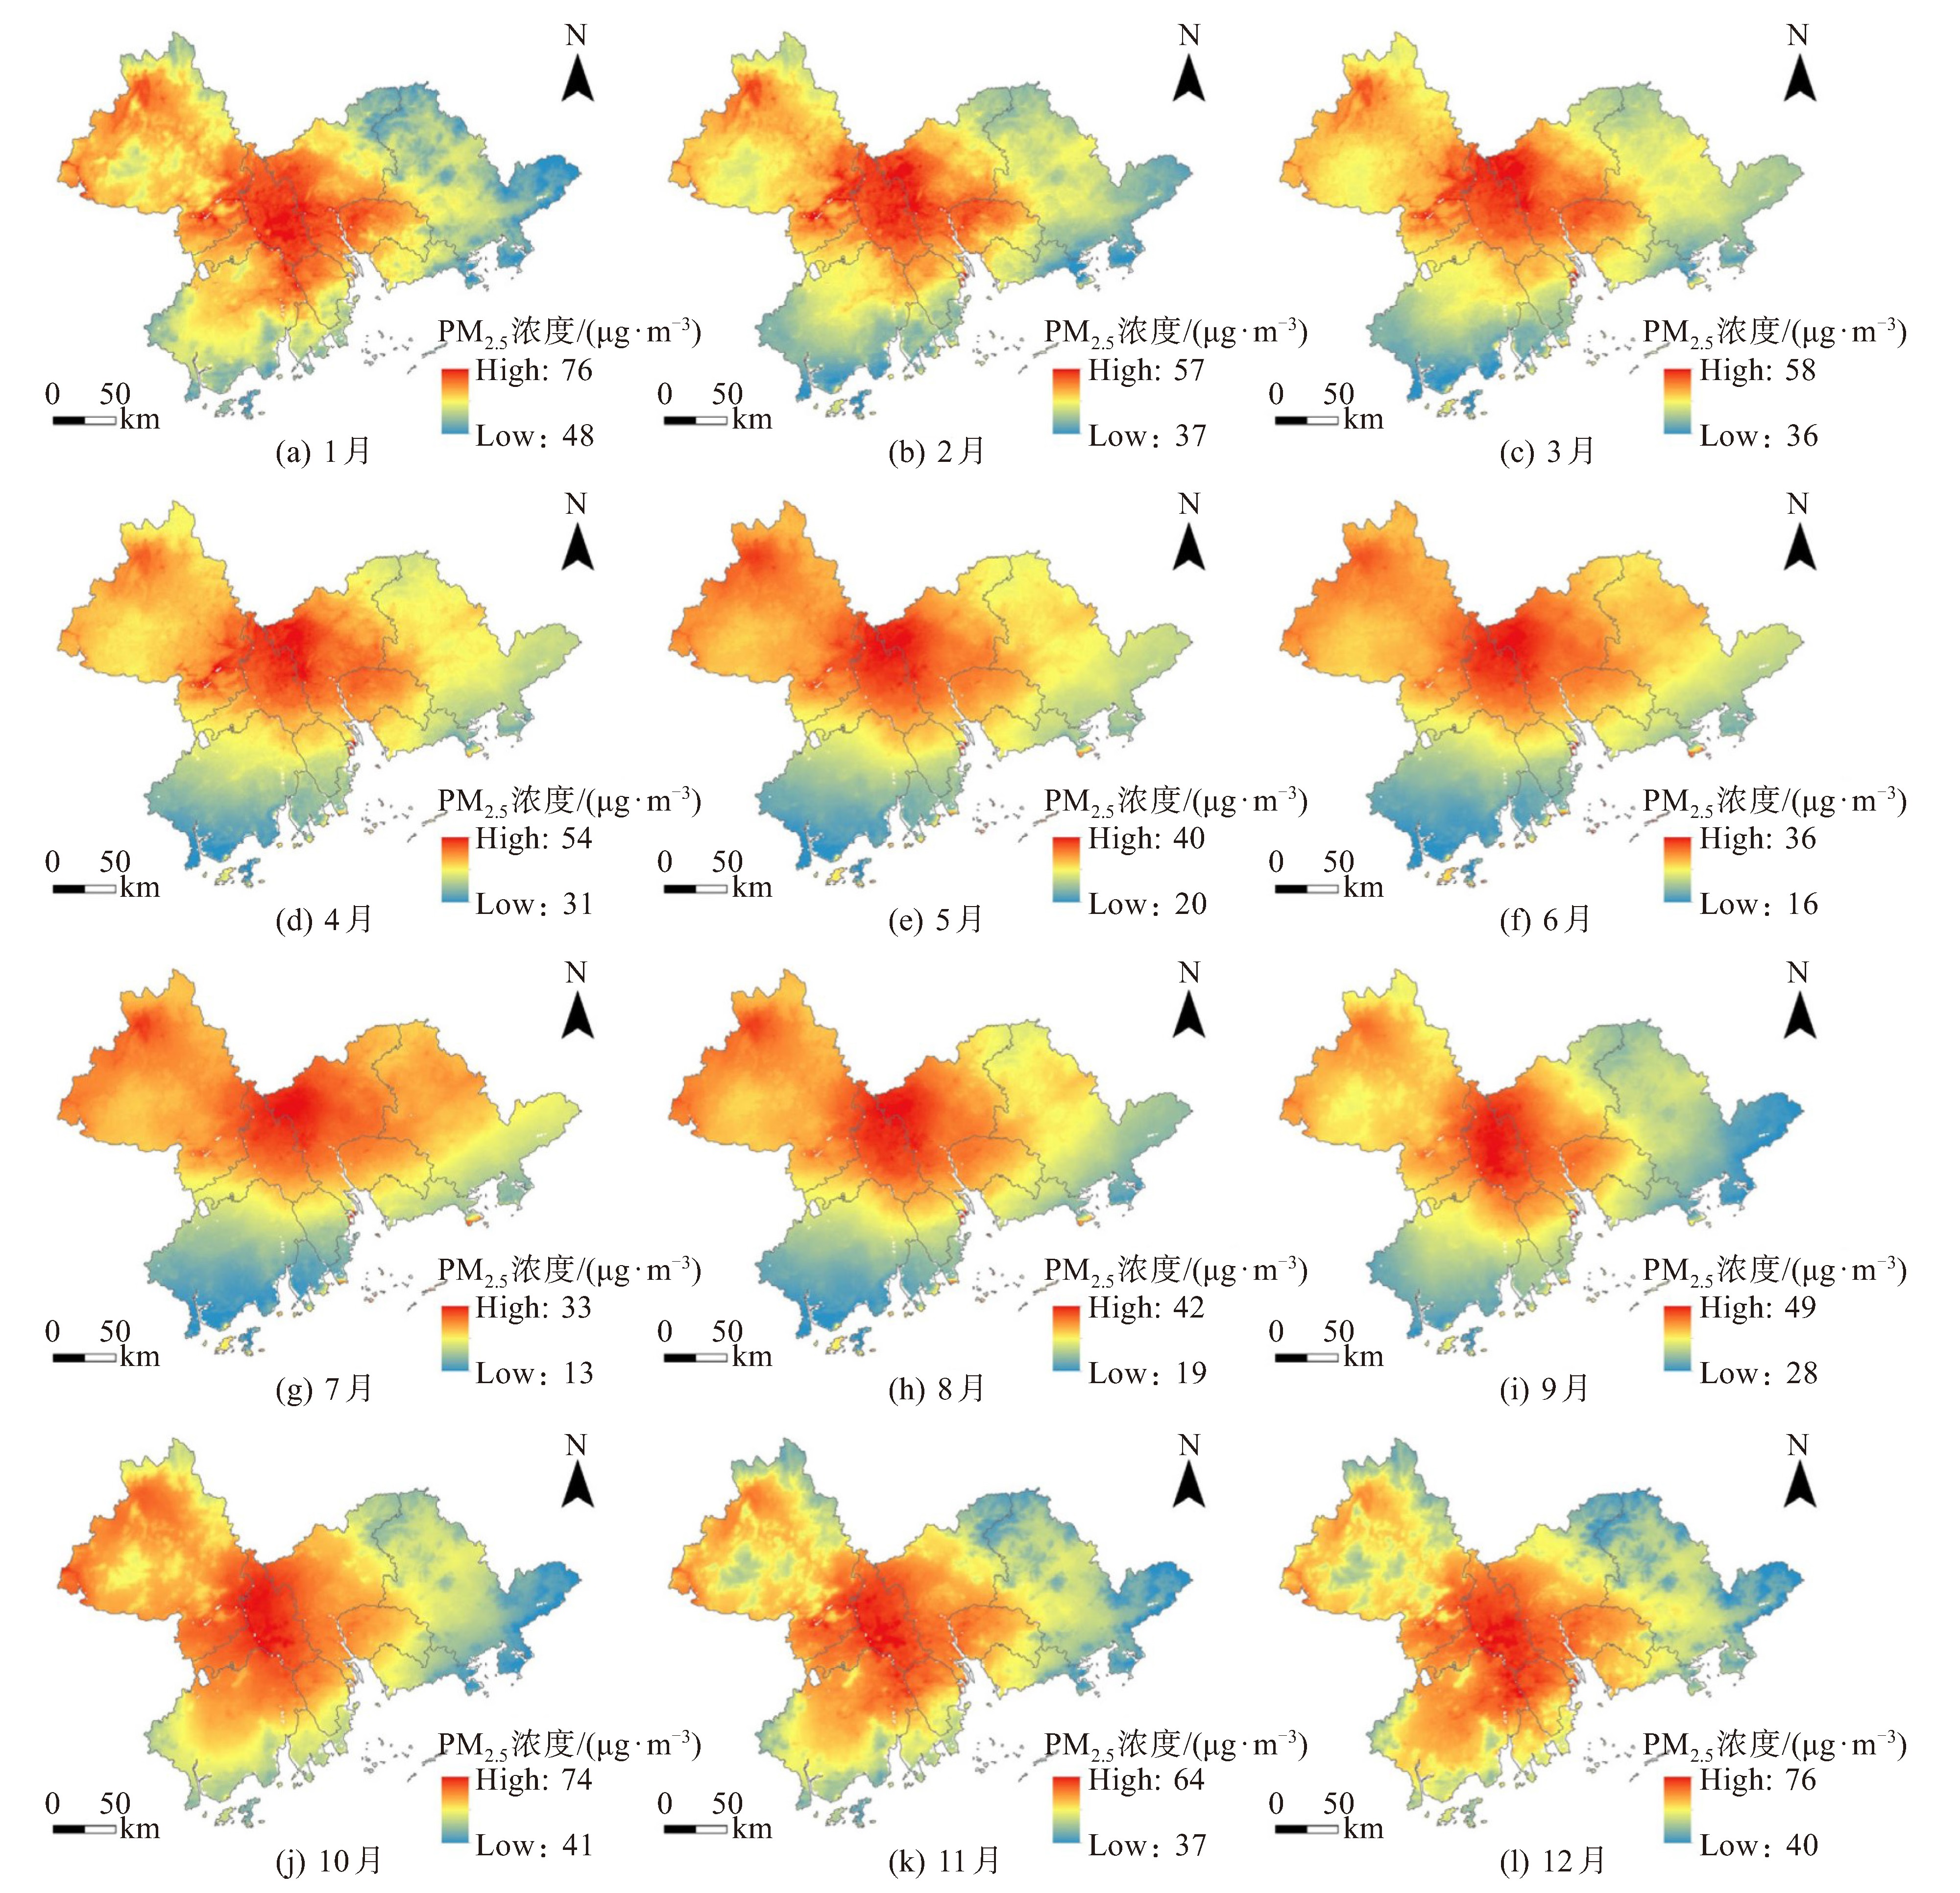
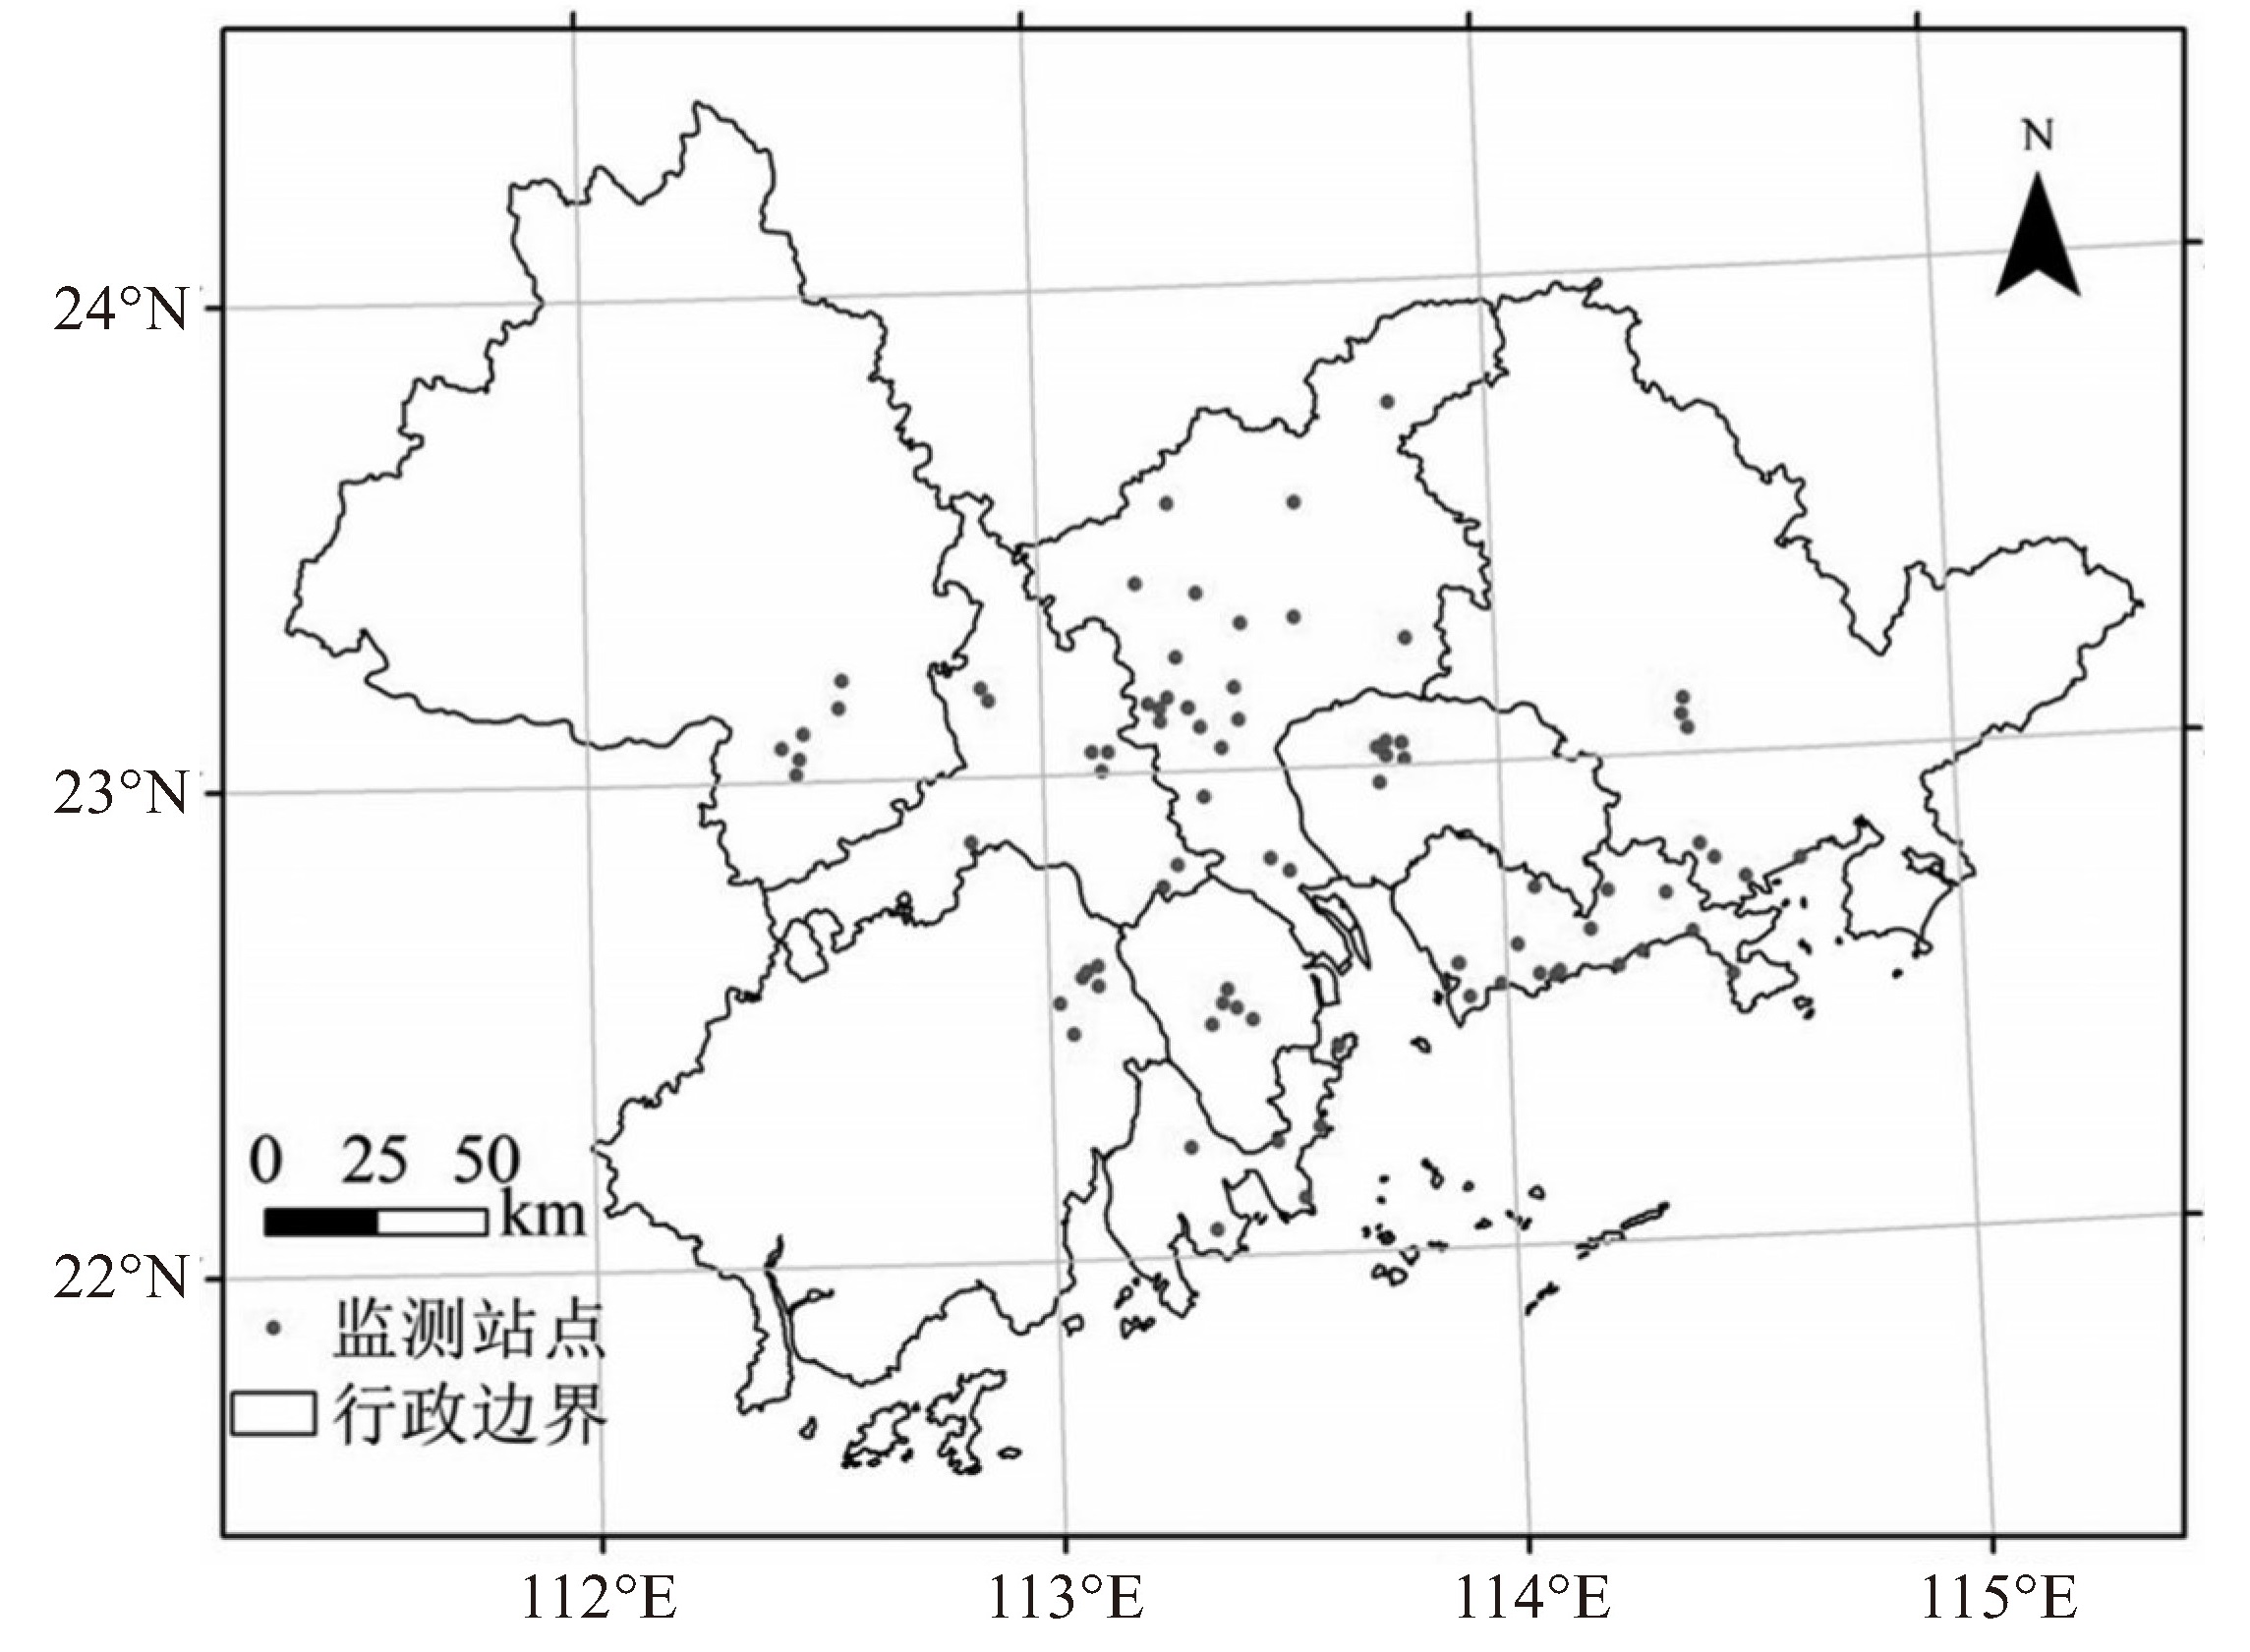
摘要: 过往基于观测站点对PM2.5浓度时空特征的揭示并不完整,本文评估了珠江三角洲城市群PM2.5遥感反演数据的准确性,并基于遥感反演数据进一步探讨了PM2.5年均、季均和月均浓度的时空格局变化及影响因素。2015—2022年的校验结果表明,遥感反演数据在珠三角城市群的准确度较高(R2:0.964~0.998),通过分段线性回归分析发现,2000—2022年PM2.5年均浓度在时间上呈现“上升-停滞-下降”的阶段特征,转折点为2004年和2013年(R2=0.943 6),主要影响因素为政府政策;空间上呈现“中心高,四周低”的分异规律,广佛(广州佛山)交界处基本为PM2.5污染的重心,污染最轻的区域为珠海、惠州东南部和江门南部。此外,扩展经验正交函数(EEOF)和小波分析结果表明,PM2.5浓度还具有显著的季节变化规律,具体表现为“秋冬高,春夏低”。以高污染时期(2003—2014年)为例,PM2.5月均浓度值在全年内呈现“先降后升”的趋势,1月最高(62.55 μg·m-3),7月最低(22.53 μg·m-3),降水是其主要影响因素;空间上,PM2.5浓度高的月份(10月—次年1月),污染范围向南扩散至江门和珠海,且不同地区的污染浓度差距较大。该研究结果可以为城市群的大气污染联防联控提供理论支撑。Abstract: Previous studies based on observation stations have not fully revealed the spatiotemporal characteristics of PM2.5 concentrations. This paper evaluates the accuracy of PM2.5 remote sensing inversion data in the Pearl River Delta (PRD) urban agglomeration and further explores the spatiotemporal patterns and influencing factors of annual, seasonal, and monthly average PM2.5 concentrations based on the remote sensing inversion data. Validation from 2015 to 2022 confirms the high accuracy of the remote sensing data (R2: 0.964-0.998). Analysis based on the inversion data from 2000 to 2022 reveals a "rise-stagnation-decline" trend in annual average PM2.5 concentrations, with key turning points in 2004 and 2013 (R2=0.943 6). The primary influencing factors are government policies. Spatially, PM2.5 concentrations exhibit a distinct"high in the center, low in the periphery"pattern. The Guangzhou-Foshan border forms the core pollution zone for PM2.5, while the regions with the lowest pollution levels are identified in Zhuhai, southeastern Huizhou, and southern Jiangmen. Seasonally, PM2.5 concentrations follow a"high in autumn and winter and low in spring and summer"pattern. Taking the high pollution period (2003-2014) as an example, monthly average concentrations of PM2.5 showed a trend of"falling first and then rising" throughout the year, with the highest in January (62.55 μg·m-3) and the lowest in July (22.53 μg·m-3), with precipitation being the main influencing factor. Spatially, from October to January, the area of high PM2.5 concentrations expands southward to encompass Jiangmen and Zhuhai, with significant regional variations. The findings of this study provide theoretical basis for the joint prevention and control of air pollution in urban agglomerations.
-
Key words:
- PM2.5 /
- remote sensing data /
- spatial and temporal distribution /
- Pearl River Delta
-
[1] 丁镭, 方雪娟, 陈昆仑. 中国PM2.5污染对居民健康的影响及经济损失核算[J]. 经济地理, 2021, 41(7): 82-92. [2] 陈镘, 黄柏石, 刘晔. PM2.5污染对中国人口死亡率的影响——基于346个城市面板数据的实证分析[J]. 地理科学进展, 2022, 41(6): 1 028-1 040. [3] 环境保护部, 国家质量监督检验检疫总局. GB 3095-2012环境空气质量标准[S]. 北京: 中国环境科学出版社, 2012. [4] 国务院. 国务院关于印发大气污染防治行动计划的通知[EB/OL]. 中国政府网, 2013-09-13[2024-06-04]. https://www.gov.cn/zwgk/2013-09/12/content_2486773.htm .[5] 菅月诚, 赵铖博, 朱子博, 等. 聊城市PM2.5和O3污染特征及气象因素影响分析[J]. 环境科学学报, 2023, 43(9): 257-267. [6] 李江苏, 段良荣, 张天娇. 中国城市PM2.5和PM10时空分布特征和影响因素分析[J]. 环境科学, 2024, 45(4): 1 938-1 949. [7] 耿佳辰, 沈石, 程昌秀. "十三五"时期黄河流域PM2.5时空分布规律及多尺度社会经济影响机制分析[J]. 地球信息科学学报, 2022, 24(6): 1 163-1 175. [8] Jephcote C, Hansell A L, Adams K, et al. Changes in air quality during COVID-19'lockdown'in the United Kingdom[J]. Environ mental Pollution, 2021, 272: 116011. [9] Bai K, Li Ke, Ma M, Et al. LGHAP: the long-term gap-free high-resolution air pollutant concentration dataset, derived via tensor-flow-based multimodal data fusion[J]. Earth System Science Data, 2022, 14(2): 907-927. [10] Ngo T X, Pham H V, Phan H D T, et al. A daily and complete PM2.5 dataset derived from space observations for Vietnam from 2012 to 2020[J]. Science of the Total Environment, 2023, 857: 159537. [11] 张丽萍, 王旭峰, 何映月, 等. 基于多源数据的陕西省PM2.5时空分布特征及成因分析[J]. 环境科学学报, 2023, 43(6): 94-109. [12] Lin C, Li Y, Lau A K H, et al. Estimation of long-term population exposure to PM2.5 for dense urban areas using 1-km MODIS data[J]. Remote Sensing of Environment, 2016, 179: 13-22. [13] 苏涛, 李婷婷, 陈多宏, 等. 同位素结合PMF模型解析珠三角PM2.5来源研究[J]. 地球化学, 2024, 53(3): 320-329. [14] 廖志恒, 孙家仁, 范绍佳, 等. 2006~2012年珠三角地区空气污染变化特征及影响因素[J]. 中国环境科学, 2015, 35(2): 329-336. [15] 庄欣, 黄晓锋, 陈多宏, 等. 珠江三角洲PM2.5高污染天气的区域污染特征分析[J]. 环境污染与防治, 2017, 39(10): 1 088-1 091. [16] 刘长焕, 邓雪娇, 朱彬, 等. 近10年中国三大经济区太阳总辐射特征及其与O3、PM2.5的关系[J]. 中国环境科学, 2018, 38(8): 2 820-2 829. [17] Wu S, Yao J, Wang Y, et al. Influencing factors of PM2.5 concentration in the typical urban agglomerations in China based on wavelet perspective[J]. Environmental Research, 2023, 237: 116641. [18] 吴舒祺, 顾杨旸, 张天岳, 等. 中国三大城市群PM2.5浓度非线性变化分析[J]. 环境科学, 2024, 45(2): 709-720. [19] 蔡清楠, 车扬子, 孙凌瑜, 等. 珠三角地区PM2.5浓度估算及其健康效应评估[J]. 生态学报, 2021, 41(22): 8 977-8 990. [20] 蒋超, 龚建周, 孙家仁, 等. 2013—2016年珠三角地区PM2.5分布时空演变[J]. 生态环境学报, 2018, 27(9): 1 698-1 705. [21] Gao P, Yang Y F, Liang L T. Influence of urban construction landscape pattern on PM2.5 pollution: theory and demonstration-a case of the Pearl River Delta region[J]. Applied Ecology and Environmental Research, 2020, 18(6): 7 915-7 939. [22] 昌晶亮, 余洪, 罗伟伟. 珠三角地区PM2.5浓度空间自相关分析[J]. 生态与农村环境学报, 2015, 31(6): 853-858. [23] 魏凤英. 现代气候统计诊断与预测技术(第二版)[M]. 北京: 气象出版社, 2007. [24] Wei J, Li Z, Cribb M, et al. Improved 1 km resolution PM2.5 estimates across China using enhanced space-time extremely randomized trees[J]. Atmospheric Chemistry and Physics, 2020, 20(6): 3273-3289. [25] Wei J, Li Z, Lyapustin A, et al. Reconstructing 1-km-resolution high-quality PM2.5 data records from 2000 to 2018 in China: spatiotemporal variations and policy implications[J]. Remote Sensing of Environment, 2021, 252: 112136. [26] Chicco D, Warrens M J, Jurman G. The coefficient of determination R-squared is more informative than SMAPE, MAE, MAPE, MSE and RMSE in regression analysis evaluation[J]. PeerJ Computer Science, 2021, 7: e623. [27] Tian H, Zhao Y, Luo M, et al. Estimating PM2.5 from multisource data: A comparison of different machine learning models in the Pearl River Delta of China[J]. Urban Climate, 2021, 35: 100740. [28] Tomé A R, Miranda P M A. Piecewise linear fitting and trend changing points of climate parameters[J]. Geophysical Research Letters, 2004, 31(2): 2003GL019100. [29] 刘宪锋, 朱秀芳, 潘耀忠, 等. 近53年内蒙古寒潮时空变化特征及其影响因素[J]. 地理学报, 2014, 69(7): 1 013-1 024. [30] Guo Y, Ren Z, Dong Y, et al. Multifunctionality can be promoted by increasing agriculture-dominated heterogeneous landscapes in an agro-forestry interlacing zone in northeast China[J]. Landsc Urban Plan, 2023, 238: 104832. [31] Weare B C, Nasstrom J S. Examples of extended empirical orthogonal function analyses[J]. Mon Wea Rev, 1982, 110(6): 481-485. [32] Lin C, Li Y, Yuan Z, et al. Using satellite remote sensing data to estimate the high-resolution distribution of ground-level PM2.5[J]. Remote Sensing of Environment, 2015, 156: 117-128. [33] Li T, Deng X, Chen J, et al. Comparison and Impact Factor Analysis of Ground PM2.5 Retrieved by Aqua and Himawari-8 Satellite Products in Guangdong, China[J]. Aerosol and Air Quality Research, 2023, 23(3): 220290. [34] Lin C, Li Y, Lau A K H, et al. 15-Year PM2.5 Trends in the Pearl River Delta Region and Hong Kong from Satellite Observation[J]. Aerosol and Air Quality Research, 2018, 18(9): 2355-2362. [35] Zhang L, Zhao N, Zhang W, et al. Changes in long-term PM2.5 pollution in the urban and suburban areas of China's three largest urban agglomerations from 2000 to 2020[J]. Remote Sensing, 2022, 14(7): 1716. [36] 李天翔, 蒋超, 龚建周. 粤港澳大湾区秋冬季节PM2.5浓度时空模拟分析[J]. 广州大学学报(自然科学版), 2022, 21(3): 67-73. [37] 代园园, 龚绍琦, 张存杰, 等. 粤港澳大湾区大气PM2.5浓度的遥感估算模型[J]. 环境科学, 2024, 45(1): 8-22. [38] Lu X, Chen Y, Huang Y, et al. Differences in concentration and source apportionment of PM2.5 between 2006 and 2015 over the PRD region in southern China[J]. Science of the Total Environment, 2019, 673: 708-718. [39] 广东省人民政府. 广东省人民政府关于印发广东省大气污染防治行动方案(2014—2017年)的通知[EB/OL]. 广东省人民政府门户网, 2014-02-14[2024-06-04]. https://www.gd.gov.cn/gkmlpt/content/0/142/post_142687.html#7 .[40] Hou X, Chan C K, Dong G H, et al. Impacts of transboundary air pollution and local emissions on PM2.5 pollution in the Pearl River Delta region of China and the public health, and the policy implications[J]. Environmental Research Letters, 2019, 14(3): 034005. [41] Pan Y, Zhu Y, Jang J, et al. Source and sectoral contribution analysis of PM2.5 based on efficient response surface modeling technique over Pearl River Delta region of China[J]. Science of the Total Environment, 2020, 737: 139655. [42] Li Z, Zhu Y, Wang S, et al. Source contribution analysis of PM2.5 using Response Surface Model and Particulate Source Apportionment Technology over the PRD region, China[J]. Science of the Total Environment, 2022, 818: 151757. [43] 刘一鸣, 郑浩阳, 陈阁香, 等. 华南沿海地区夏初PM2.5水溶性离子特征及来源解析[J]. 环境科学学报, 2023, 43(1): 237-246. [44] Hu M, Wang Y, Wang S, et al. Spatial-temporal heterogeneity of air pollution and its relationship with meteorological factors in the Pearl River Delta, China[J]. Atmospheric Environment, 2021, 254: 118415. [45] Lei R, Nie D, Zhang S, et al. Spatial and temporal characteristics of air pollutants and their health effects in China during 2019-2020[J]. Journal of Environmental Management, 2022, 317: 115460. -

 下载:
下载:
 点击查看大图
图(10)
计量
- 文章访问数: 2
- HTML全文浏览量: 1
- PDF下载量: 0
- 被引次数: 0
 粤公网安备 4401069904700003号