


Surface Temperature Response to CO2 Forcing in Guangdong: A Quantitative Attribution of Uncertainties
-
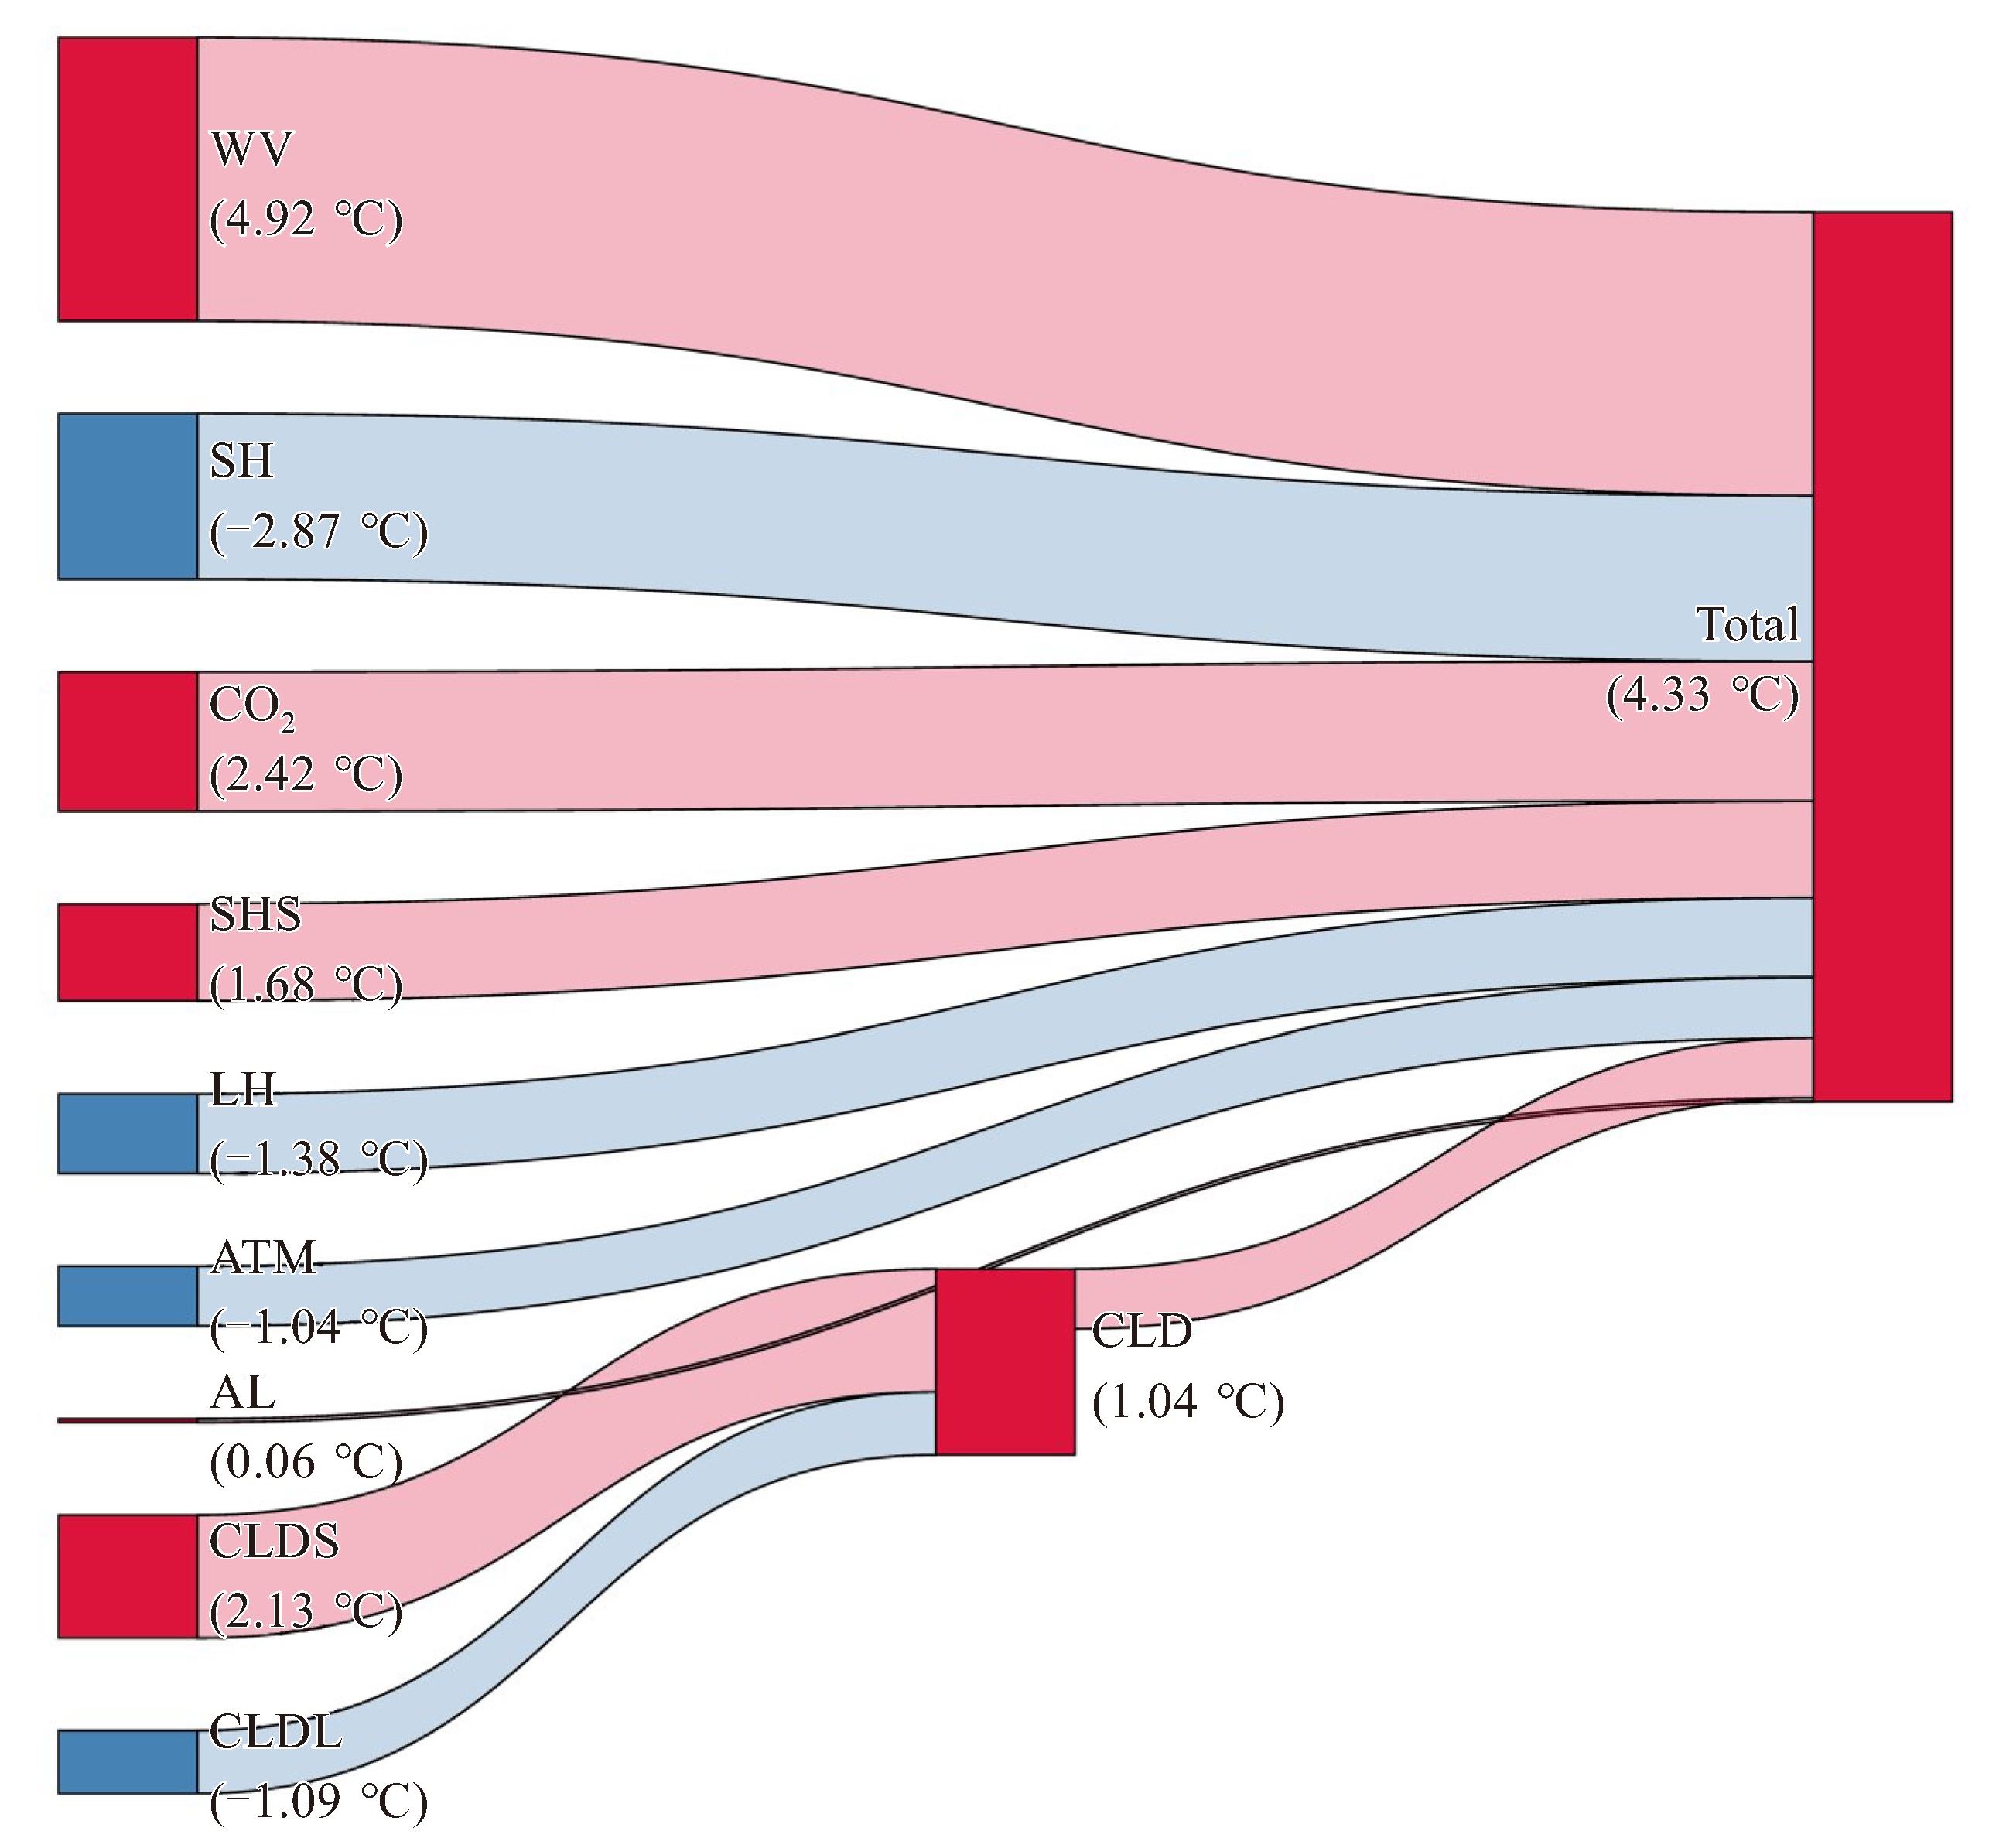
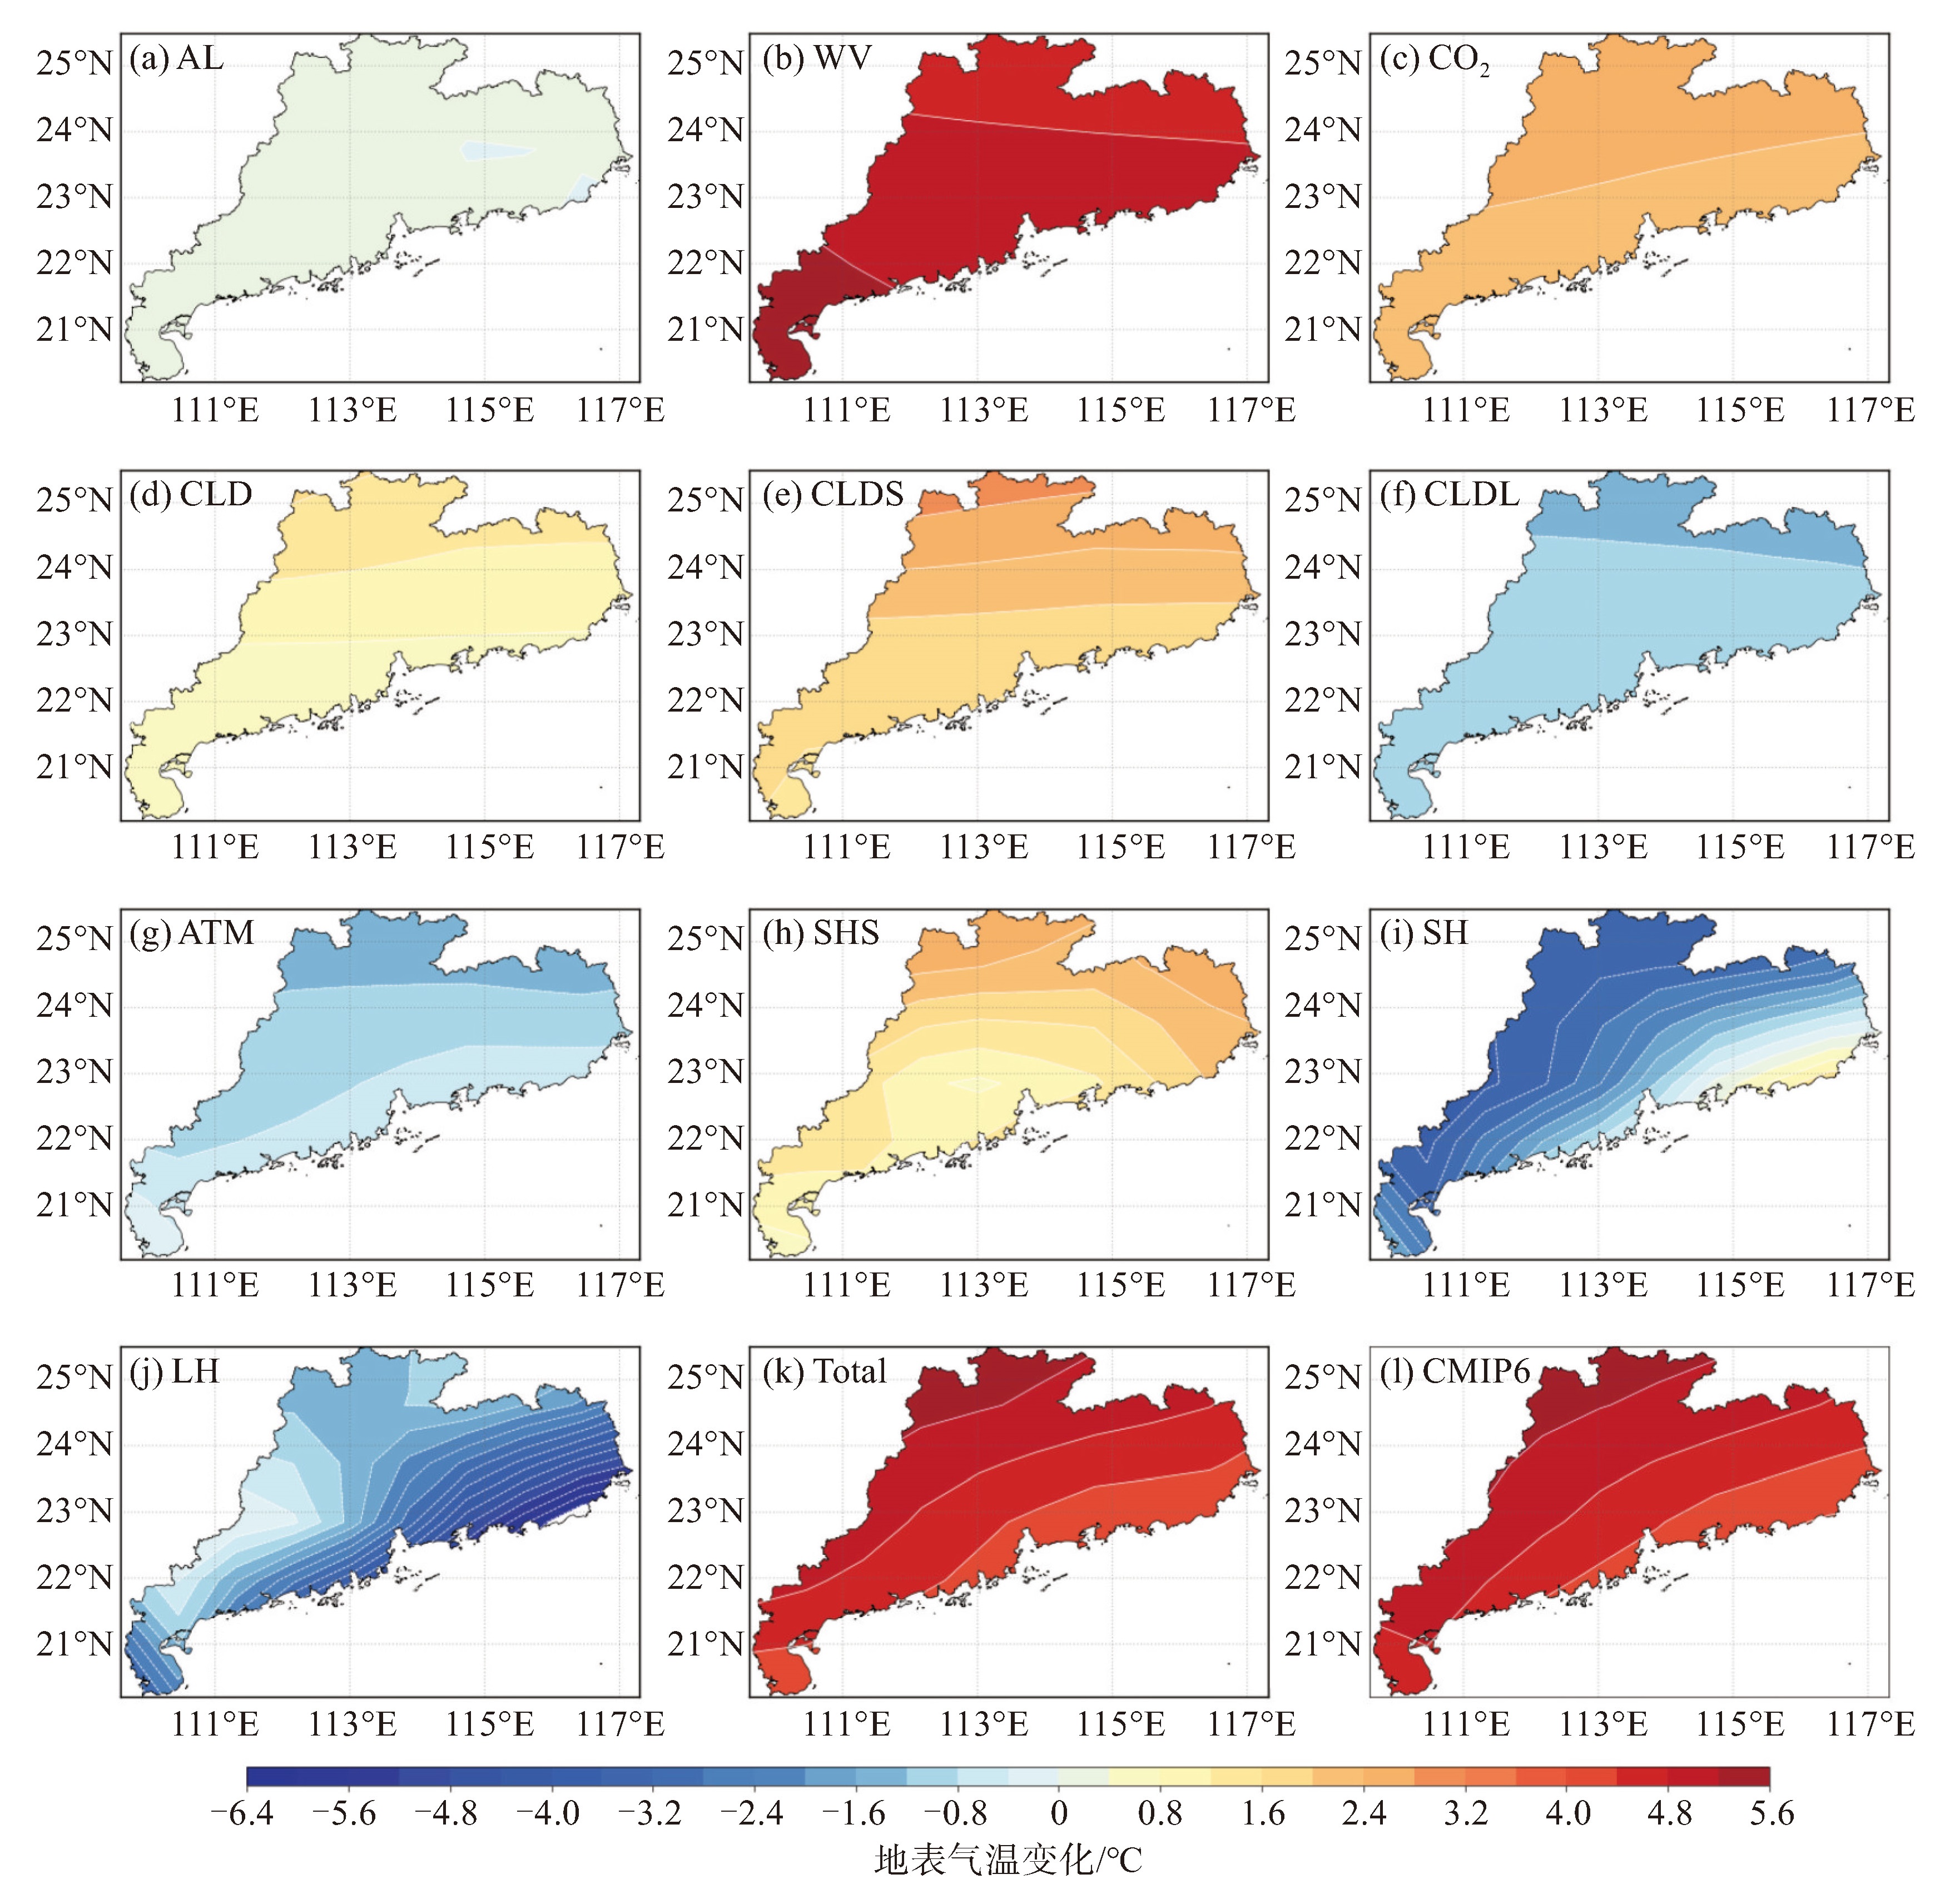
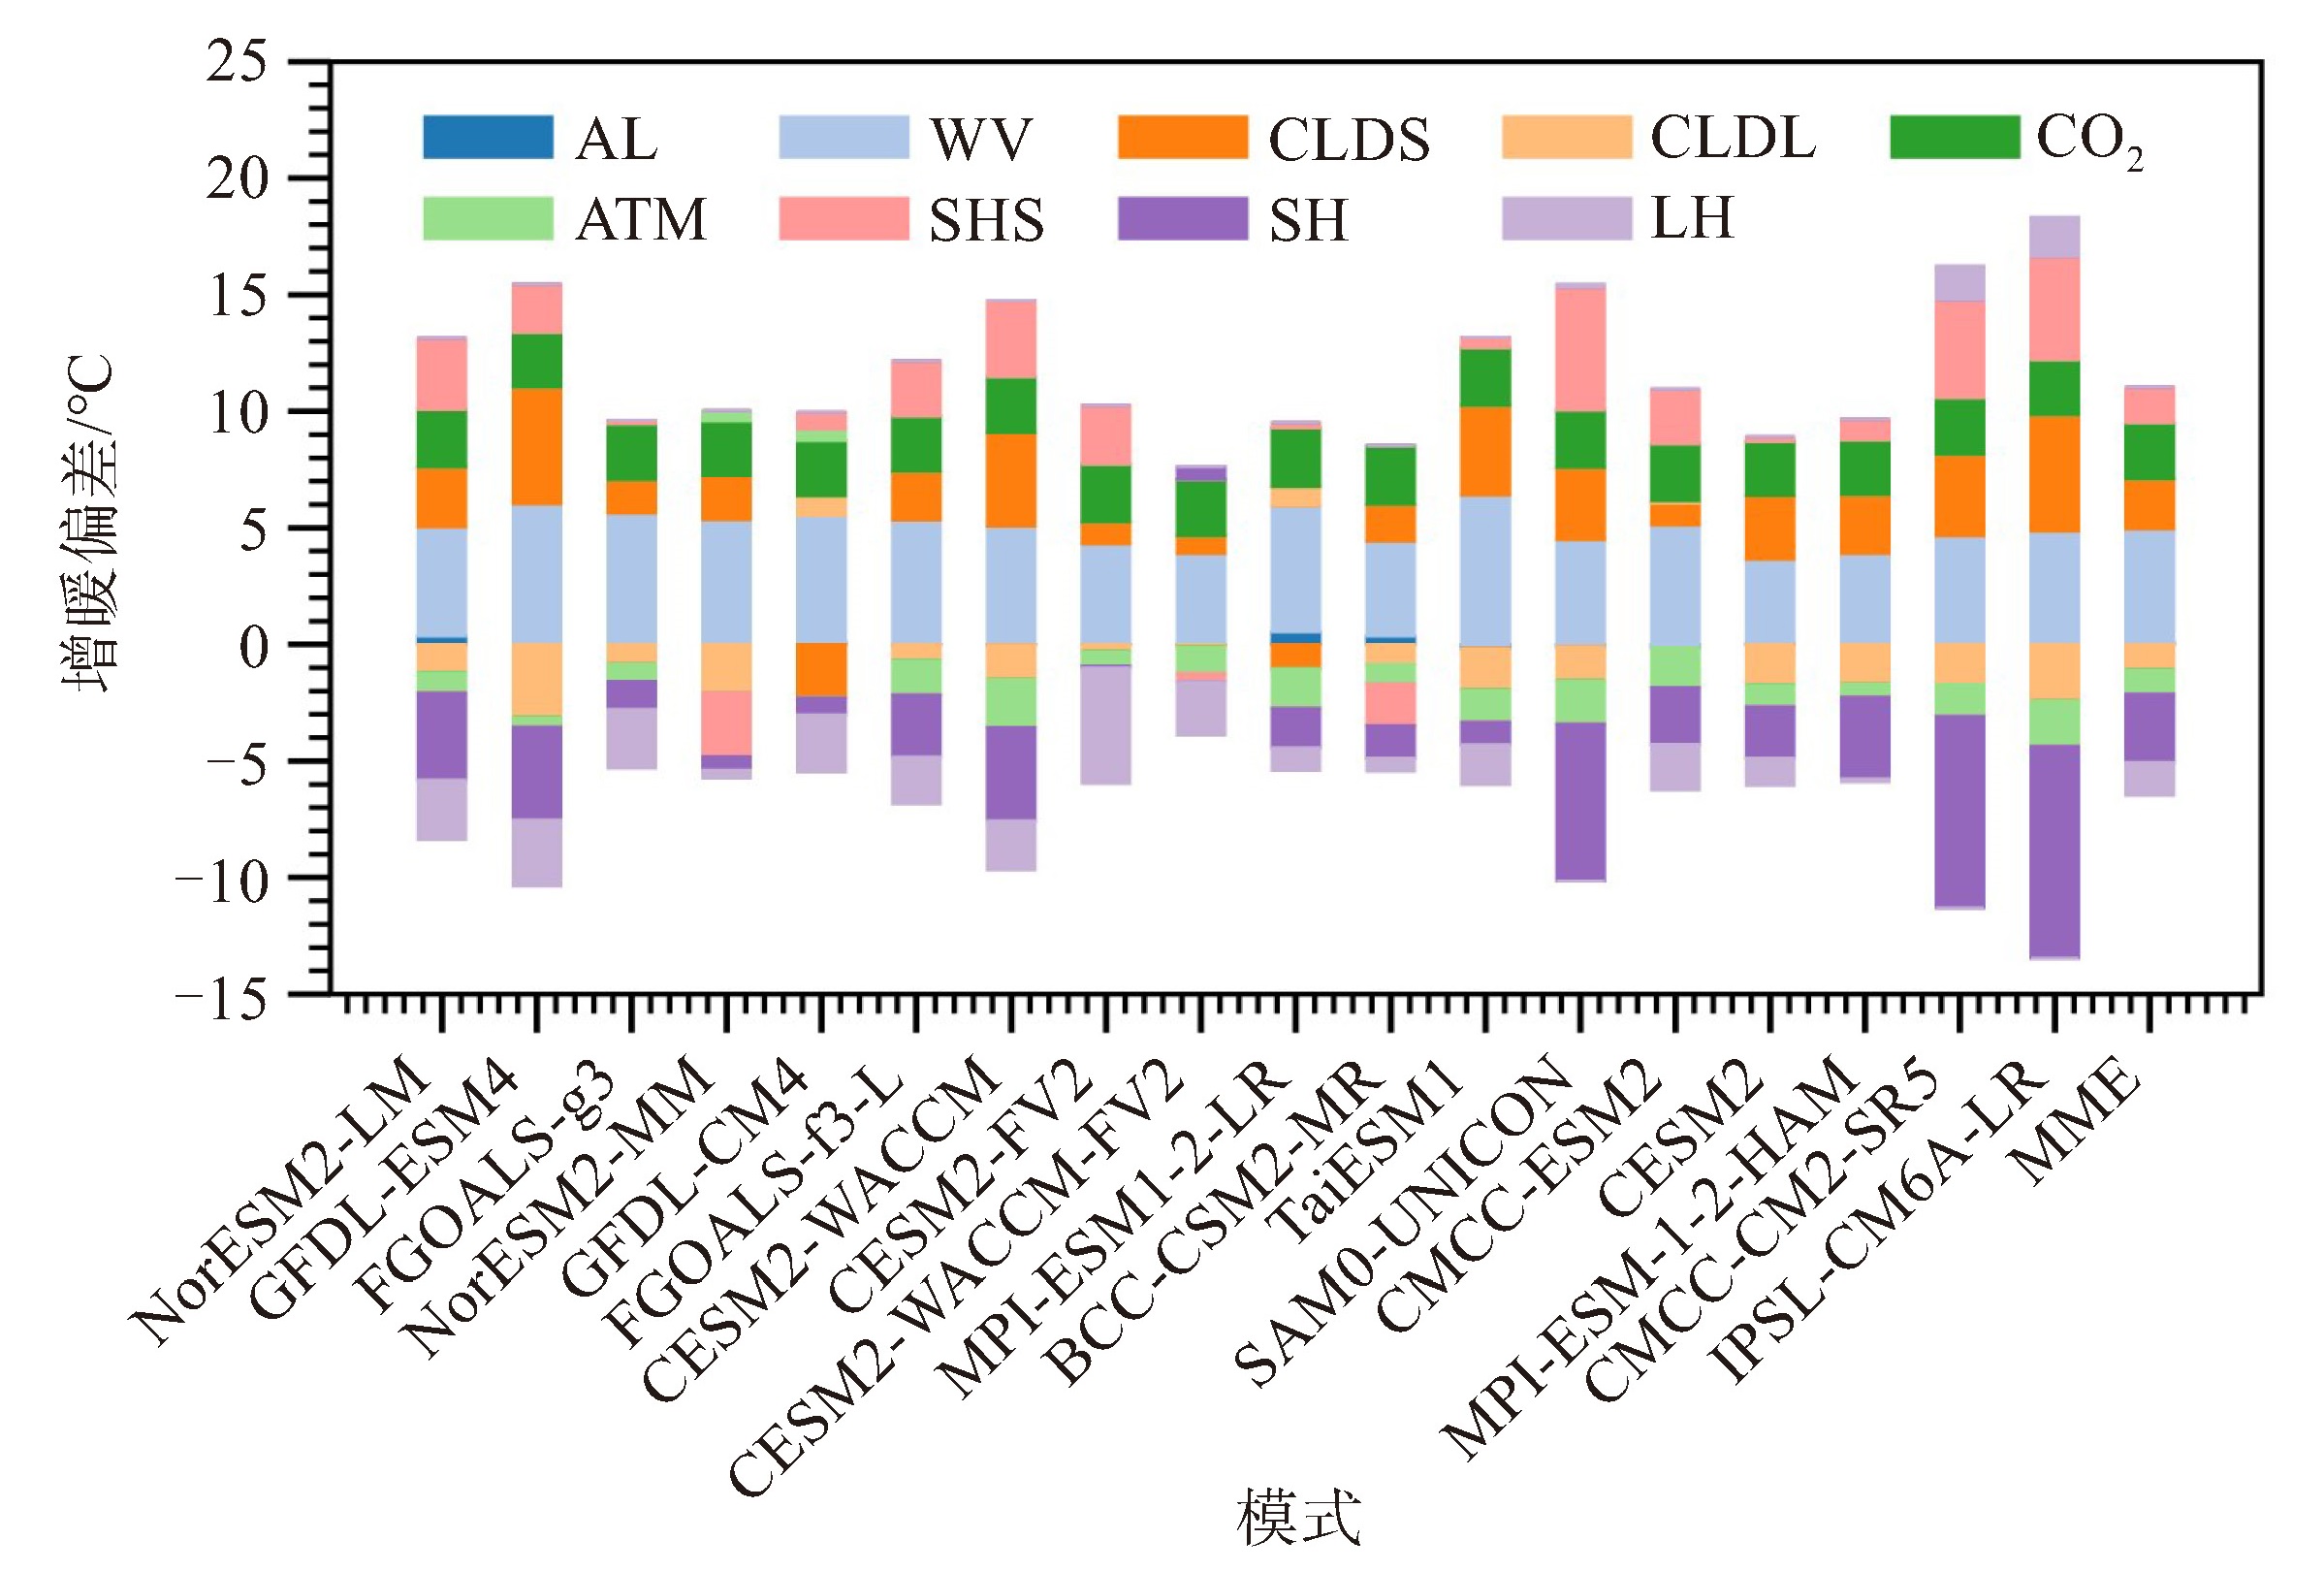
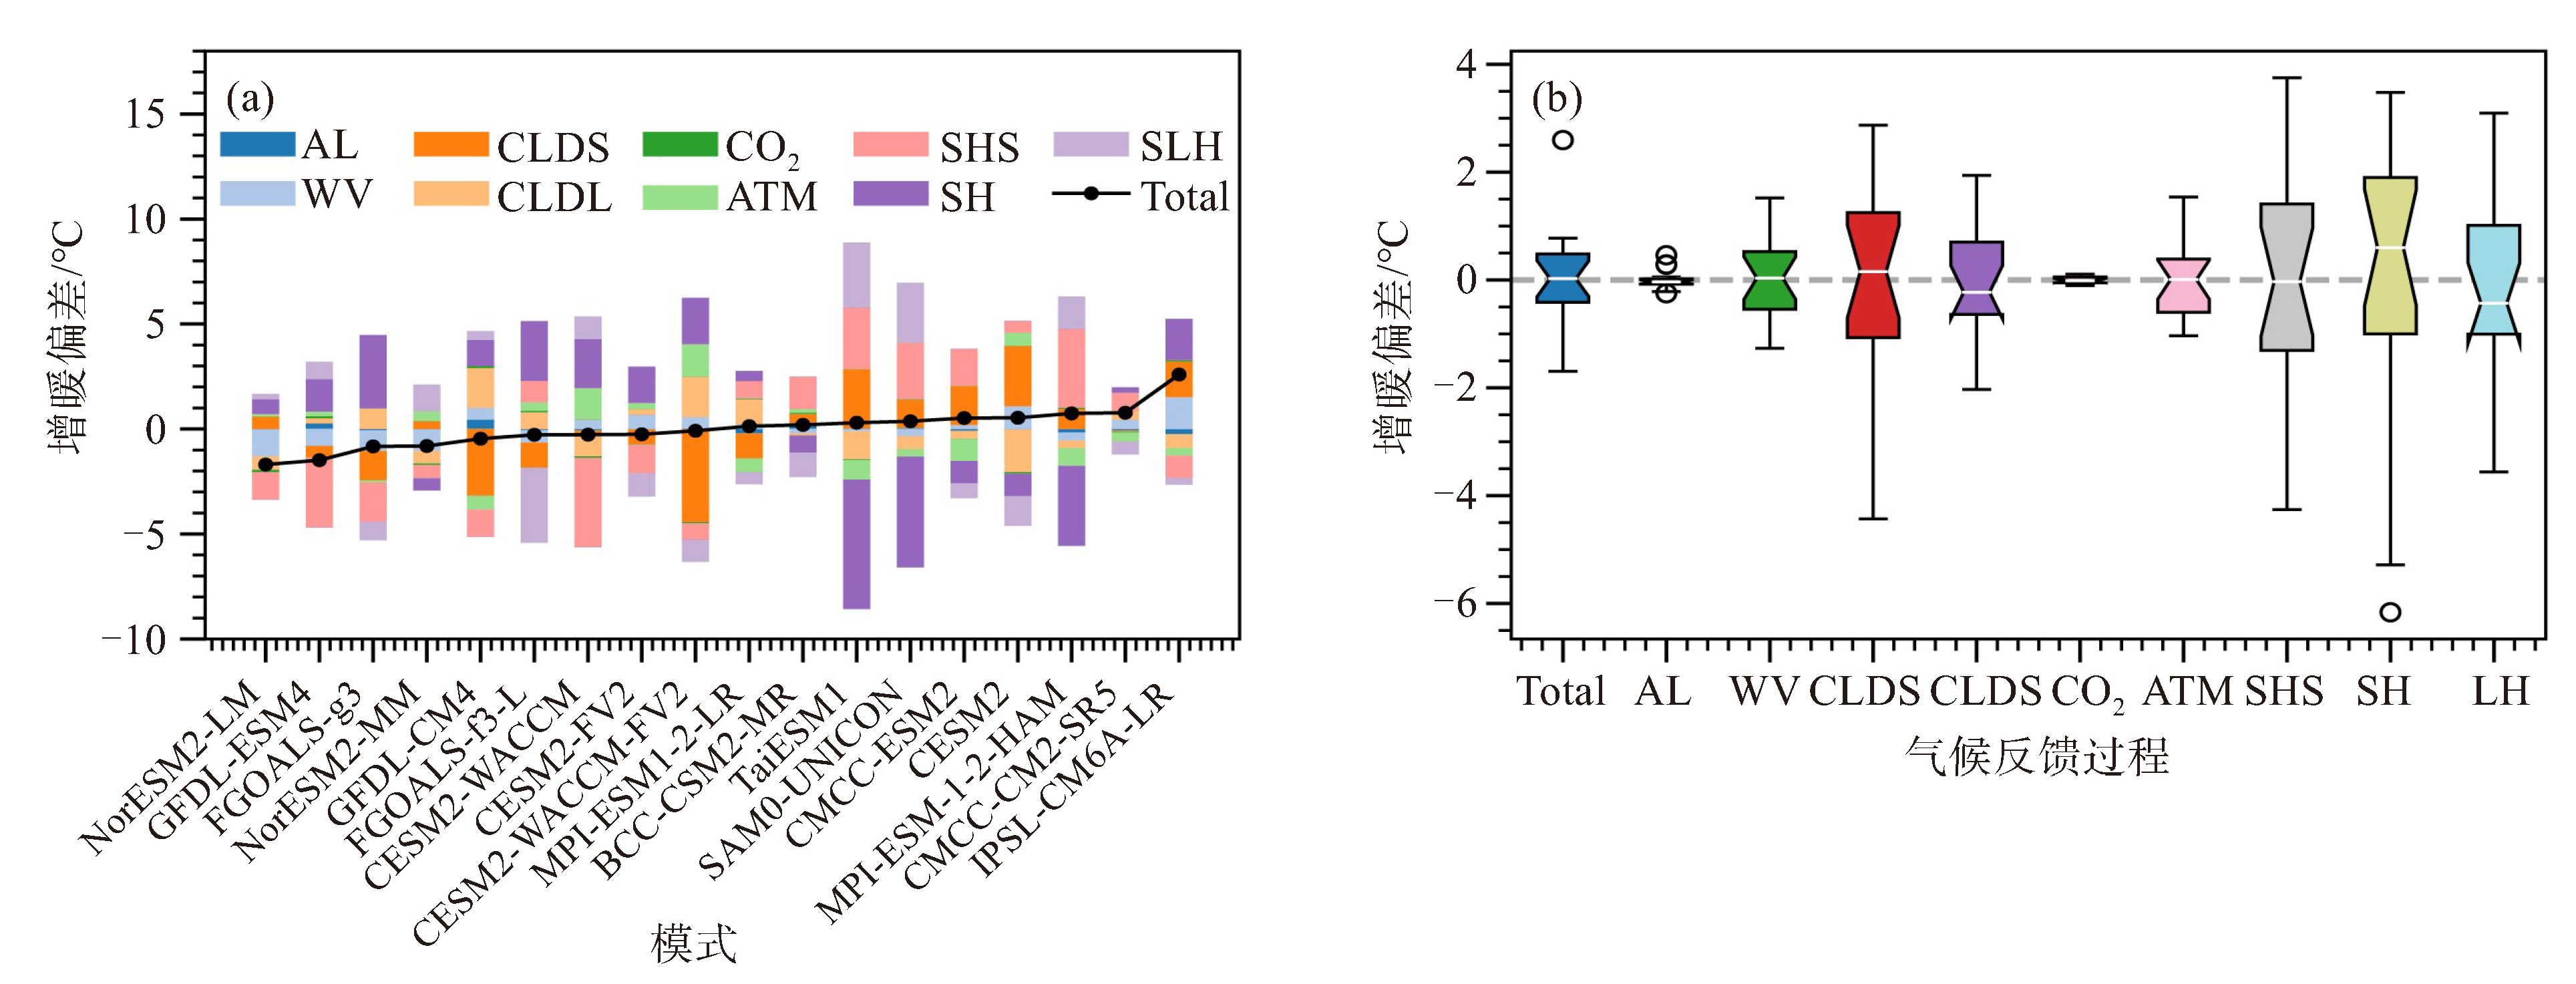
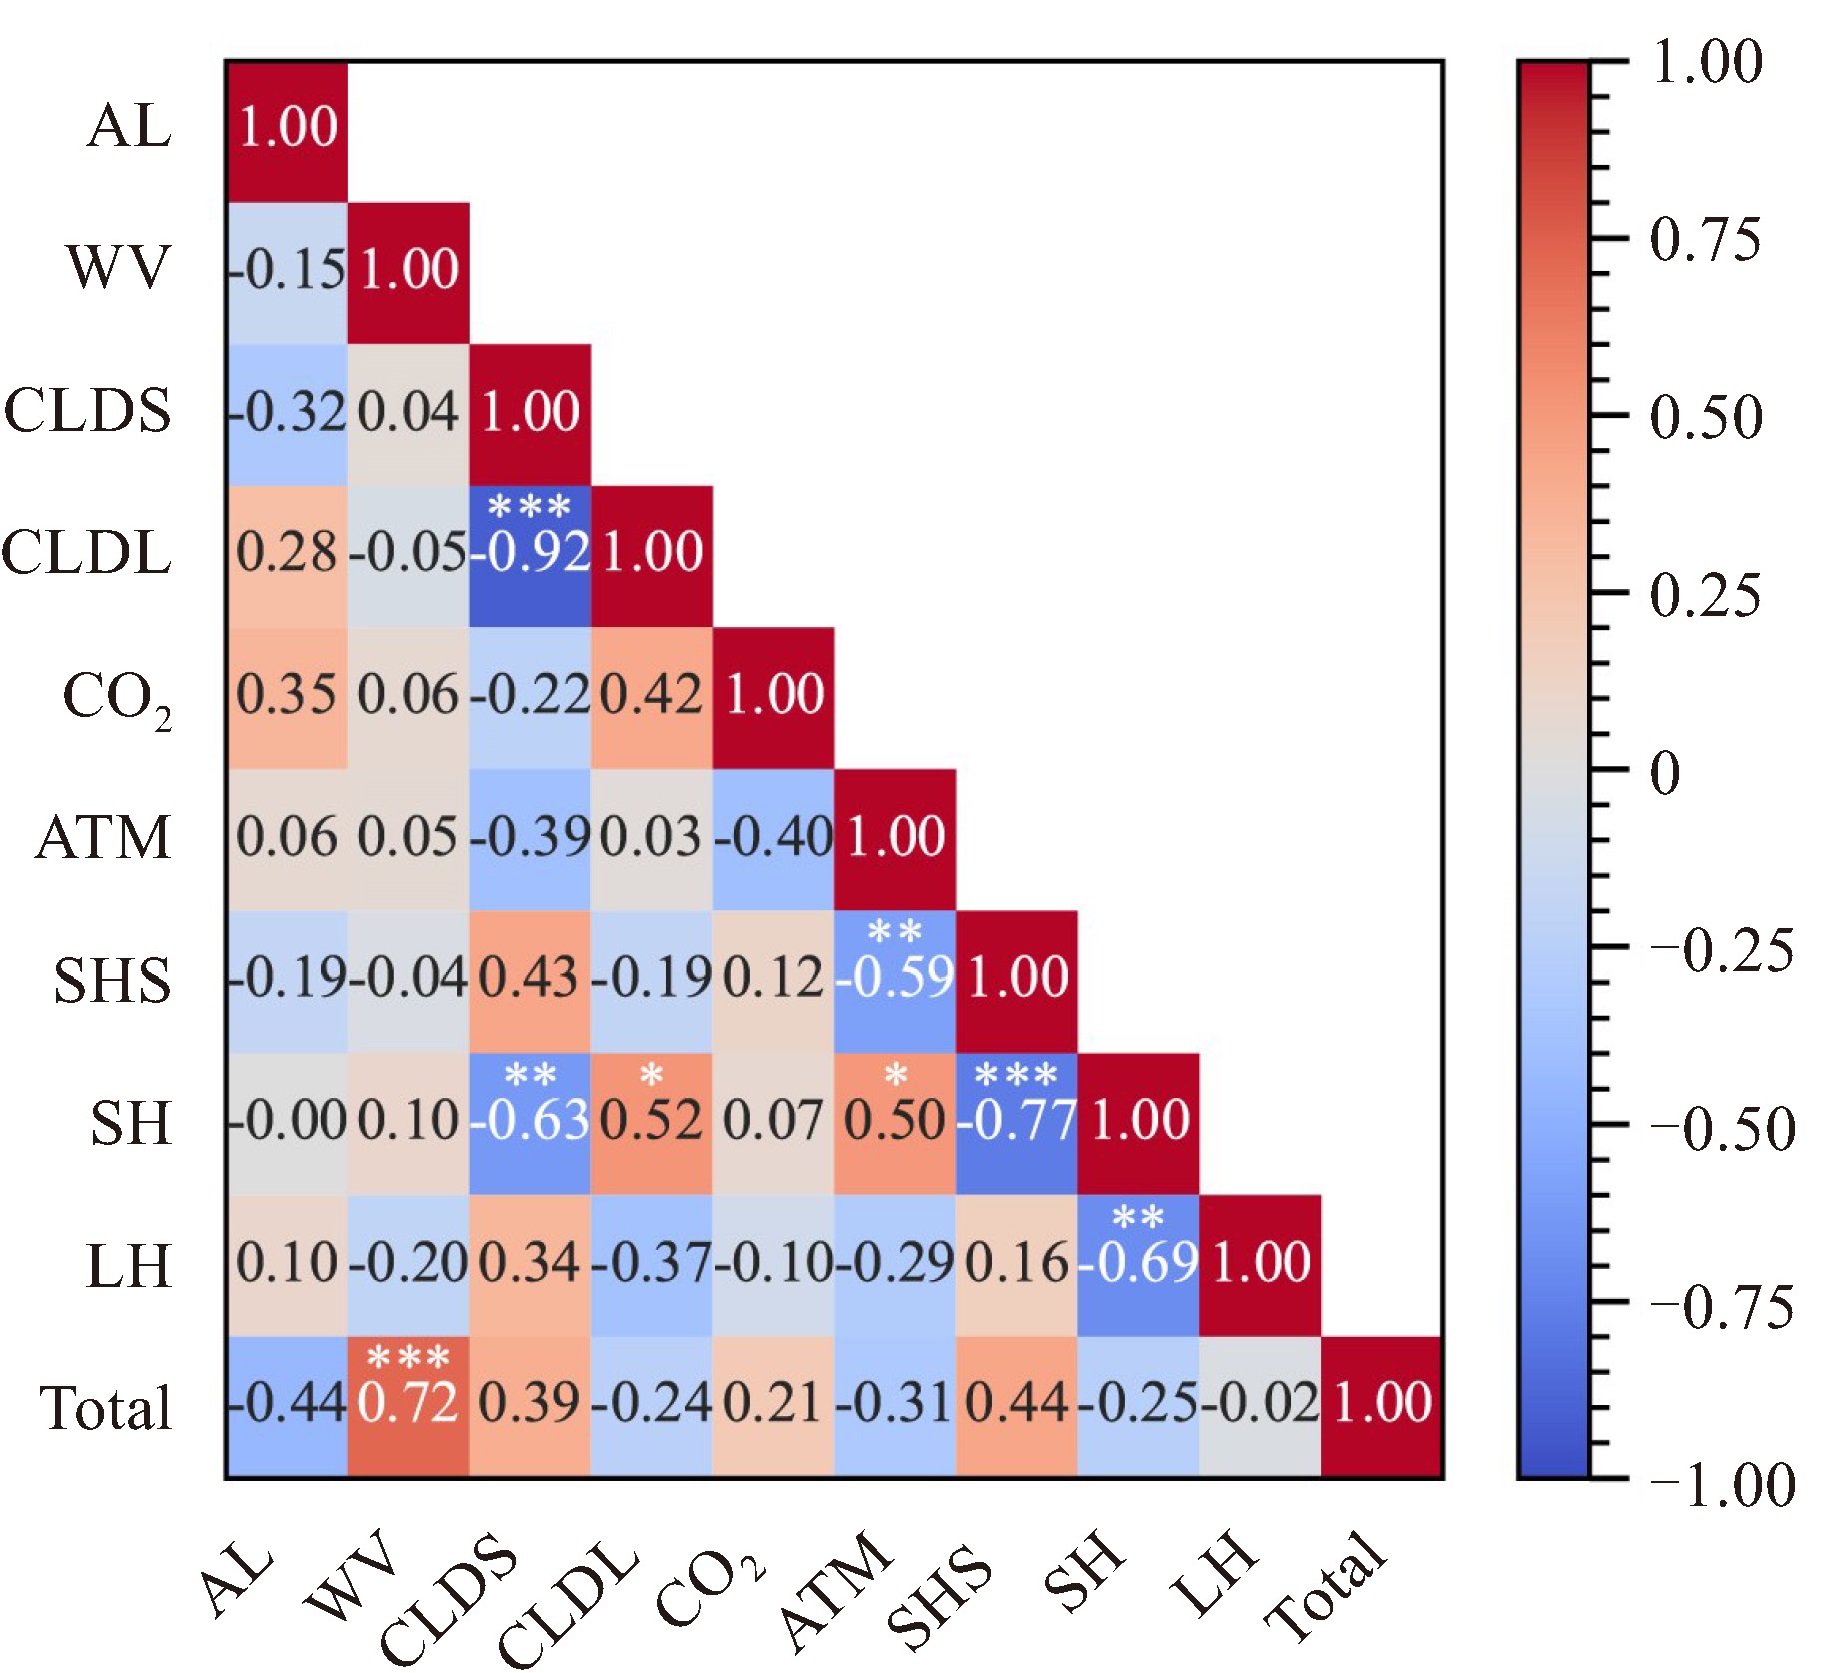
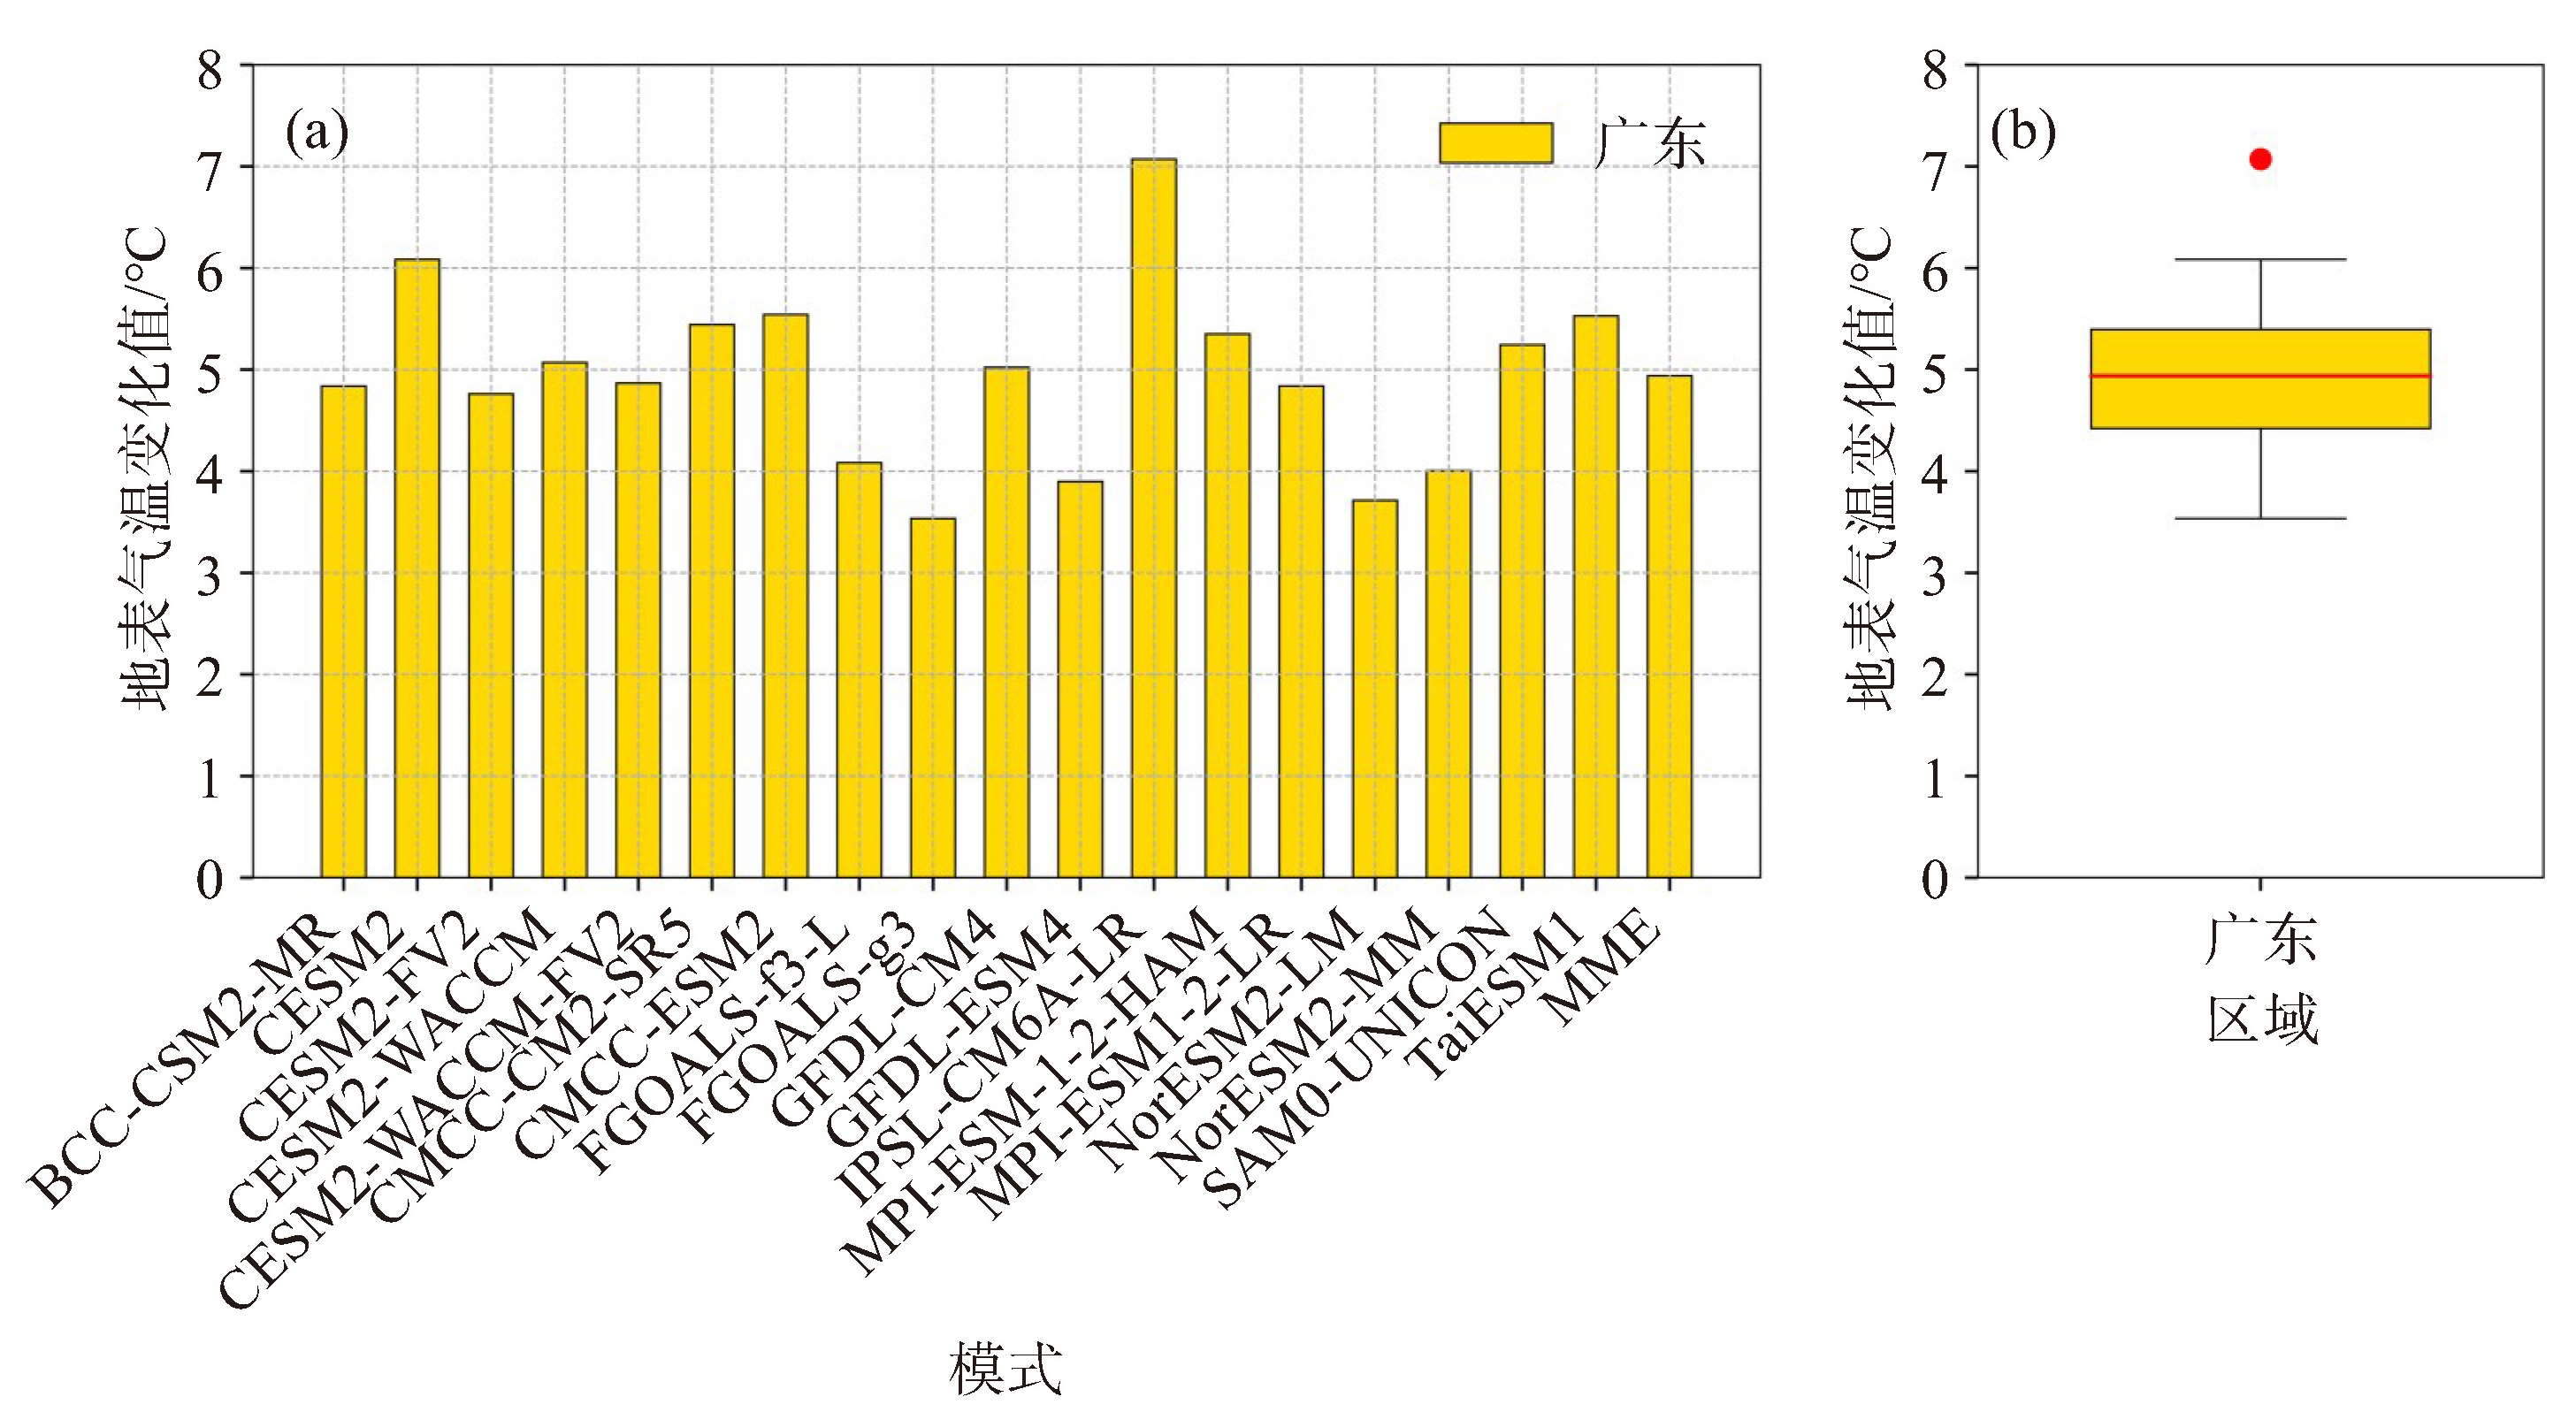
摘要: 基于第六次耦合模式比较计划(Coupled Model Intercomparison Project Phase 6, 简称CMIP6)的18个气候模式模拟数据,采用了控制试验(piControl)作为稳定气候状态的参考,使用突然4倍CO2强迫试验(abrupt-4×CO2)来模拟极端温室气体排放情景下的气候响应,并利用气候反馈响应分析方法(CFRAM),定量评估了外强迫、各辐射反馈过程和非辐射过程对广东省增暖及其不确定性的贡献。结果显示,广东省的增暖幅度在不同模式间存在差异,增暖范围为3.71~7.07 ℃,集中在4.42~5.40 ℃之间,且增暖在西部和北部最显著。对于多模式集合平均的增暖进行了定量归因分析,气候反馈响应分析表明,水汽反馈和二氧化碳强迫是主要的增暖驱动力,分别贡献了4.92 ℃和2.42 ℃。地表热存储和云反馈也对增暖有显著正贡献,而地表感热通量和潜热通量则表现出降温效应。在不确定性分析中,云短波辐射效应、地表感热通量和地表热存储是主要的不确定性来源,这些不确定性主要来自模式在云层物理、地表能量平衡和热量再分配方面的差异,未来研究应重点关注这些过程以提高区域气候变化预估的准确性。Abstract: Based on simulations from 18 climate models participating in the Coupled Model Intercomparison Project Phase 6 (CMIP6), this study uses the piControl experiment as a reference for a base climate state and the abrup-4 × CO2 experiment to simulate the climate response under an extreme greenhouse gas forcing scenario. The Climate Feedback Response Analysis Method (CFRAM) was employed to quantitatively evaluate the contributions of external forcings, various radiative feedback processes, and non-radiative processes to the warming over Guangdong Province and the associated uncertainties. The results show that the projected warming over Guangdong varies across models with an estimated range of 3.71 ℃ to 7.07 ℃, and a robust estimate centered between 4.42 ℃ and 5.40 ℃. The warming is most pronounced in the western and northern regions of the province. A quantitative attribution analysis of the multi-model ensemble mean indicates that water vapor feedback and CO2 forcing are the primary drivers of the projected warming, contributing 4.92 ℃ and 2.42 ℃, respectively. Surface heat storage and cloud feedback also provide significant positive contributions to the warming, while surface sensible heat flux and latent heat flux contribute to a cooling effect. Uncertainty analysis reveals that cloud shortwave radiative effects, surface sensible heat flux, and surface heat storage are the main sources of uncertainty, stemming primarily from differences in model representations of cloud physics, surface energy balance, and heat redistribution. Future research to improve the accuracy of regional climate projections should focus on better constraining these key processes.
-
Key words:
- carbon dioxide /
- surface temperature /
- climate feedback /
- CMIP6 /
- uncertainty
-
表 1 18个CMIP6模式的基本信息
序号 模式 分辨率 1 BCC-CSM2-MR 320×160 2 FGOALS-g3 180×90 3 MPI-ESM-1-2-HAM 192×96 4 NorESM2-MM 288×192 5 FGOALS-f3-L 360×180 6 CMCC-CM2-SR5 288×192 7 MPI-ESM1-2-LR 192×96 8 GFDL-ESM4 360×180 9 CMCC-ESM2 288×192 10 GFDL-CM4 360×180 11 IPSL-CM6A-LR 144×143 12 CESM2-WACCM-FV2 144×96 13 TaiESM1 288×192 14 CESM2-FV2 288×192 15 NorESM2-LM 144×96 16 SAM0-UNICON 288×192 17 CESM2-WACCM 288×192 18 CESM2 288×192  下载: 导出CSV
-
[1] Yang L, Zhao S, Liu S. Urban environments provide new perspectives for forecasting vegetation phenology responses under climate warming[J]. Global Change Biology, 2023, 29(15): 4 383-4 396. [2] Tian C, Yue X, Zhu J, et al. Projections of fire emissions and the consequent impacts on air quality under 1.5℃ and 2℃ global warming[J]. Environmental Pollution, 2023, 323(9): 121311. [3] Ji Y, Fu J, Lu Y, et al. Three-dimensional-based global drought projection under global warming tendency[J]. Atmospheric Research, 2023, 291(11): 106812. [4] Mukherjee S, Mishra A K, Ashfaq M, et al. Relative effect of anthropogenic warming and natural climate variability to changes in compound drought and heatwaves[J]. Journal of Hydrology, 2022, 605(24): 127396. [5] Li H, Wu Y, Chen J, et al. Responses of soil organic carbon to climate change in the Qilian Mountains and its future projection[J]. Journal of Hydrology, 2021, 596(156): 126110. [6] Yuan F, Wang Y, Ricciuto D M, et al. Hydrological feedbacks on peatland CH4 emission under warming and elevated CO2: A modeling study[J]. Journal of Hydrology, 2021, 603(12): 127137. [7] Liu L, Zhang X. Effects of temperature variability and extremes on spring phenology across the contiguous United States from 1982 to 2016[J]. Scientific Reports, 2020, 10(1): 17952. [8] Zhang W, Zhou T. Significant increases in extreme precipitation and the associations with global warming over the global land monsoon regions[J]. Journal of Climate, 2019, 32(24): 8 465-8 488. [9] Wang X, Li Y, Wang M, et al. Changes in daily extreme temperature and precipitation events in mainland China from 1960 to 2016 under global warming[J]. International Journal of Climatology, 2020, 41(2): 1 465-1 483. [10] IPCC. Summary for policymakers[M]. Climate Change 2021: The Physical Science Basis. Contribution of Working Group Ⅰ to the Sixth Assessment Report of the Intergovernmental Panel on Climate Change. Cambridge: Cambridge University Press, 2021. [11] 黄珍珠, 张锦华, 时小军, 等. 全球变暖与广东气候带变化[J]. 热带地理, 2008, 28(4): 302-305, 330. [12] 张柳红, 杜尧东, 杜家铭. 气候变化对广东省香蕉种植气候适宜性的影响[J]. 生态学杂志, 2024, 43(09): 2 802-2 812. [13] 杜晓阳, 张柳红, 邓玉娇. 气候变化对广东省荔枝种植气候区划的影响[J]. 生态学杂志, 2022, 41(10): 1 998-2 007. [14] Zhao B, An D, Yan C, et al. Spatiotemporal variations of reference evapotranspiration and its climatic driving factors in Guangdong, a humid subtropical Province of South China[J]. Agronomy, 2023, 13(6): 1446. [15] Zhou X, Xie B, Zhang H, et al. Decomposition of Fast and Slow Cloud Responses to Quadrupled CO2 Forcing in BCC-AGCM2.0 over East Asia[J]. Advances in Atmospheric Sciences, 2022, 39(12): 2 188-2 202. [16] Heede U, Fedorov A. Eastern equatorial Pacific warming delayed by aerosols and thermostat response to CO2 increase[J]. Nature Climate Change, 2021, 11(8): 696-703. [17] Duan Y, Wu P, Chen X, et al. Assessing global warming induced changes in summer rainfall variability over Eastern China using the latest hadley centre climate model HadGEM3-GC2[J]. Advances in Atmospheric Sciences, 2018, 35(8): 1 077-1 093. [18] Kong Y, Wu Y, Hu X, et al. Uncertainty in projections of the South Asian summer monsoon under global warming by CMIP6 models: Role of tropospheric meridional thermal contrast[J]. Atmospheric and Oceanic Science Letters, 2022, 15(1): 100145. [19] Hu X, Liu Y, Kong Y, et al. A quantitative analysis of the source of inter-model spread in Arctic surface warming response to increased CO2 concentration[J]. Geophysical Research Letters, 2022, 49(18): e2022GL100034. [20] Moon M, Ha K J, Kim D, et al. Rainfall strength and area from landfalling tropical cyclones over the North Indian and western North Pacific oceans under increased CO2 conditions[J]. Weather and Climate Extremes, 2023, 41(3): 100581. [21] 翟盘茂, 周佰铨, 陈阳, 等. 气候变化科学方面的几个最新认知[J]. 气候变化研究进展, 2021, 17(6): 629-635. [22] 周天军, 陈梓明, 陈晓龙, 等. IPCC AR6报告解读: 未来的全球气候——基于情景的预估和近期信息[J]. 气候变化研究进展, 2021, 17(6): 652-663. [23] Li W, Wu Y, Hu X. The processes-based attributes of four major surface melting events over the antarctic ross ice shelf[J]. Advances in Atmospheric Science, 2023, 40(9): 1 662-1 670. [24] Fan H, Hu X, Yang S, et al. Process-based analysis of relative contributions to the multi-model warming projection over East Asia[J]. Climate Dynamics, 2021, 56(9-10): 1-19. [25] Zhang S, Chen J. Uncertainty in projection of climate extremes: A Comparison of CMIP5 and CMIP6[J]. Journal of Meteorological Research, 2021, 35(5): 646-662. [26] Lehner F, Deser C, Maher N, et al. Partitioning climate projection uncertainty with multiple large ensembles and CMIP5/6[J]. Earth System Dynamics, 2020, 11(2): 491-508. [27] Fan X, Miao C, Duan Q, et al. The performance of CMIP6 versus CMIP5 in simulating temperature extremes over the global land surface[J]. Journal of Geophysical Research: Atmosphere, 2020, 125(18): e2020JD033031. [28] Zelinka M D, Myers T A, Mccoy D T, et al. Causes of higher climate sensitivity in CMIP6 models[J]. Geophysical Research Letters, 2020, 47(1): e2019GL085782. [29] Hu X, Fan H, Cai M, et al. A less cloudy picture of the inter-model spread in future global warming projections[J]. Nature Communications, 2020, 11(1): 4472. [30] Yang X, Zhou B, Xu Y, et al. CMIP6 evaluation and projection of temperature and precipitation over China[J]. Advances in Atmospheric Sciences, 2021, 38(5): 817-830. [31] Wu Y, Yang S, Hu X, et al. Process-based attribution of long-term surface warming over the Tibetan Plateau[J]. International Journal of Climatology, 2020, 40(15): 6 410-6 422. [32] 陈红. CMIP6模式对欧亚大陆冬季降水模拟能力评估及未来预估[J]. 气象学报, 2020, 78(4): 657-671. [33] 徐杰. 全球变暖背景下中国海域风速变化的季节性及长期变化趋势分析及风资源评估[J]. 地球科学进展, 2021, 36(8): 868-878. [34] Lafferty D C, Sriver R L. Downscaling and bias-correction contribute considerable uncertainty to local climate projections in CMIP6[J]. npj Climate and Atmospheric Science, 2023, 6(1): 158. [35] Deser C, Phillips A, Bourdette V, et al. Uncertainty in climate change projections: the role of internal variability[J]. Climate Dynamics, 2012, 38(3-4): 527-546. [36] Cai M, Lu J. A new framework for isolating individual feedback processes in coupled general circulation climate models. Part Ⅱ: method demonstrations and comparisons[J]. Climate Dynamics, 2009, 32(6): 887-900. [37] Lu J, Cai M. A new framework for isolating individual feedback processes in coupled general circulation climate models. Part Ⅰ: formulation[J]. Climate Dynamics, 2009, 32(6): 873-885. -

 点击查看大图
图(7) / 表(1)
计量
- 文章访问数: 1
- HTML全文浏览量: 1
- PDF下载量: 0
- 被引次数: 0
 粤公网安备 4401069904700003号