



Evaluation of the 10m Wind Speed over China Based on CMIP6 GCM
-
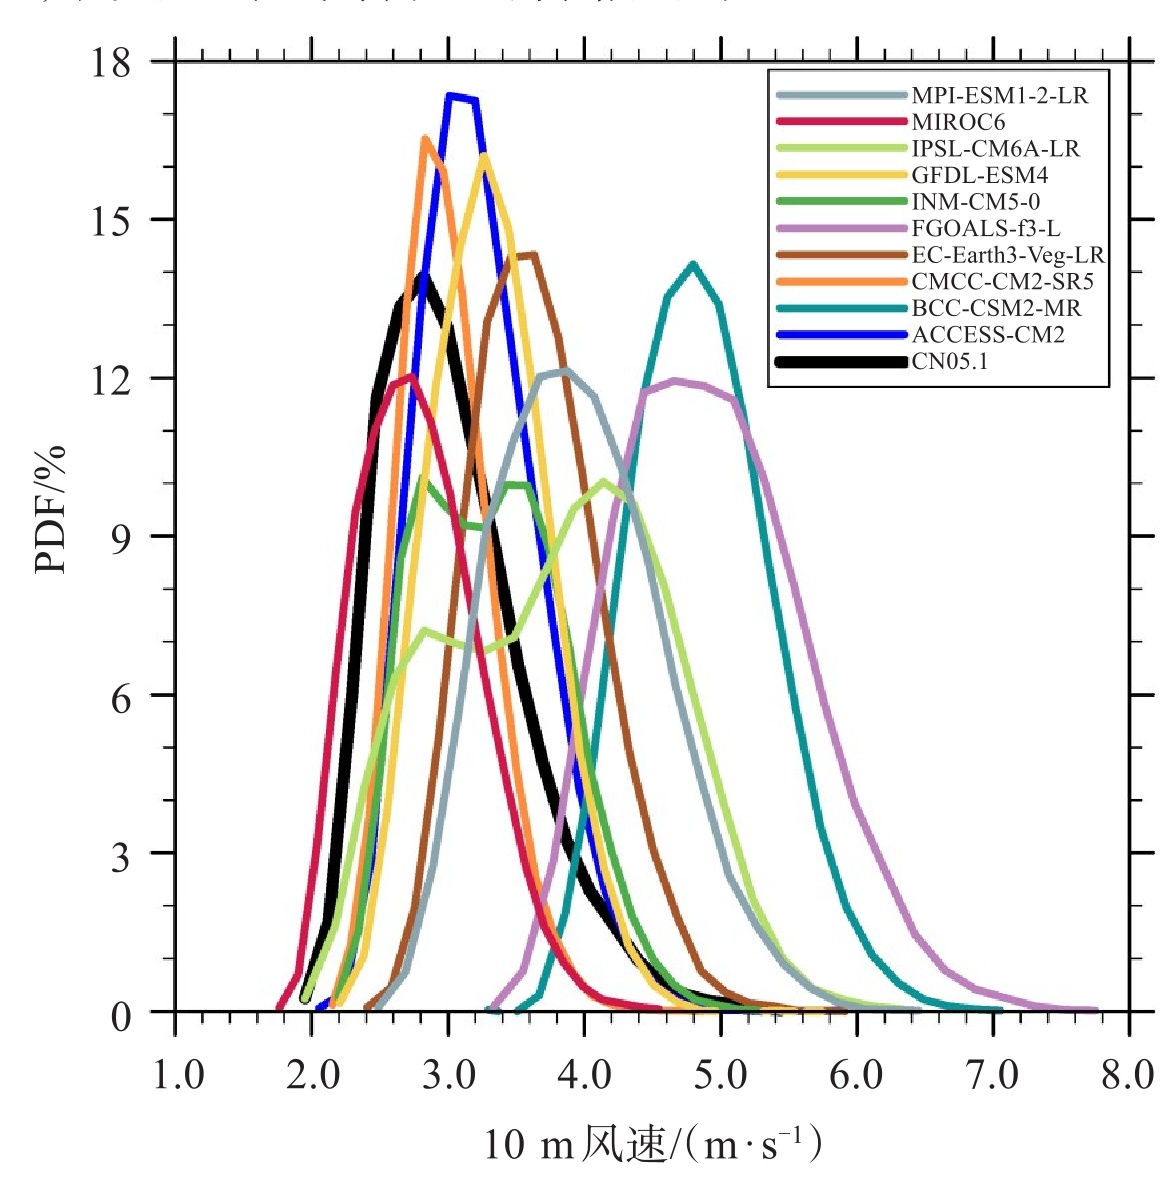
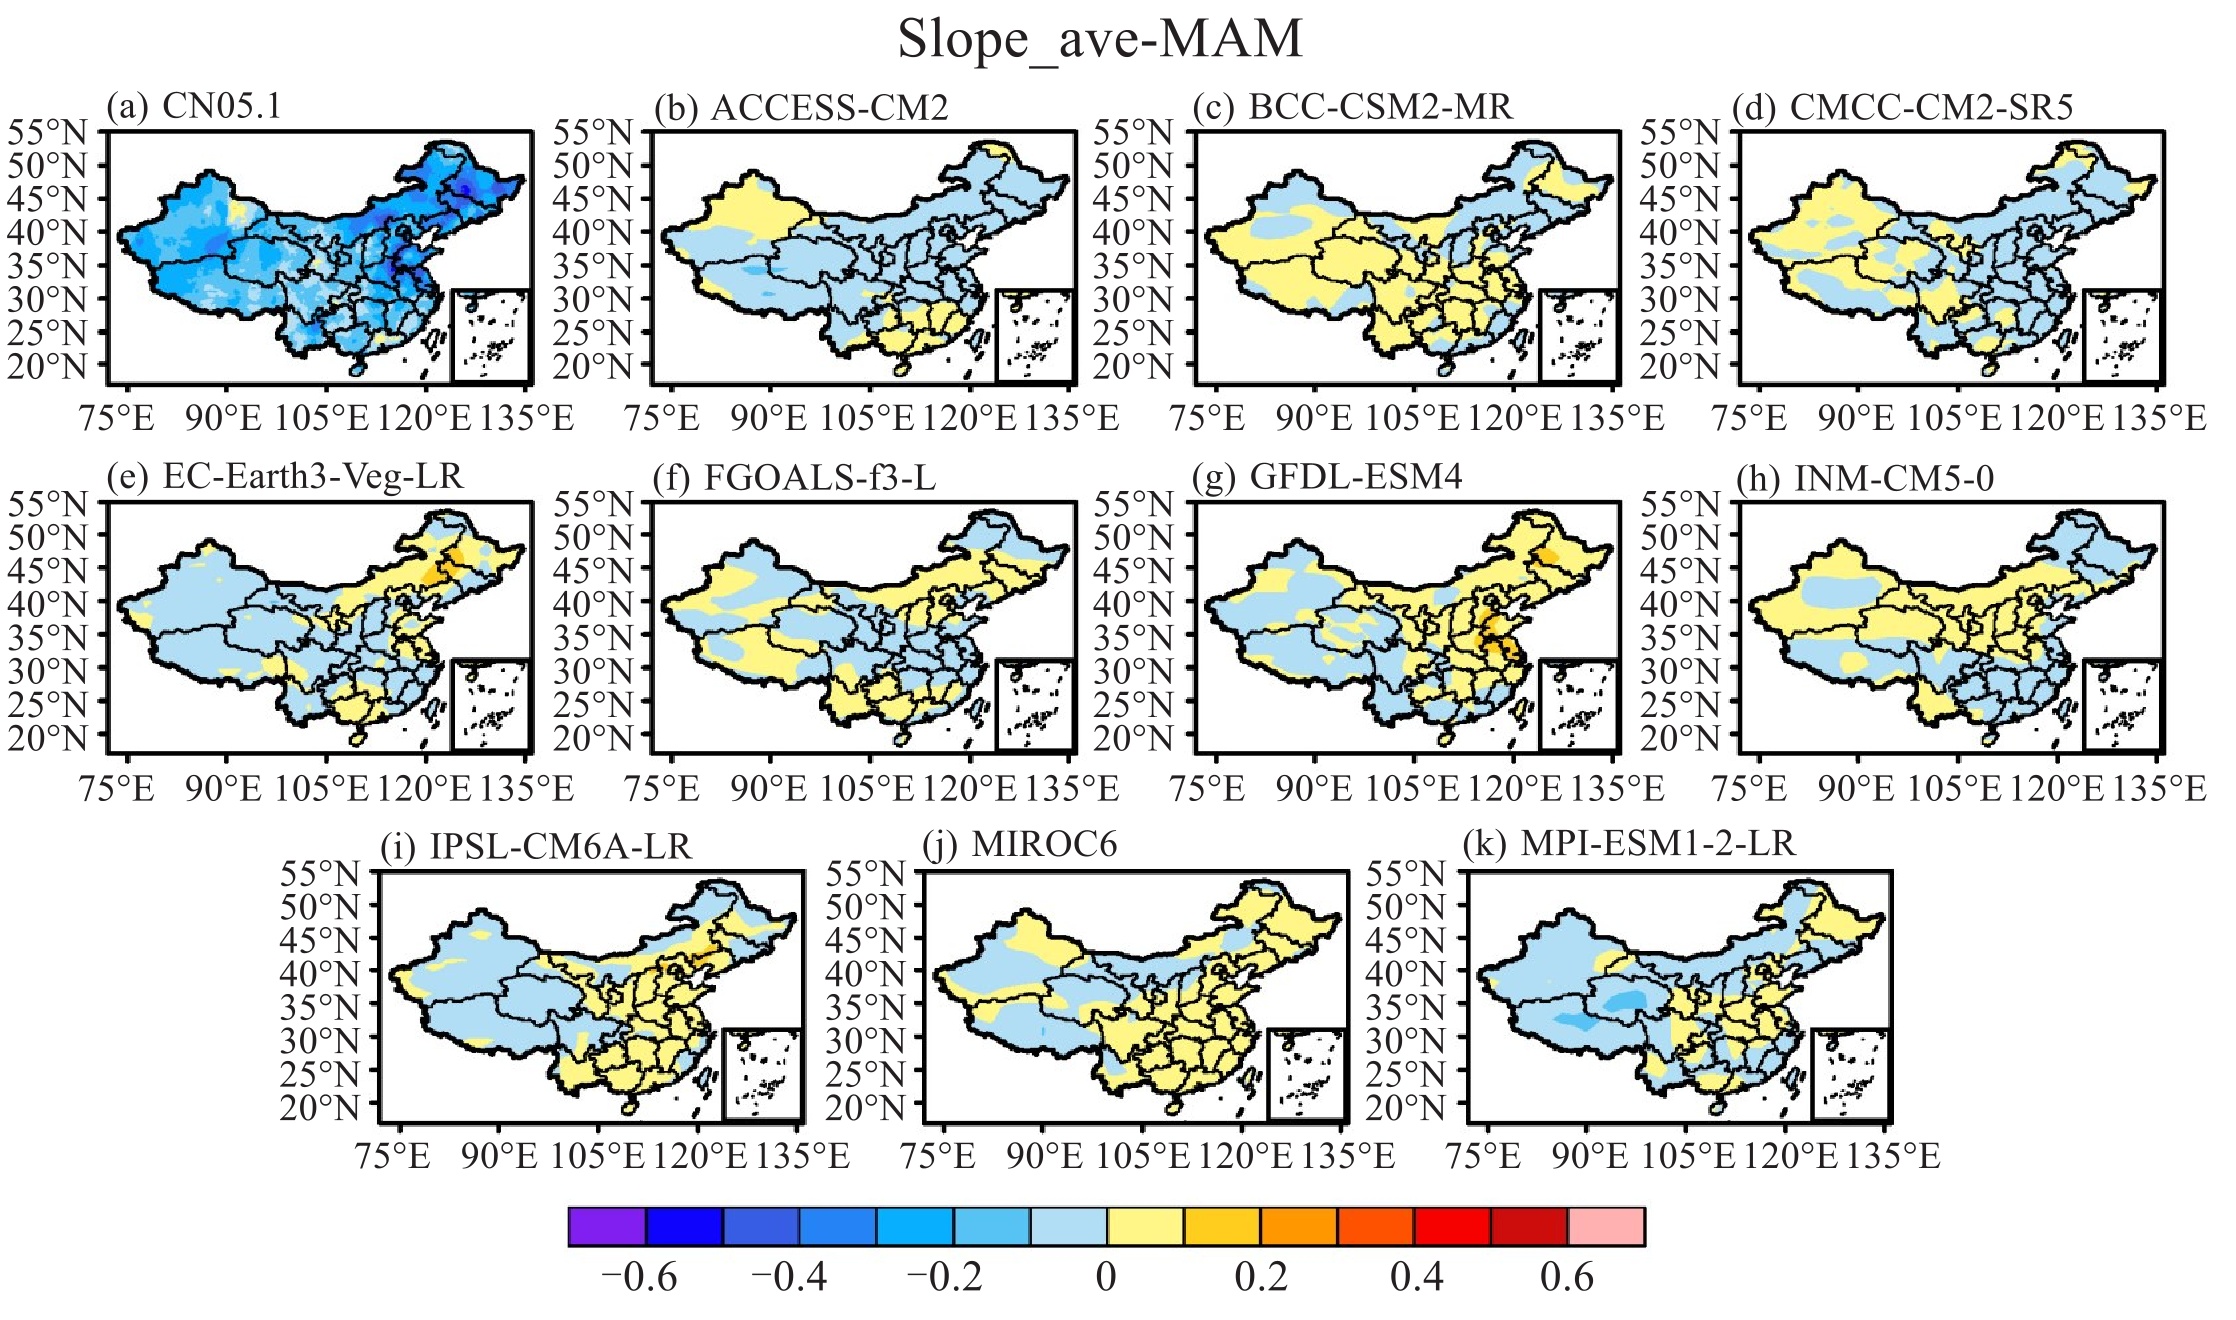
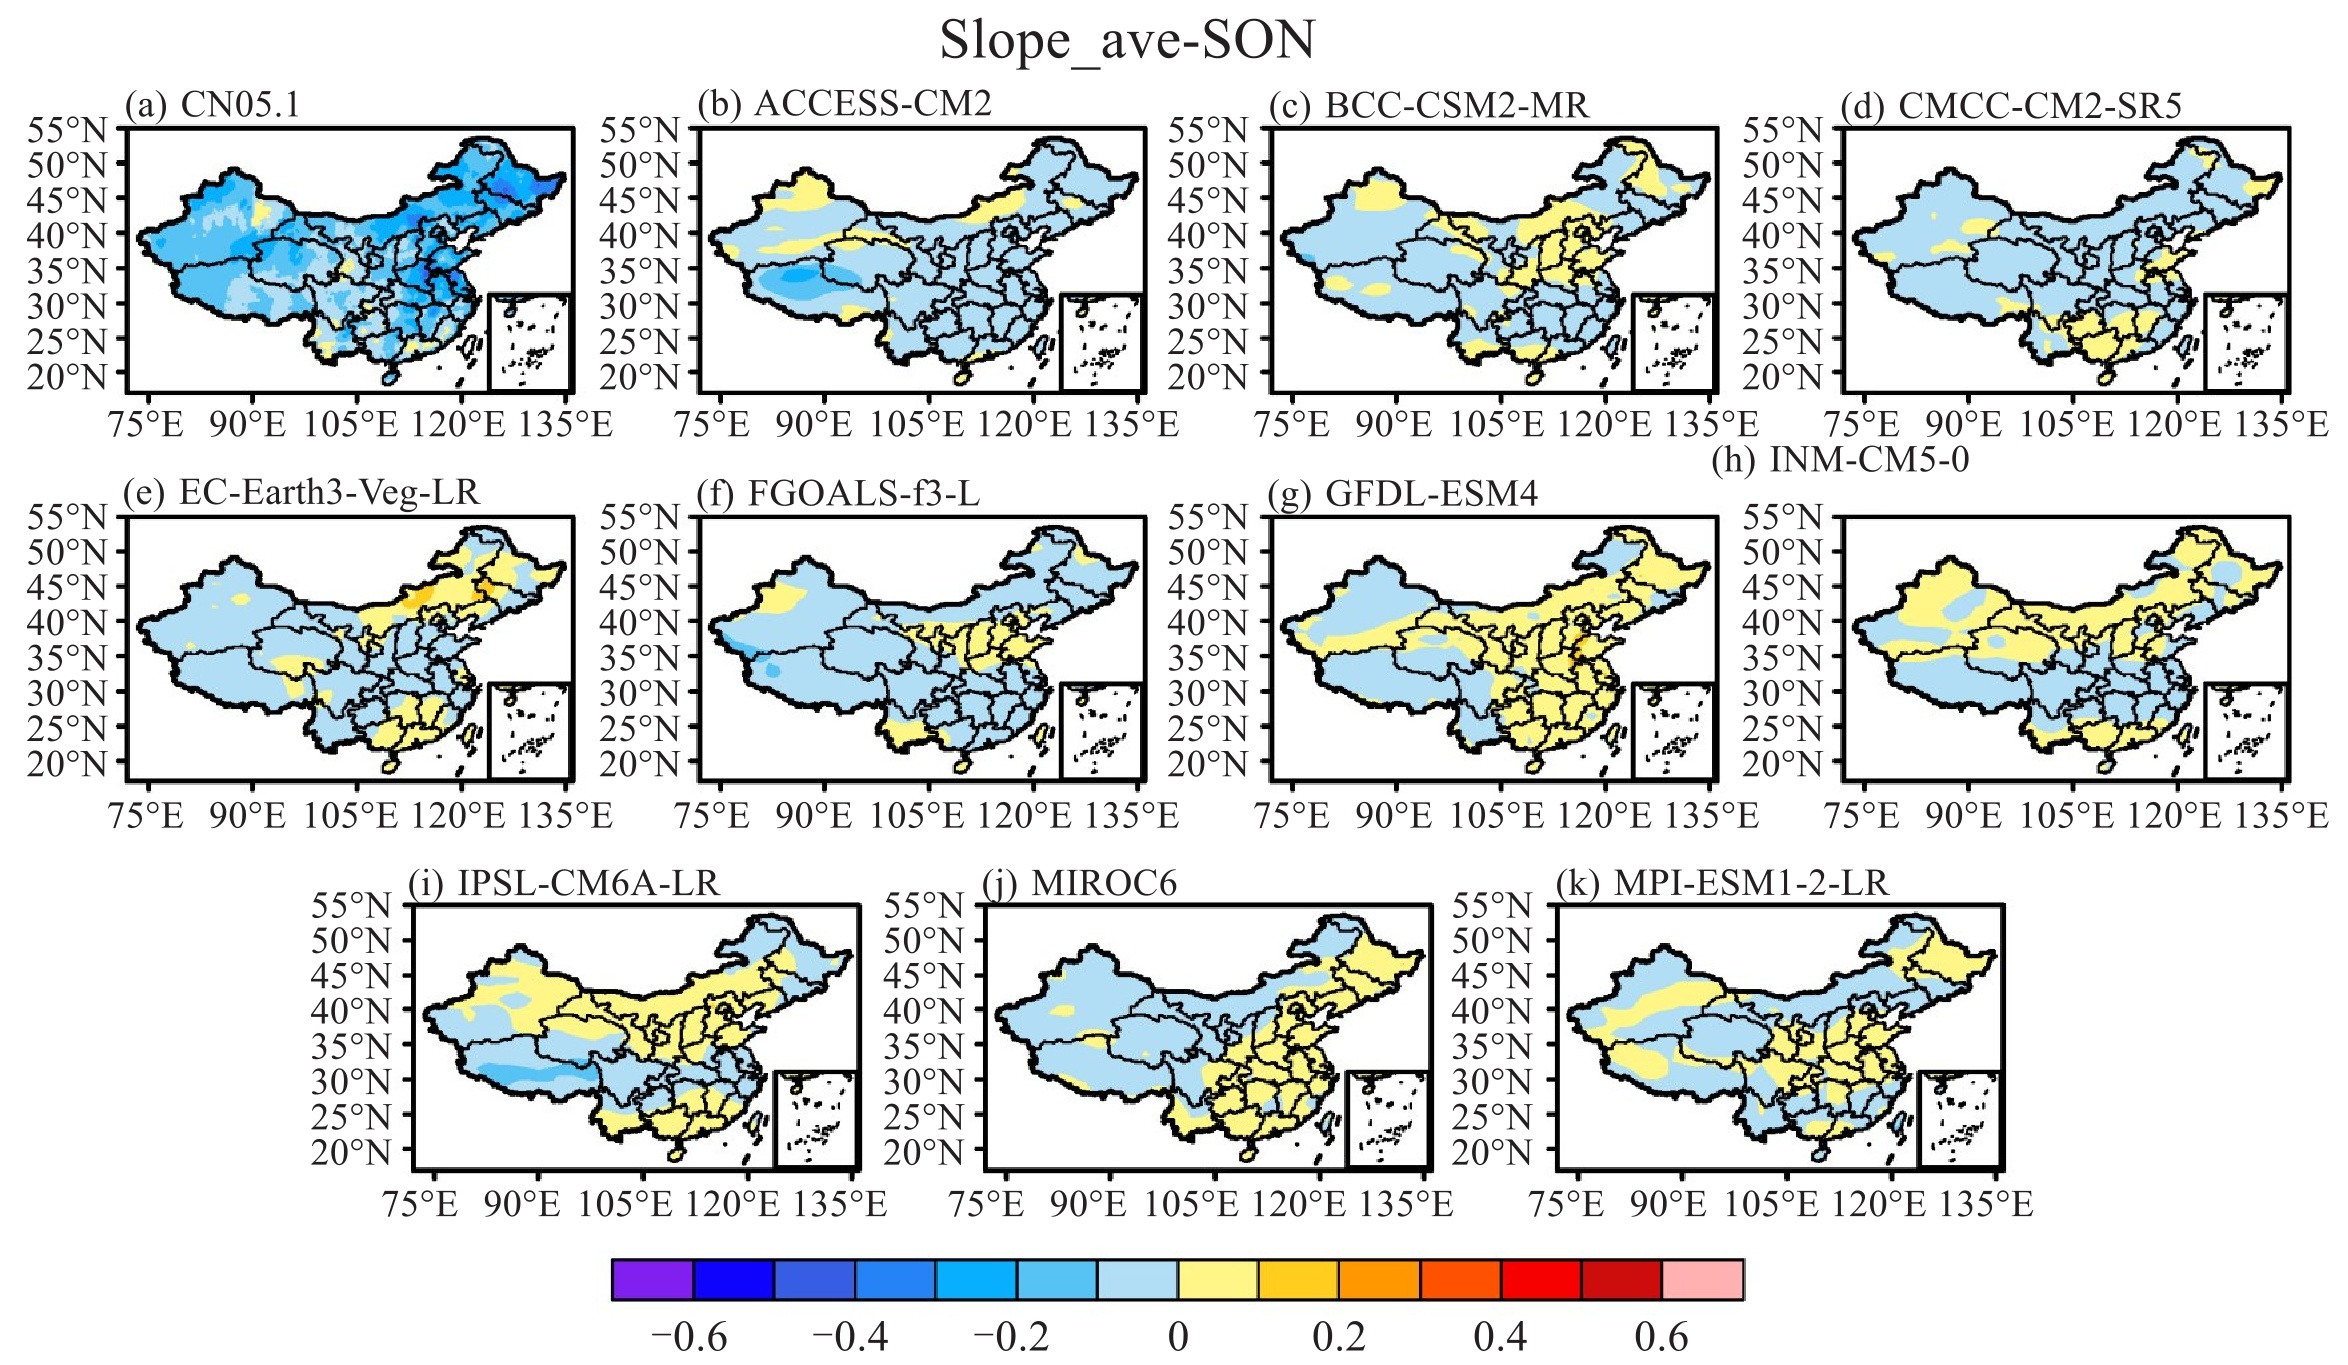
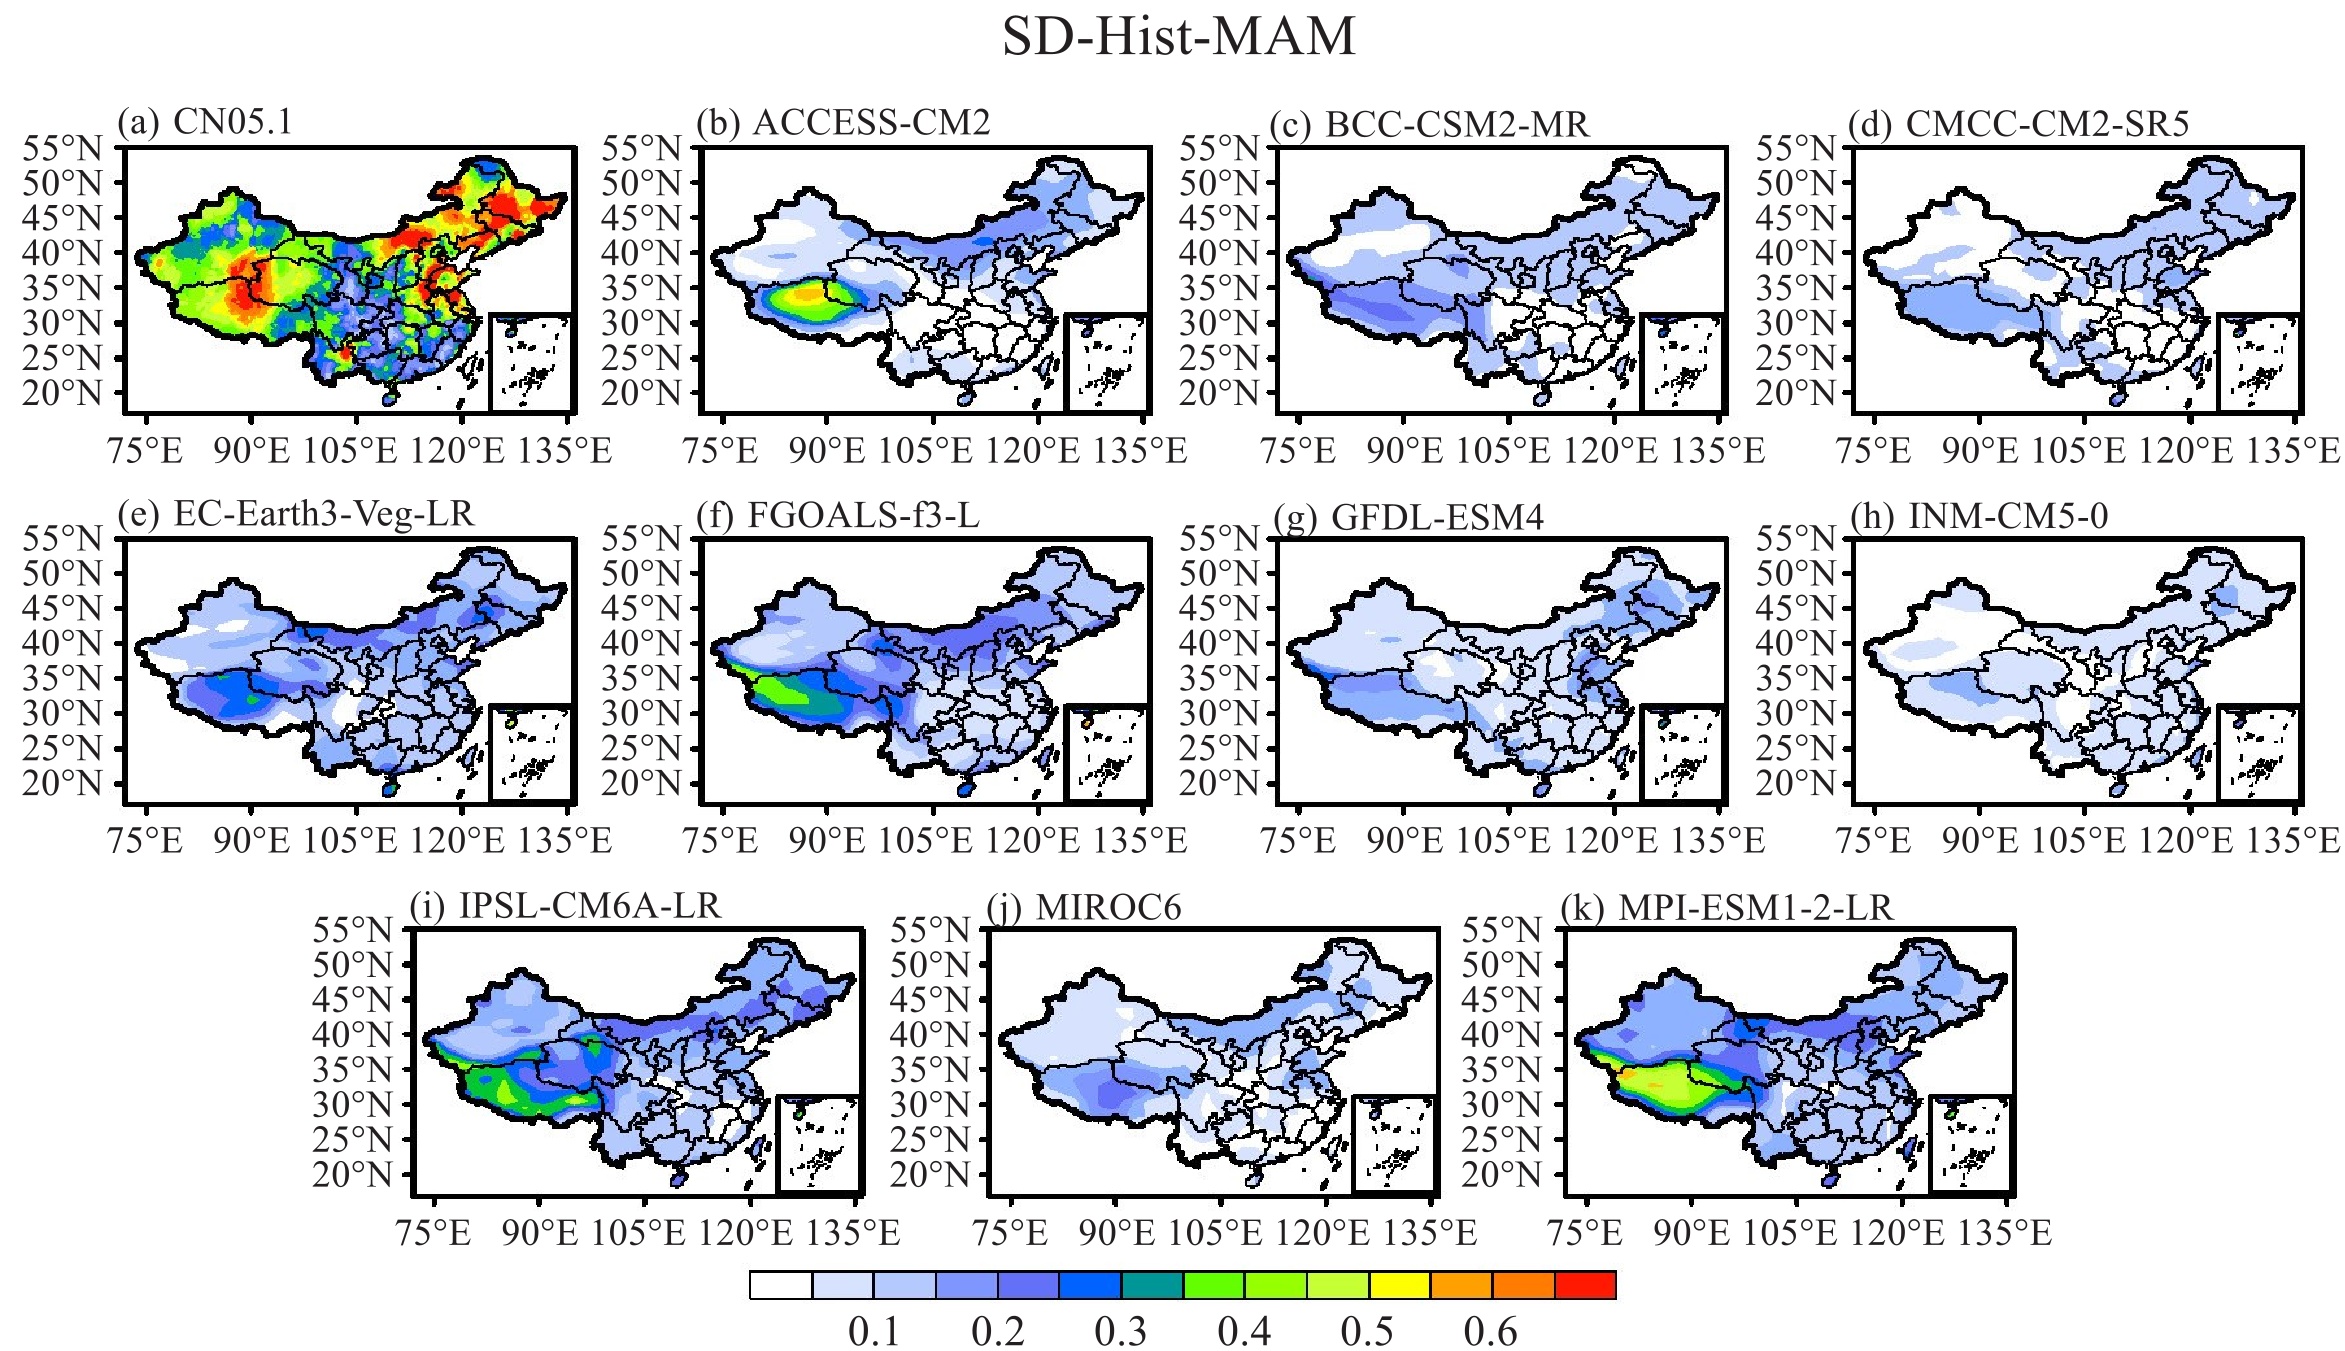
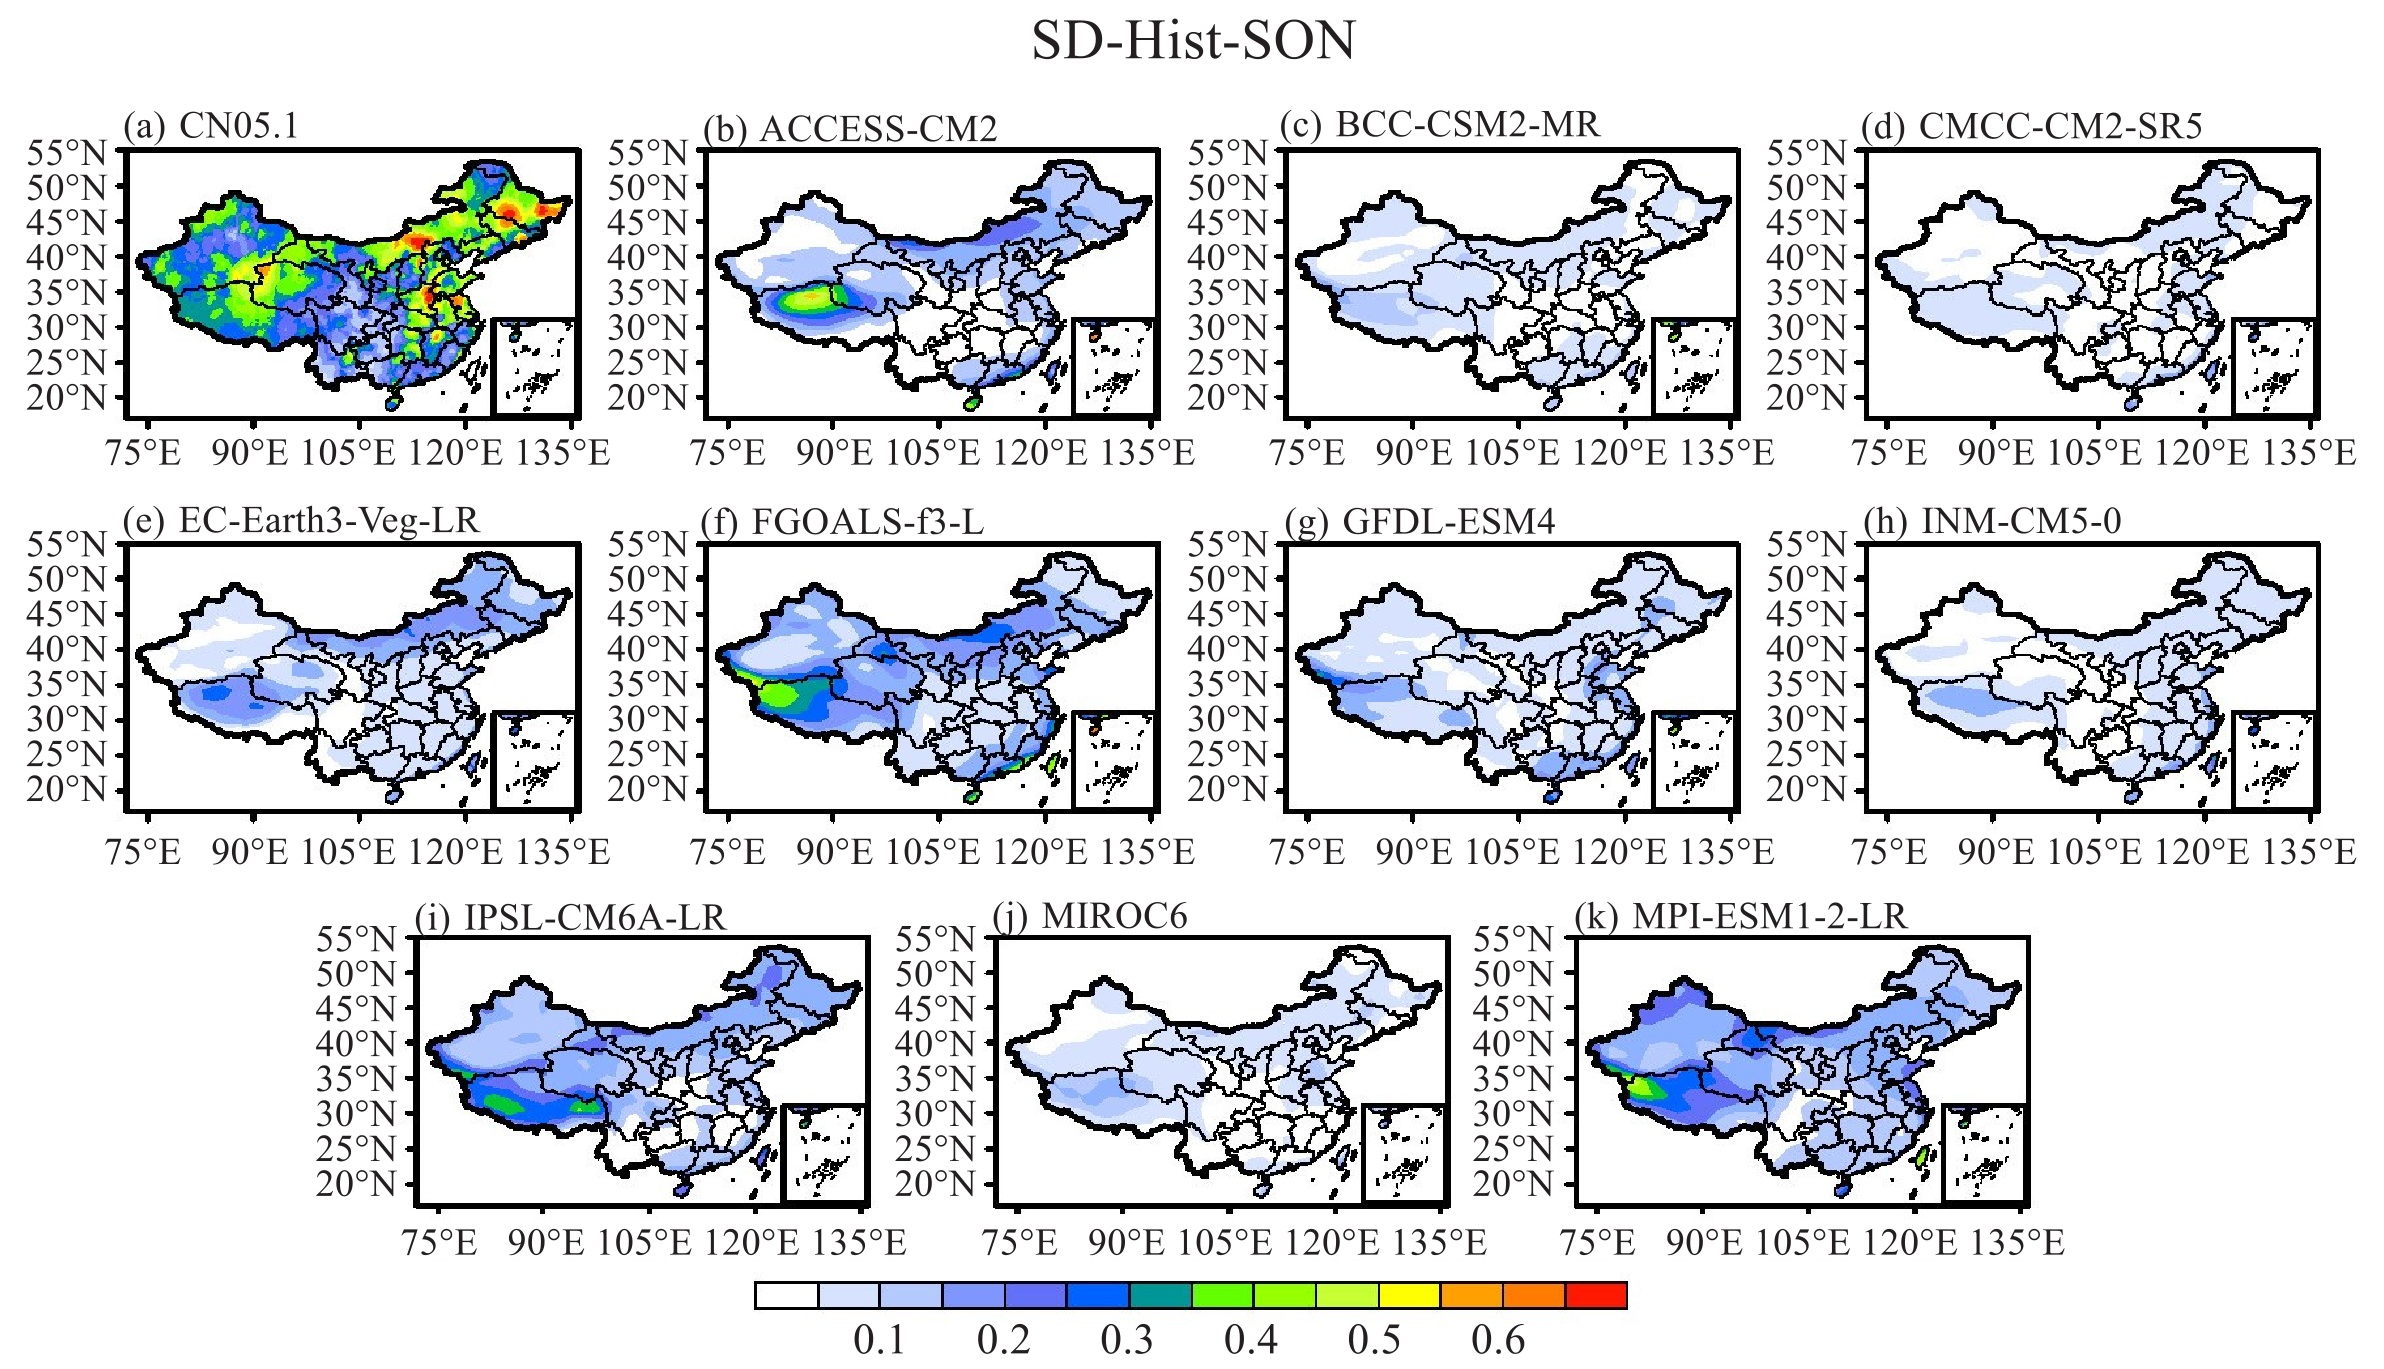
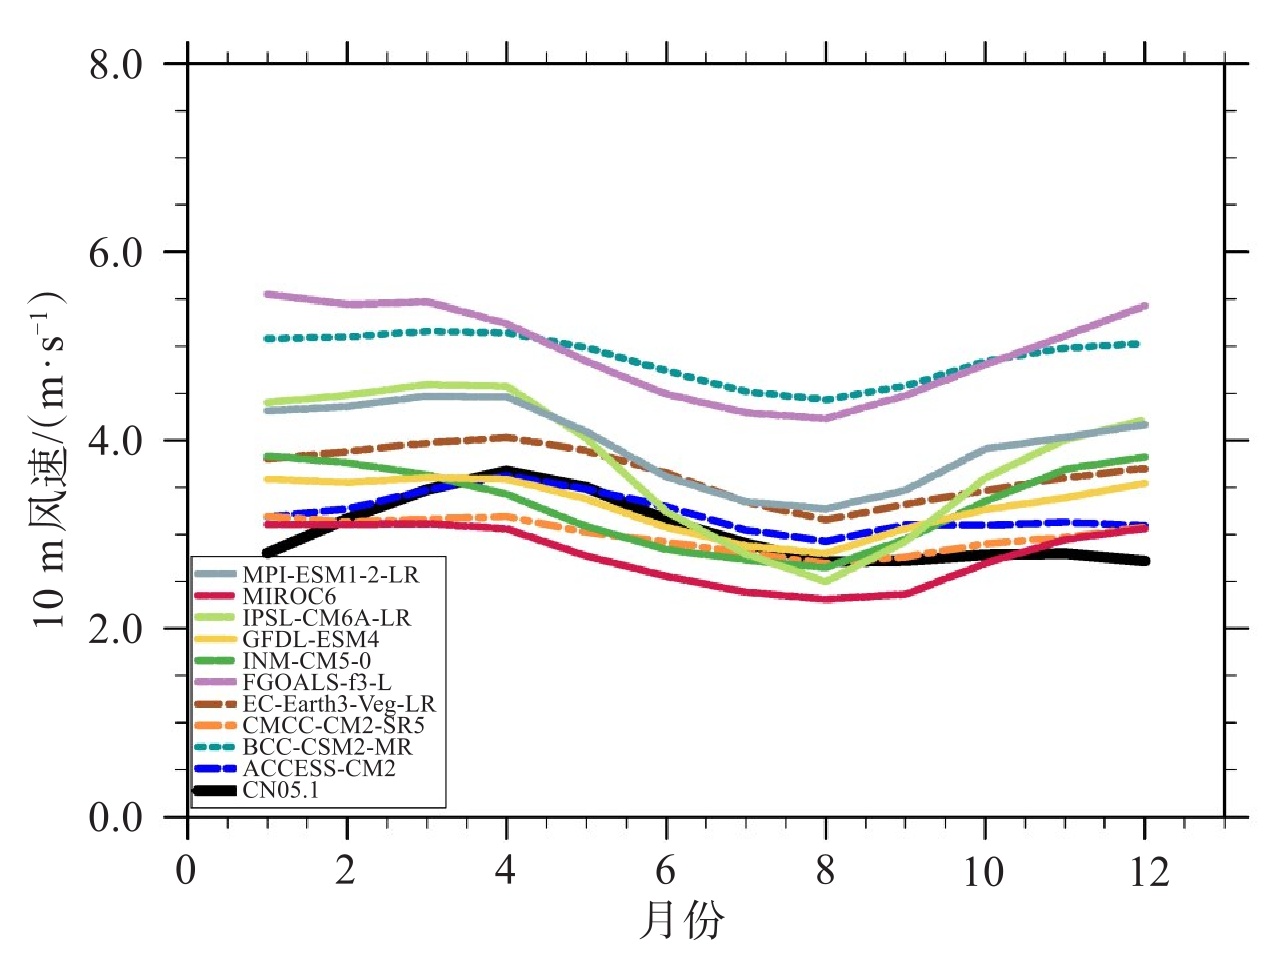
摘要: 风速的准确模拟对风电和太阳能等新能源领域未来发展布局具有重要指导意义,但目前全球气候模式对风速的模拟能力有限。基于国家基准台站观测资料,评估了第六次国际耦合模式比较计划(Coupled Model Intercomparison Project Phase 6, CMIP6)的十个全球气候模式(Global Climate Model, GCM)对中国大陆10 m风速1961—2014年的时空分布特征的模拟能力。评估结果显示,在气候态特征上,十个CMIP6 GCM均能模拟出1961—2014年时期我国10 m风速春季最大、秋季最小的气候态季节变化特征,大多数模式存在全年系统性高估现象,尤其是BCC-CSM2-MR和FGOALS-f3-L模式。在年际变率上,十个CMIP6模式也均能再现我国风速年平均和季节平均的年际变率空间分布特征,但是量值较观测偏小。在年代际趋势上,十个模式中有九个可以模拟出中国区域平均的年均风速在1961—2014年期间的减弱趋势,但减弱趋势要较观测明显偏小1个量级,只有GFDL-ESM4模式对于变化趋势的模拟与观测相反是增强的。因此,深入剖析CMIP6模式对中国10 m风速模拟的优势与不足,对准确预估风资源变化、合理开发风能及制定能源战略具有重要现实意义。Abstract: Accurate simulation of wind speed is of significant guiding importance for the future development layout of new energy sectors such as wind and solar power. However, current global climate models exhibit limitations in their ability to simulate wind speeds. Based on CN05.1 high-resolution gridded observations from national benchmark stations, this study evaluates the capability of ten Global Climate Models (GCMs) from the Coupled Model Intercomparison Project Phase 6 (CMIP6) in simulating the spatiotemporal distribution characteristics of 10-meter wind speeds over mainland China during 1961—2014. Results show that all ten CMIP6 GCMs can capture the climatological seasonal variation of 10-meter wind speeds over China, with maximum speeds in spring and minimum speeds in autumn during the period from 1961 to 2014. However, most models exhibit a systematic overestimation throughout the year, particularly the BCC-CSM2-MR and FGOALS-f3-L models. These ten CMIP6 models are also capable of reproducing the spatial distribution characteristics of the interannual variability of annual and seasonal mean wind speeds over China, although the simulated values are generally smaller than the observed values. In simulating the decadal trends of 10-meter wind speeds from 1961 to 2014, only some of the ten CMIP6 GCMs could capture the weakening trend of annual and seasonal mean 10-meter wind speeds over most regions of China during this period. Moreover, the simulated weakening trends are significantly smaller than the observed trends, and over some regions, the models even fail to simulate the weakening trend, instead showing an increasing trend, which is contrary to the observations. The uncertainties in historical climate simulations also lead to considerable uncertainties in future climate change projections. Therefore, to obtain more reliable future scenario projections, it is essential to apply bias corrections to the model simulations and projections.
-
Key words:
- 10-meter wind speeds /
- CMIP6 /
- bias distribution /
- GCM
-

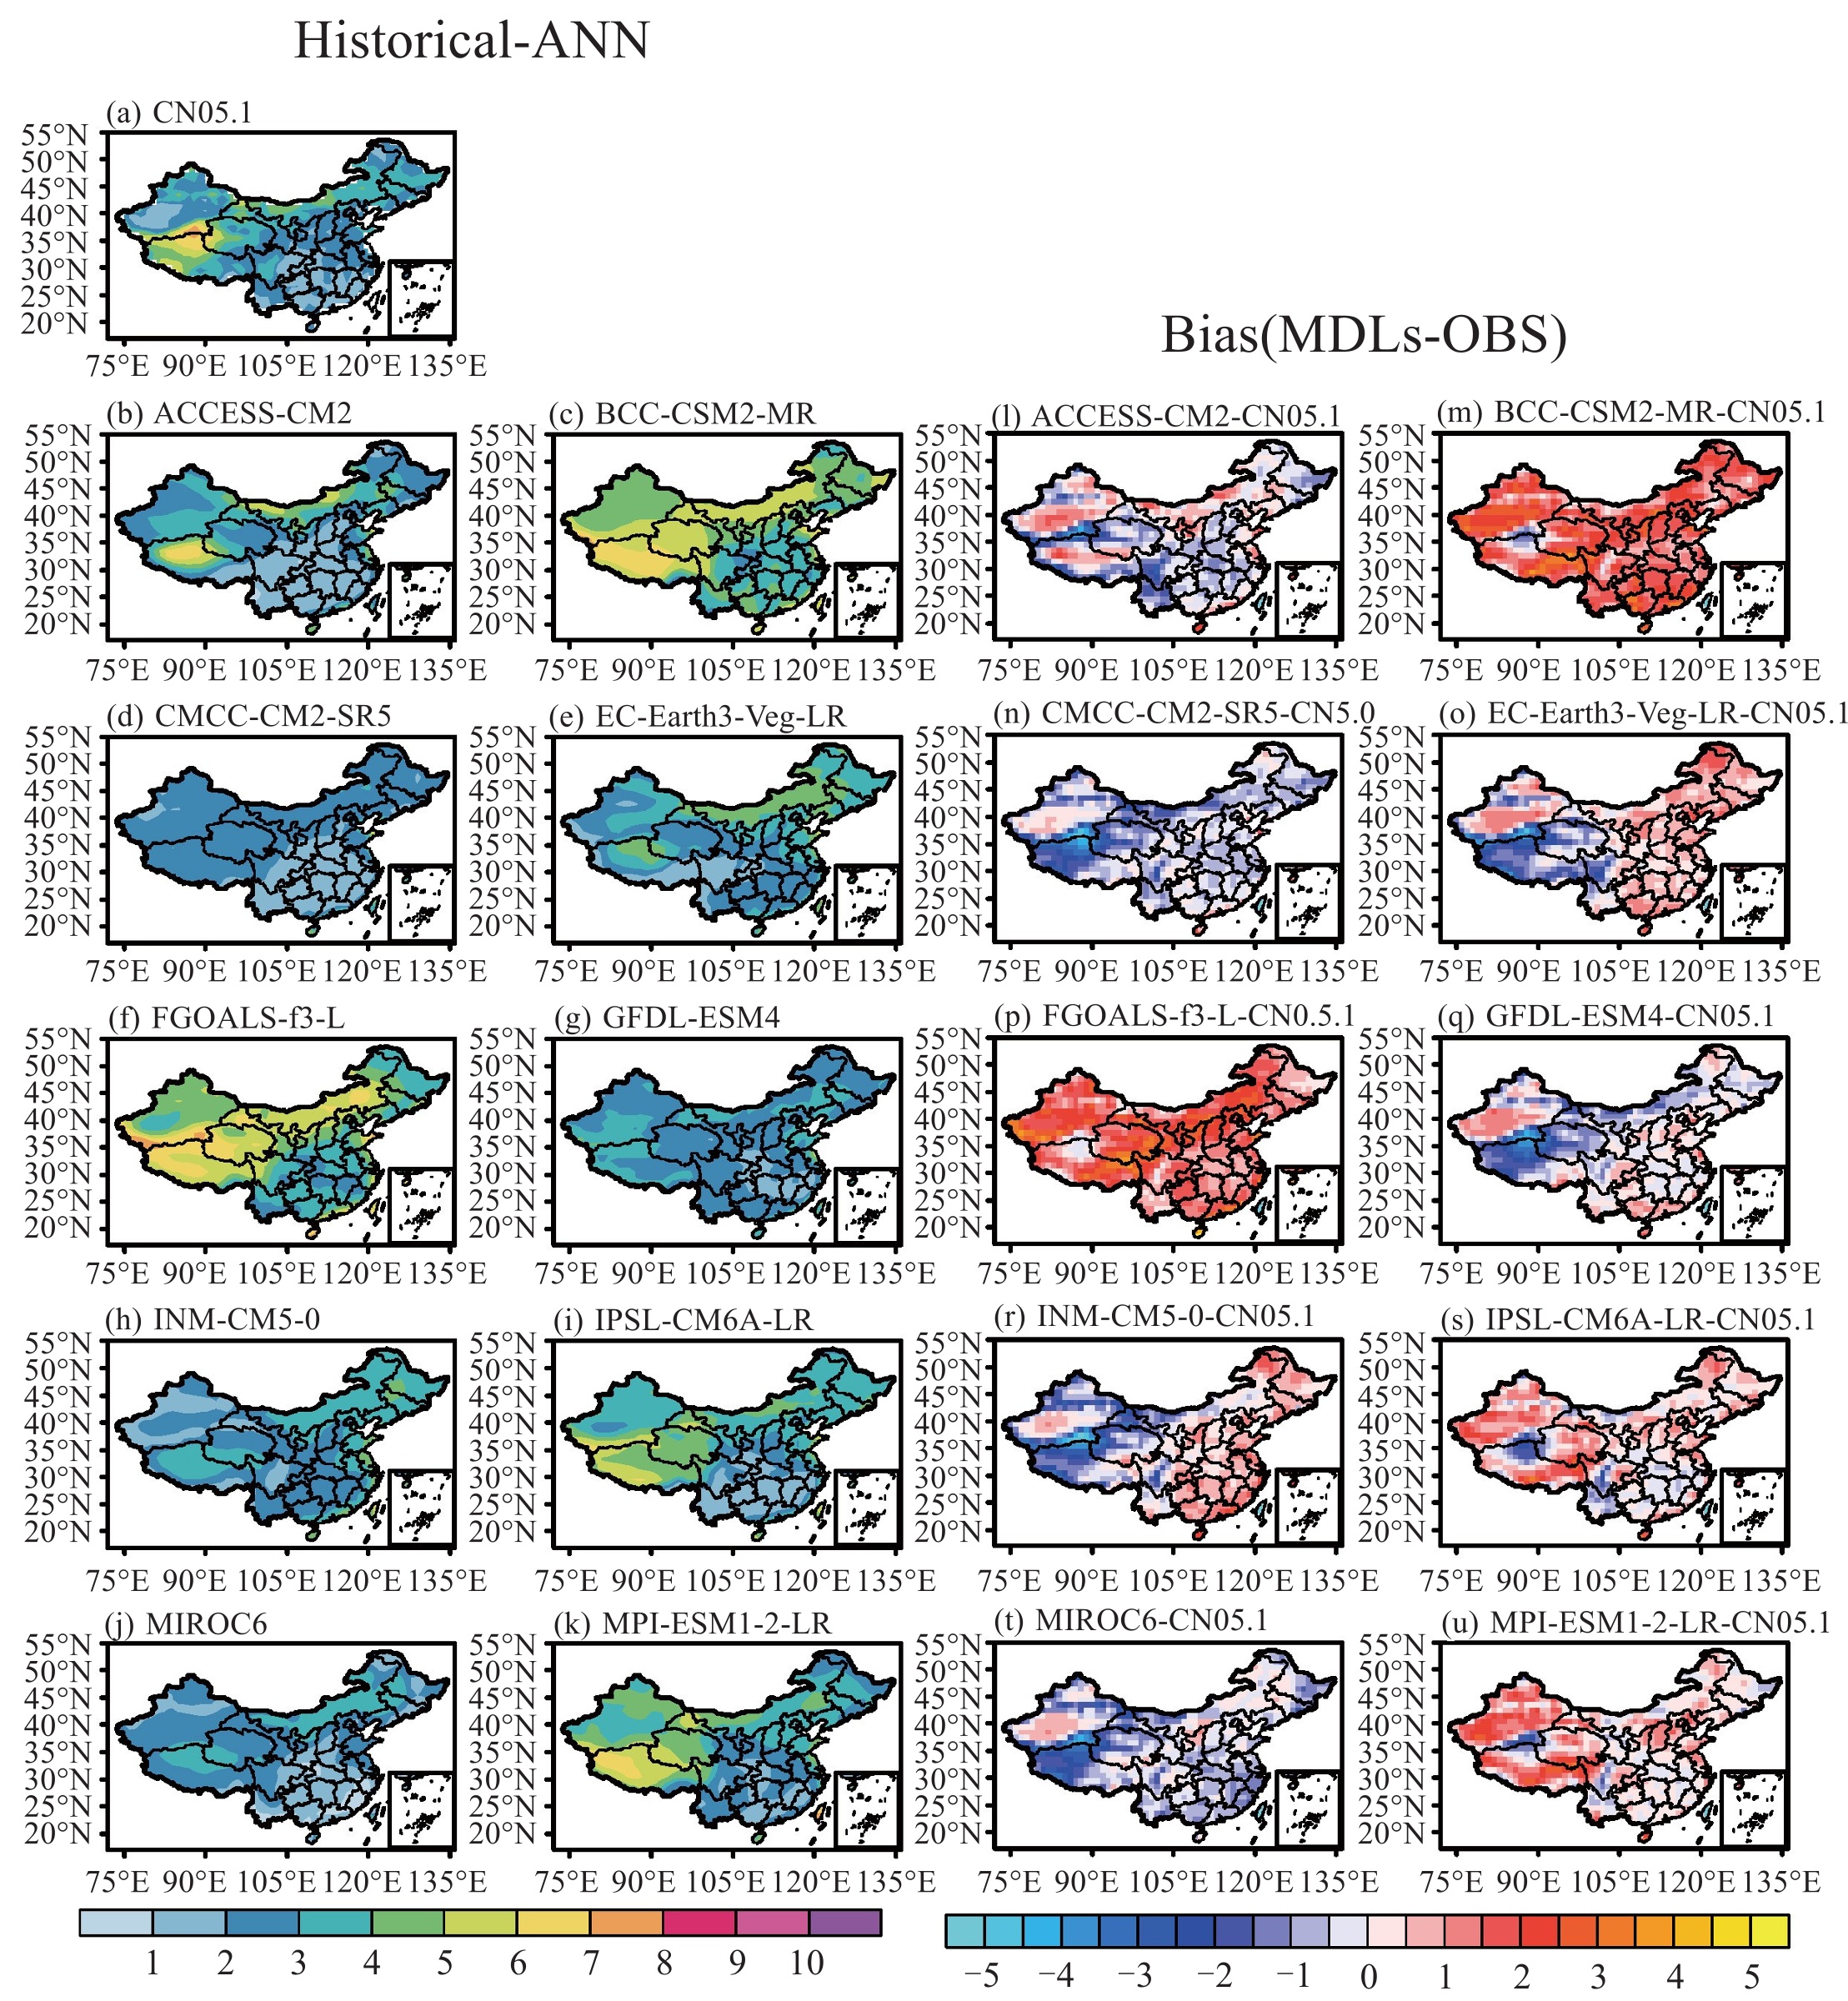
图 3 1961—2014年年平均10 m风速分布及CMIP6模式与观测的偏差(单位:m·s-1)
左边两列(a~k)为气候平均,右边两列(l~u)为CMIP6模式与观测的偏差。

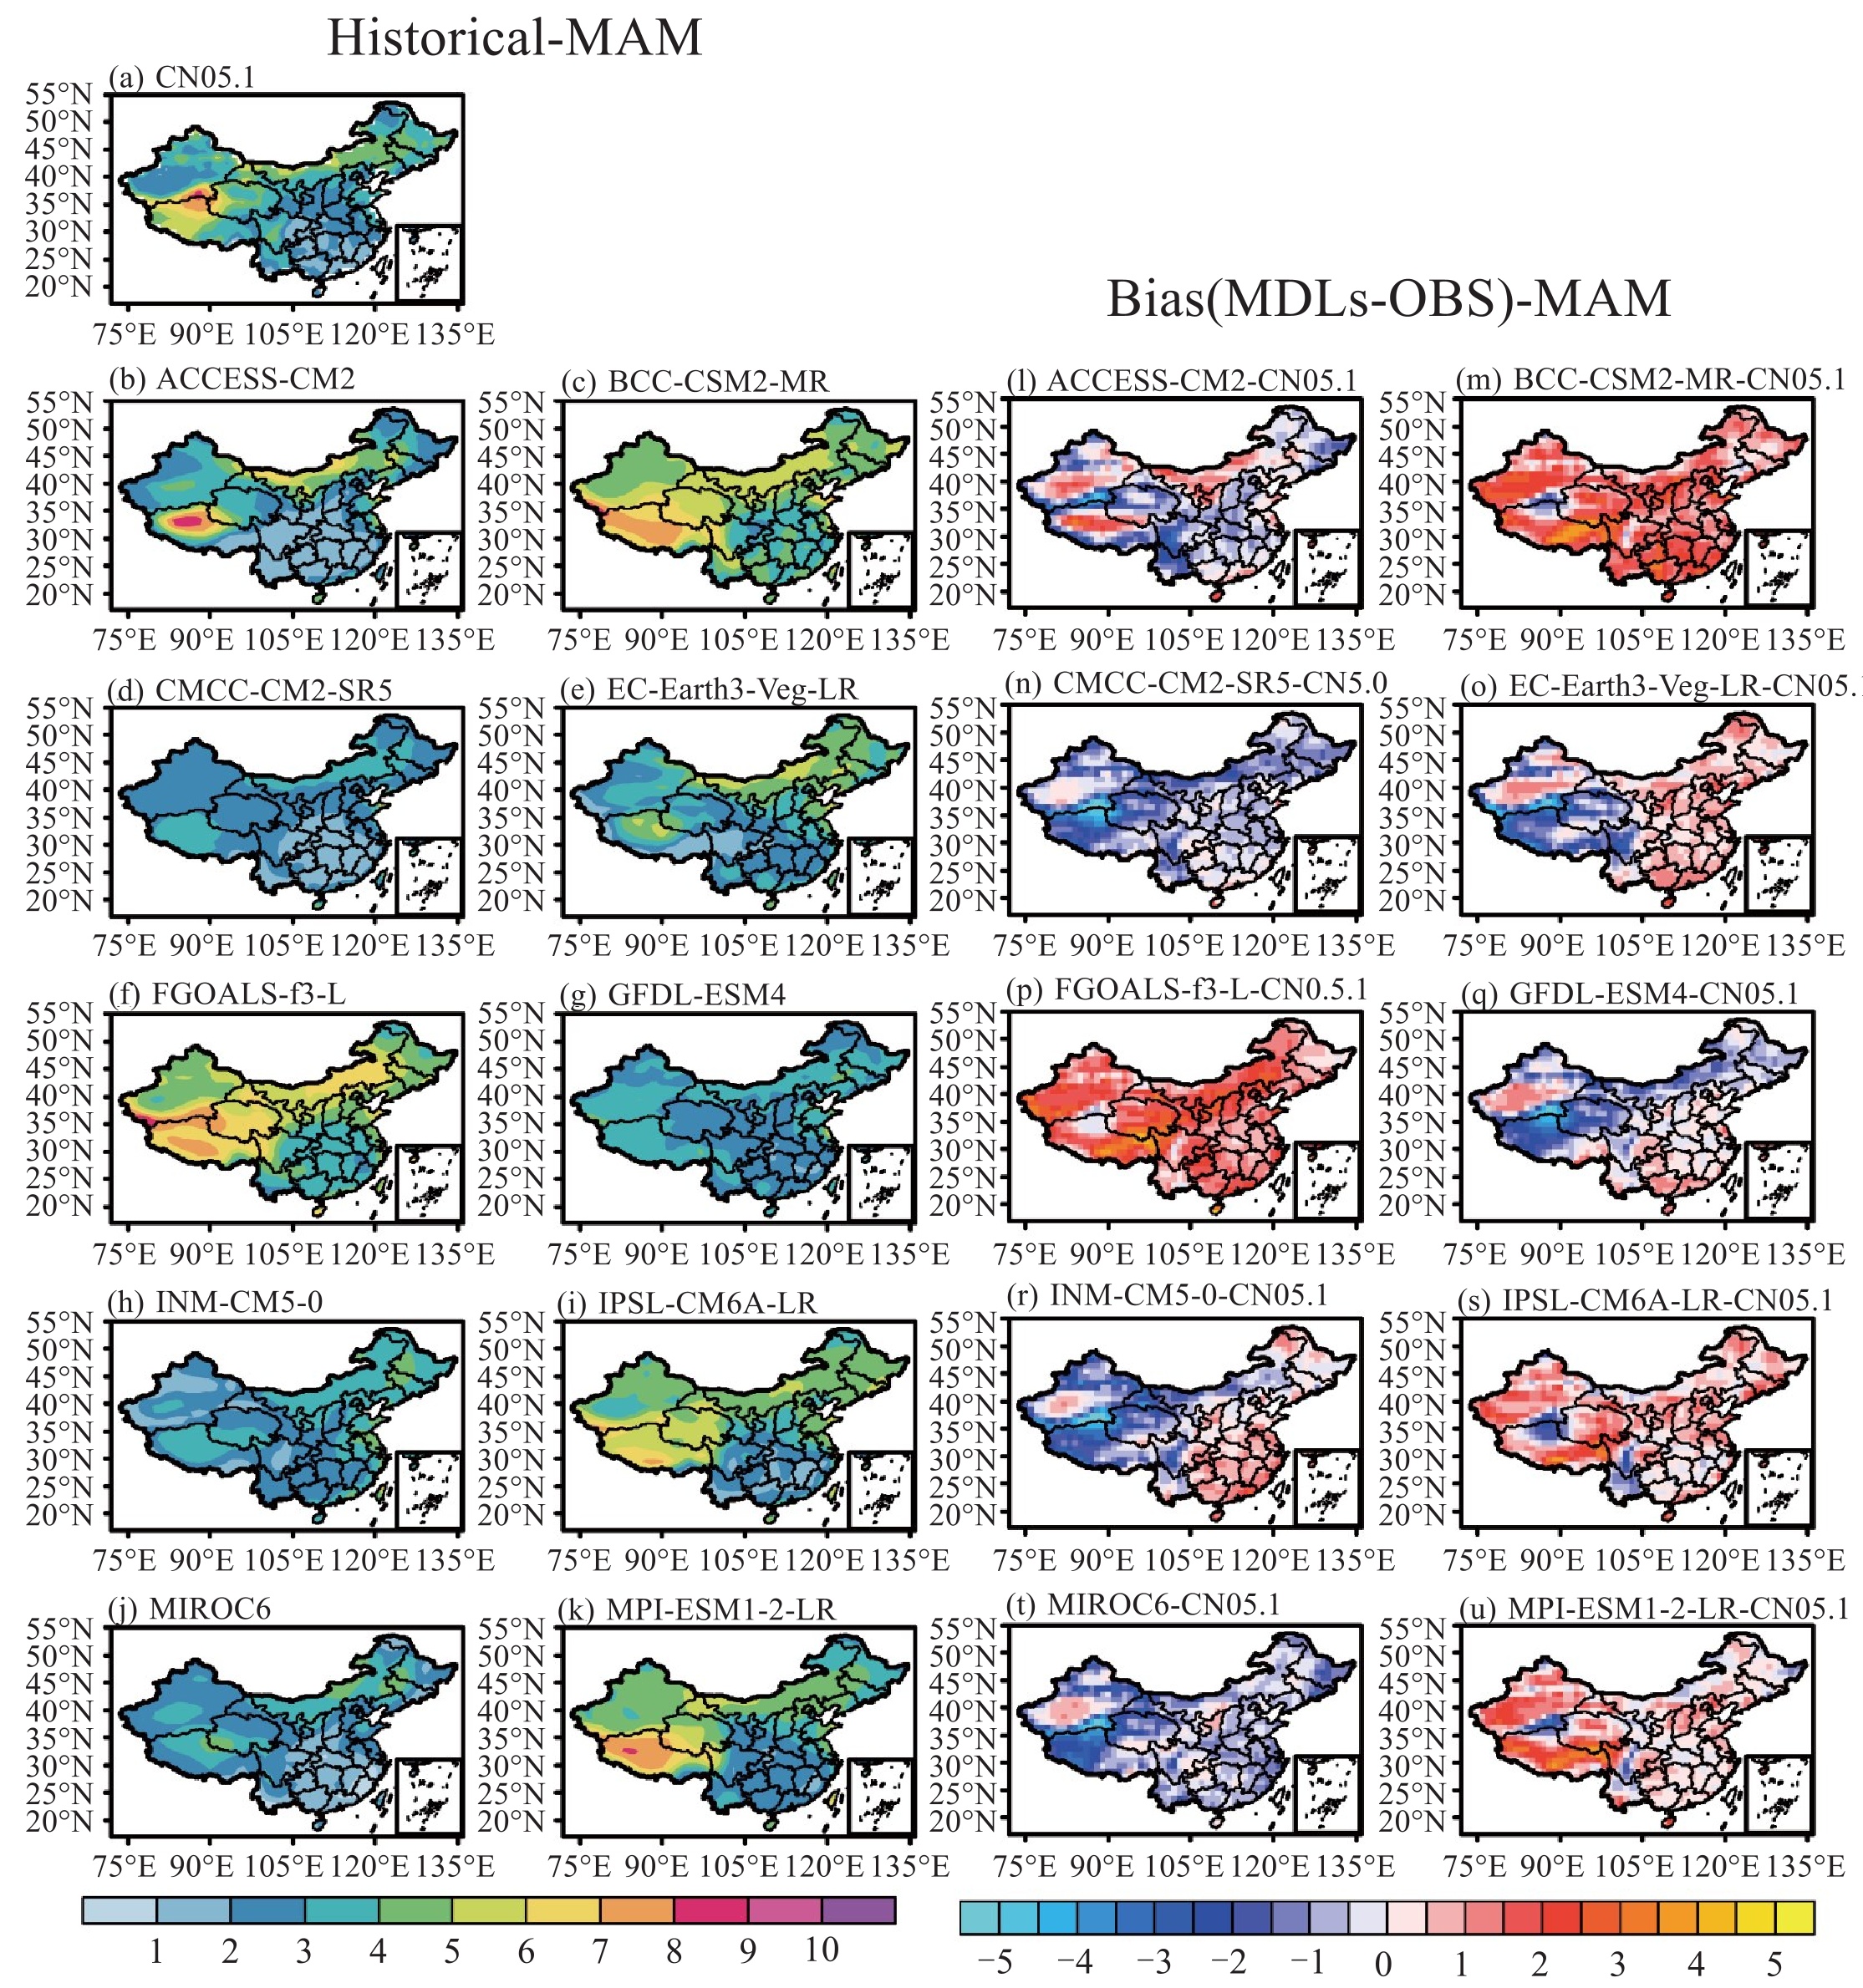
图 4 1961—2014年春季平均10 m风速分布及CMIP6模式与观测间的偏差(单位:m·s-1)
左边两列(a~k)为气候平均,右边两列(l~u)为CMIP6模式与观测的偏差。

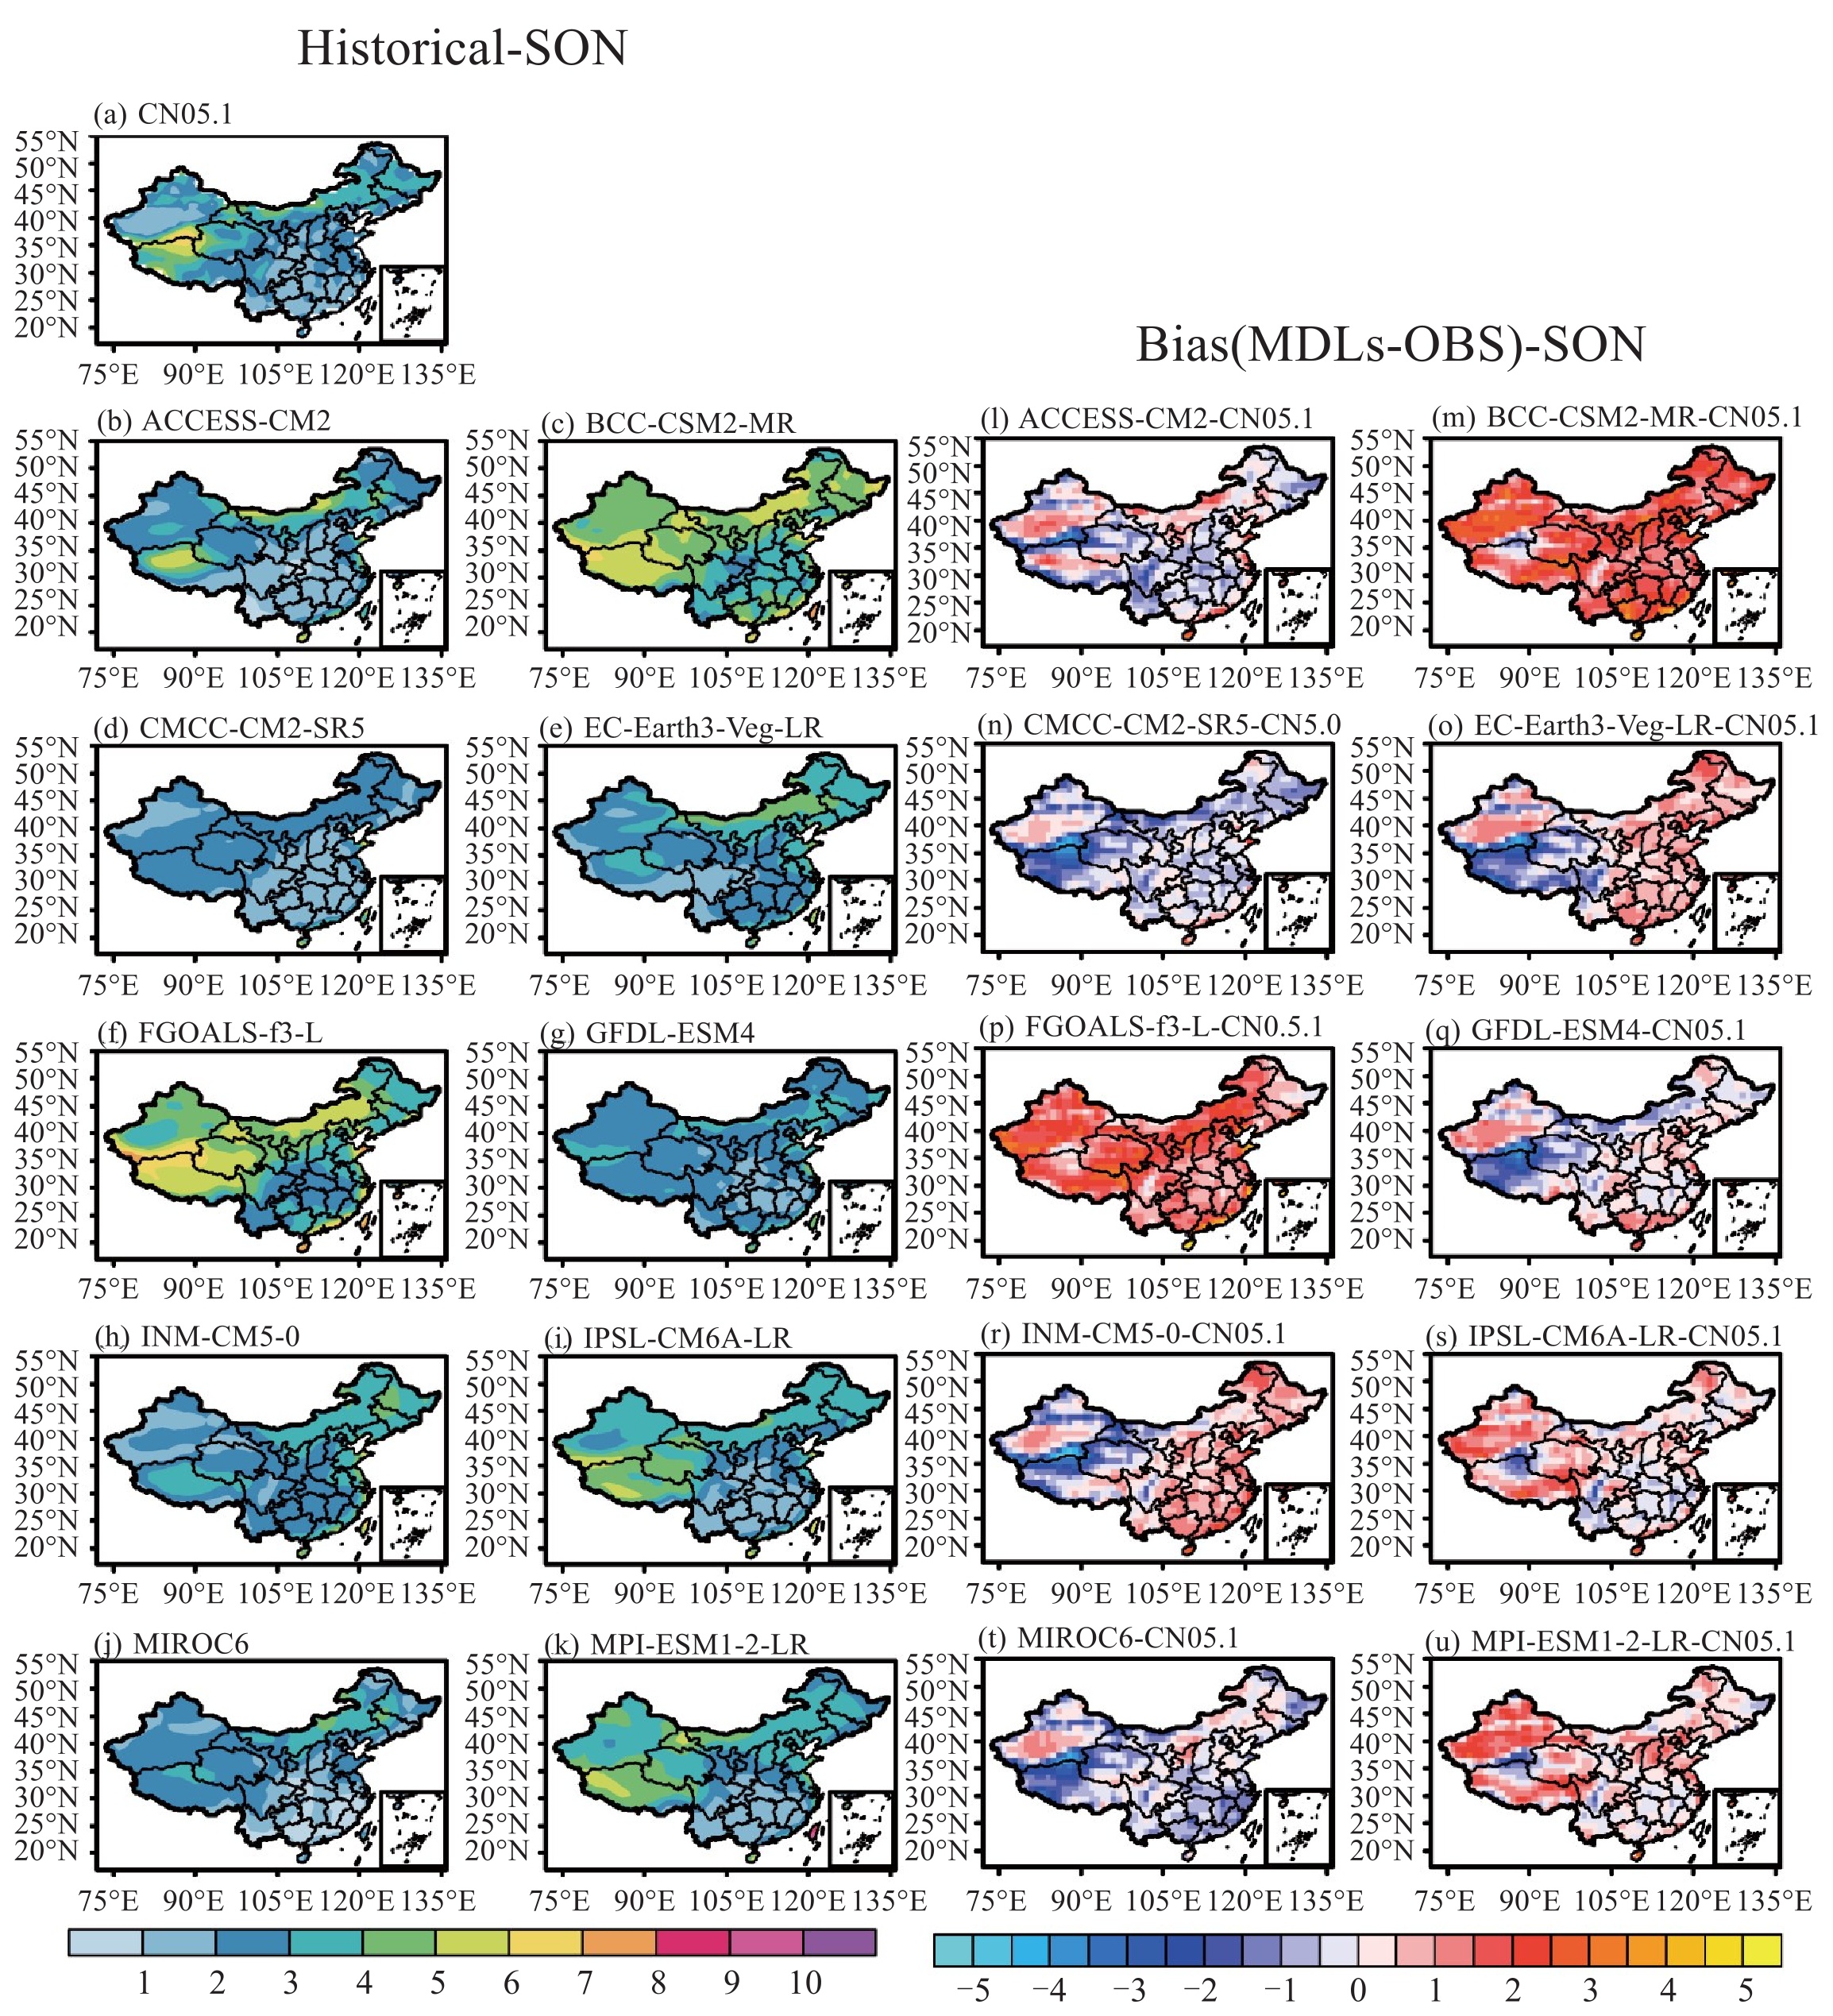
图 5 1961—2014年秋季平均10 m风速分布及CMIP6模式与观测间的偏差(单位:m·s-1)
左边两列(a~k)为气候平均,右边两列(l~u)为CMIP6模式与观测的偏差。
表 1 研究中使用的十个GCM的信息
模式名称 国家 空间分辨率 ACCESS-CM2 澳大利亚 1.25°×1.875° BCC-CSM2-MR 中国 1.125°×1.125° CMCC-CM2-SR5 意大利 0.94°×1.25° EC-Earth3-Veg-LR 欧洲中心 1.125°×1.125° FGOALS-f3-L 中国 1.25°×0.94° GFDL-ESM4 美国 1.25°×1.0° INM-CM5-0 俄罗斯 1.50°×2.0° IPSL-CM6A-LR 法国 2.5°×1.259° MIROC6 日本 1.406°×1.406° MPI-ESM1-2-LR 德国 1.865°×1.875°  下载: 导出CSV
-
[1] Portner H O, Roberts D C, Adams H, et al. Technical summary [R]//Climate change 2022: Impacts, adaptation, and vulnerability. Cambridge University Press, Cambridge, UK and New York, NY, USA, 2022, 37-118. [2] Veers P, Dykes K, Lantz E, et al. Grand challenges in the science of wind energy[J]. Science, 2019, 366(6464): eaau2027. [3] 艾琳, 我国第三大能源: 风电知多少?[J]. 绿色中国, 2018, 15(4): 40-43. [4] FERNANDEZ L. Global cumulative installed wind power capacity 2001-2023[R]. Retrieved from https://www.statista.com/statistics/268363/installed-wind-power-capacity-worldwide/ , 2024.[5] 江滢, 罗勇, 赵宗慈. 近50年中国风速变化多气候模式模拟检验[J]. 气象学报, 2009, 67(6): 923-934. [6] 江滢, 罗勇, 赵宗慈. 全球气候模式对未来中国风速变化预估[J]. 大气科学, 2010, 34(2): 323-336. [7] Jiang Y, Xu X Y, Liu H W, et al. The underestimated magnitude and decline trend in near-surface wind over China[J]. Atmospheric Science Letters, 2017, 18(12): 475-483. [8] Jiang D B, Hu D, Tian Z P, et al. Differences between CMIP6 and CMIP5 models in simulating climate over China and the East Asian monsoon[J]. Advances in Atmospheric Sciences, 2020, 37(10): 1102-1118. [9] Yu T T, Chen W, Gong H N, et al. Comparisons between CMIP5 and CMIP6 models in simulations of the climatology and interannual variability of the East Asian summer Monsoon[J]. Climate Dynamics, 2023, 60(7): 2183-2198. [10] Wu J, Gao X J. Present day bias and future change signal of temperature over China in a series of multi-GCM driven RCM simulations[J]. Climate Dynamics, 2020, 54(1): 1113-1130. [11] Wang M R, Wang J, Chen D L, et al. Recent recovery of the boreal spring sensible heating over the Tibetan Plateau will continue in CMIP6 future projections[J]. Environmental Research Letters, 2019, 14(12): 124066. [12] Xin X G, Wu T W, Zhang J, et al. Comparison of CMIP6 and CMIP5 simulations of precipitation in China and the East Asian summer monsoon[J]. International Journal of Climatology, 2020, 40(15): 6423-6440. [13] Zhou T J, Chen Z M, Zou L W, et al. Development of climate and earth system models in China: past achievements and new CMIP6 results [J]. Journal of Meteorological Research, 2020, 34(1): 1-19. [14] Xu H W, Chen H P, Wang H J. Future changes in precipitation extremes across China based on CMIP6 models[J]. International Journal of Climatology, 2022, 42(1): 635-651. [15] Miao H, Xu H M, Huang G, et al. Evaluation and future projections of wind energy resources over the Northern Hemisphere in CMIP5 and CMIP6 models[J]. Renewable Energy, 2023, 211: 809-821. [16] 吴佳, 高学杰. 一套格点化的中国区域逐日观测资料及与其它资料的对比[J]. 地球物理学报, 2013, 56(4): 1102-1111. [17] Xu Y, Gao X J, Giorgi F, et al. Projected changes in temperature and precipitation extremes over China as measured by 50-yr return values and periods based on a CMIP5 ensemble[J]. Advances in Atmospheric Sciences, 2018, 35(4): 376-388. [18] 周天军, 邹立维, 陈晓龙. 第六次国际耦合模式比较计划(CMIP6)评述[J]. 气候变化研究进展, 2019, 15(5): 445-456. [19] Luo N, Guo Y, Gao Z B, et al. Assessment of CMIP6 and CMIP5 model performance for extreme temperature in China[J]. Atmospheric and Oceanic Science Letters, 2020, 13(6): 589-597. [20] Chen Z M, Zhou T J, Chen X L, et al. Emergent constrained projections of mean and extreme warming in China[J]. Geophysical Research Letters, 2023, 50(20): e2022GL102124. [21] ipcc Intergovernmental Panel on Climate Change. Climate change 2021-the physical science basis: working group I contribution to the sixth assessment report of the intergovernmental panel on climate change[M]. Cambridge, UK: Cambridge University Press, 2023. [22] Jiang D B, Sui Y, Lang X M. Timing and associated climate change of a 2 ℃ global warming[J]. International Journal of Climatology, 2016, 36(14): 4512-4522. [23] Taylor K E. Summarizing multiple aspects of model performance in a single diagram[J]. Journal of Geophysical Research: Atmospheres, 2001, 106(D7): 7183-7192. [24] Gleckler P J, Taylor K E, Doutriaux C. Performance metrics for climate models[J]. Journal of Geophysical Research: Atmospheres, 2008, 113(D6): 2007JD008972. [25] Baker N C, Taylor P C. A framework for evaluating climate model performance metrics[J]. Journal of Climate, 2016, 29(5): 1773-1782. [26] Zhang X Q, He B, Bao Q, et al. Evaluation of the interannual variability in the East Asian summer monsoon in AMIP and historical experiments of CAS FGOALS-f3-L[J]. Atmospheric and Oceanic Science Letters, 2023, 16(1): 100275. [27] 张佳, 乐旭, 田晨光, 等. 基于CMIP6多模式集合的未来中国风功率预估[J]. 大气科学学报, 2023, 46(3): 402-414. [28] Zhao Y M, Qian C, Zhang W J, et al. Extreme temperature indices in Eurasia in a CMIP6 multi-model ensemble: Evaluation and projection [J]. International Journal of Climatology, 2021, 41(11): 5368-5385. [29] Hausfather Z, Marvel K, Schmidt G A, et al. Climate simulations: recognize the'hot model'problem[J]. Nature, 2022, 605(7908): 26-29. [30] 谭洁, 黄安宁, 史学丽, 等. BCC-CSM2-MR模式对中国陆面过程模拟能力评估[J]. 高原气象, 2022, 41(5): 1335-1347. [31] Miao H, Dong D H, Huang G, et al. Evaluation of Northern Hemisphere surface wind speed and wind power density in multiple reanalysis datasets[J]. Energy, 2020, 200: 117382. [32] Zhang Z T, Wang K C. Stilling and recovery of the surface wind speed based on observation, reanalysis, and geostrophic wind theory over China from 1960 to 2017[J]. Journal of Climate, 2020, 33(10): 3989-4008. [33] Zhou B T, Wu J, Xu Y, et al. Projected changes in autumn rainfall over West China: results from an ensemble of dynamical downscaling simulations[J]. International Journal of Climatology, 2019, 39(12): 4869-4882. -

 点击查看大图
图(13) / 表(1)
计量
- 文章访问数: 633
- HTML全文浏览量: 32
- PDF下载量: 223
- 被引次数: 0
 粤公网安备 4401069904700003号