


Predicting the Frequency of Landfalling Tropical Cyclones in East and South China Using Thermocline Temperature Anomalies
-
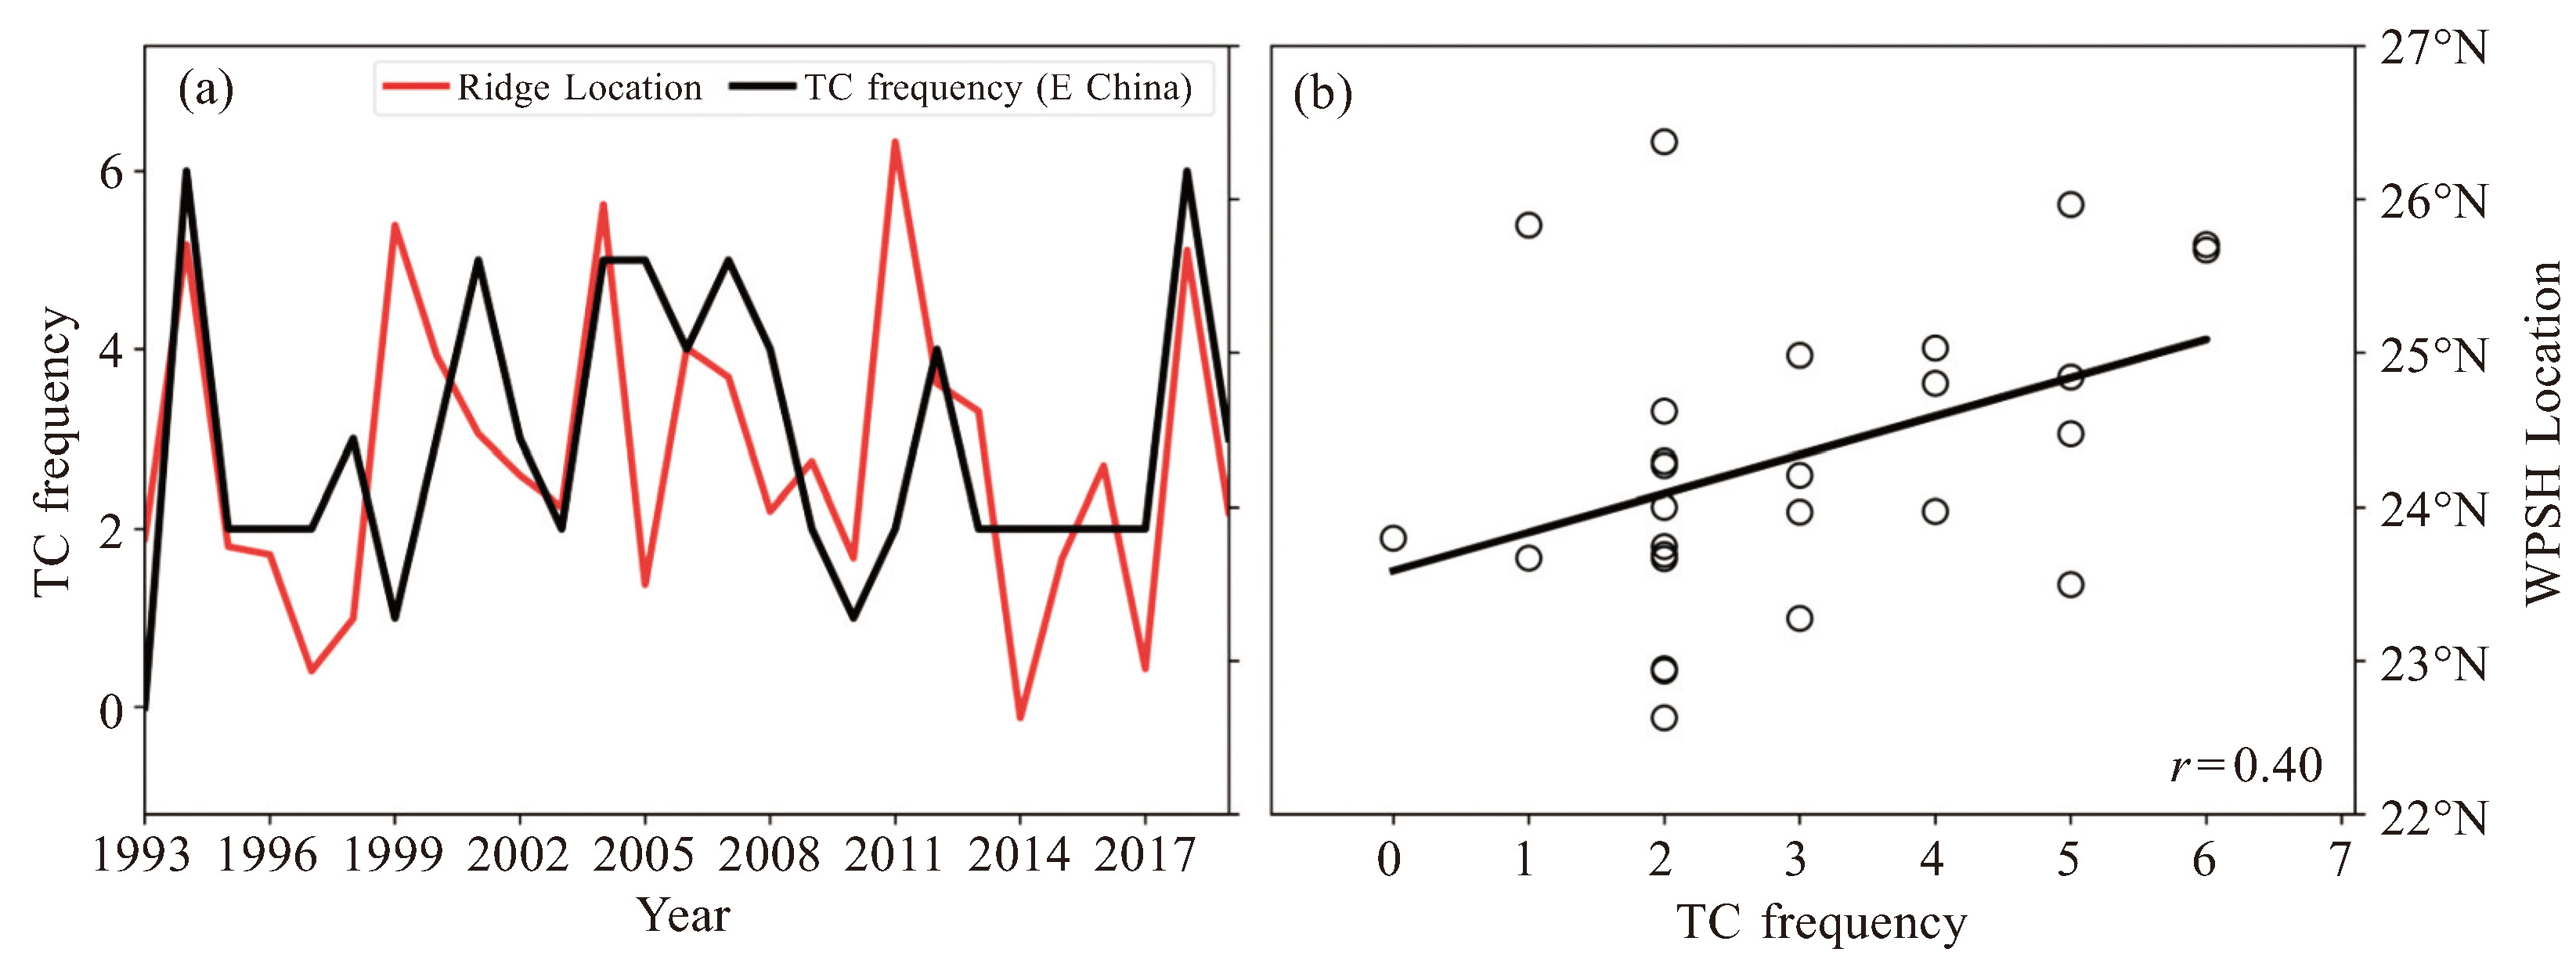
摘要: 热带气旋(Tropical Cyclone, TC) 的登陆会给中国沿海地区带来巨大的经济损失,提前预测TC登陆频数对防灾减灾工作有重大意义。本文基于1993—2019年四套海洋再分析数据集,研究不同月份、不同经度赤道温跃层温度异常与中国华南及华东地区TC登陆频数之间的相关关系。结果显示, 在部分特定经度上两者存在显著相关性。由于海洋热能沿着太平洋赤道温跃层自西向东传输,特定区域的温度异常可以超前数月甚至更长时间指示TC的登陆频数。另外,西太平洋副热带高压脊线的南北位置变化不仅与华东地区TC登陆频数密切相关,还与不同经度温跃层温度变化存在显著关联。Abstract: Landfalling Tropical Cyclones (TCs) cause huge economic losses in China's coastal areas. Predicting the frequency of TC landfall in advance is of great significance for disaster prevention and mitigation. In this study, four ocean reanalysis datasets from 1993 to 2019 were utilized to investigate the correlations between the thermocline temperature anomalies at different longitudes across different months and the frequency of TCs making landfall in South and East China. The results reveal significant correlations at specific longitudes, with temperature anomalies leading the frequency of landfalling TCs by several months or even longer. This predictive capability is attributed to the eastward transport of upper-ocean heat content along the equatorial Pacific thermocline. In addition, the meridional shift of the western Pacific subtropical high ridge is closely related not only with the frequency of landfalling TCs in East China but also with the thermocline temperature anomalies at varying longitudes.
-

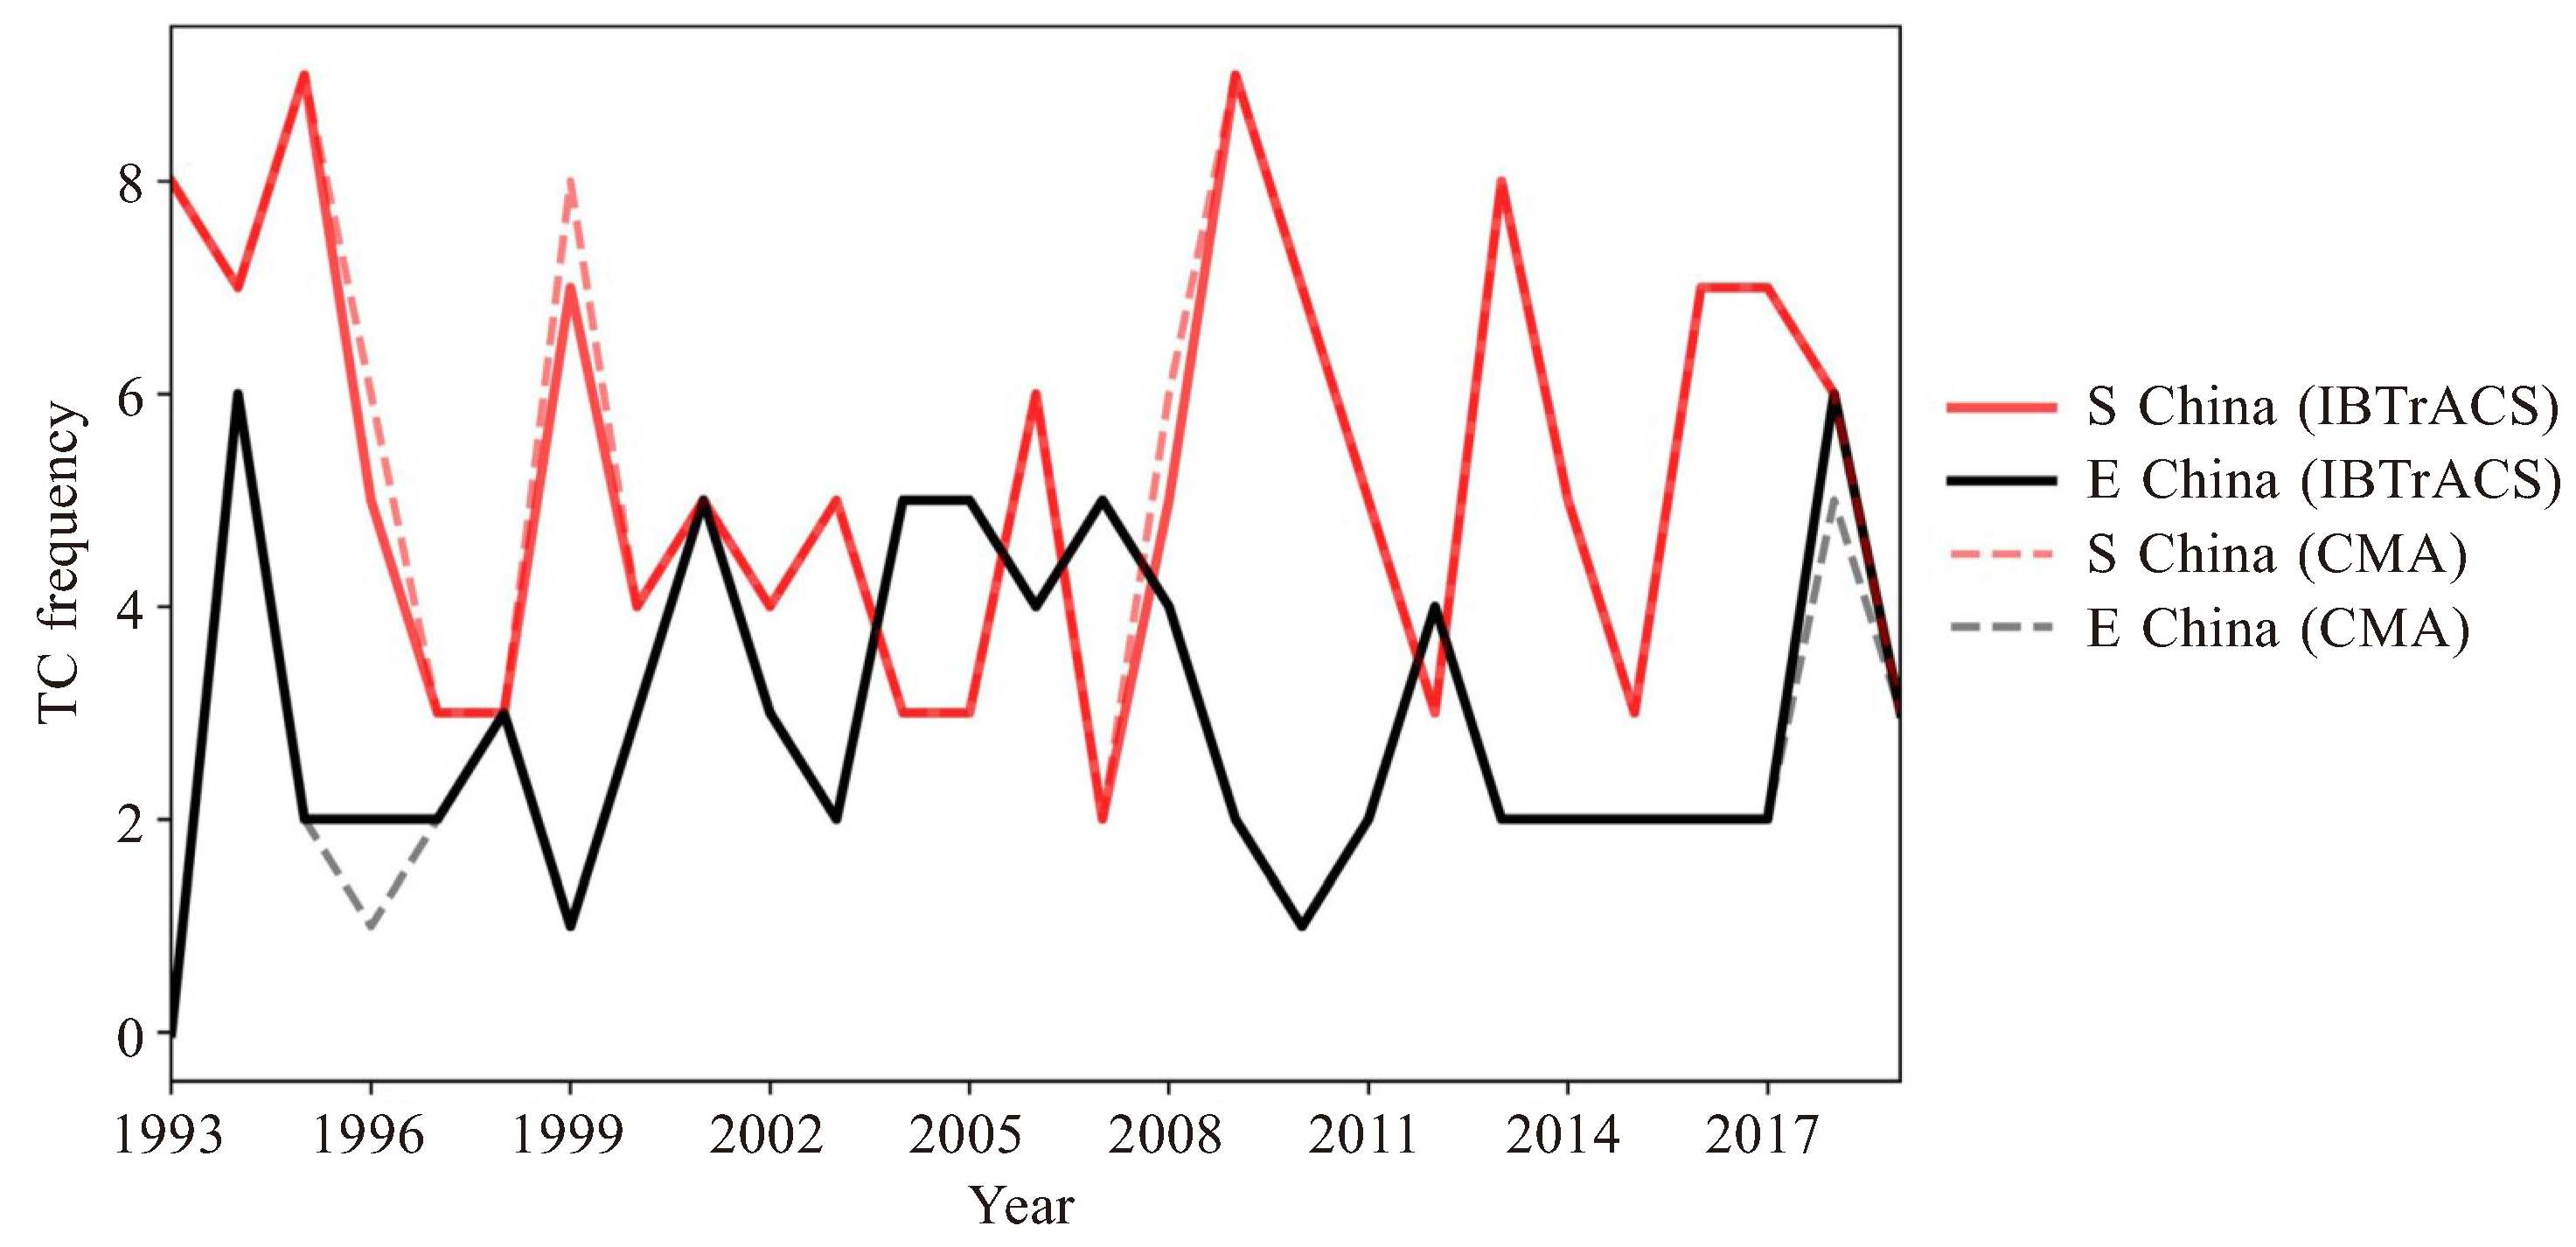
图 1 1993—2019年TC季的登陆TC频数时间序列
实线和虚线分别为IBTrACS和CMABST的统计结果。红色与粉色线代表华南地区(S China),黑色与灰色线代表华东地区(E China)。

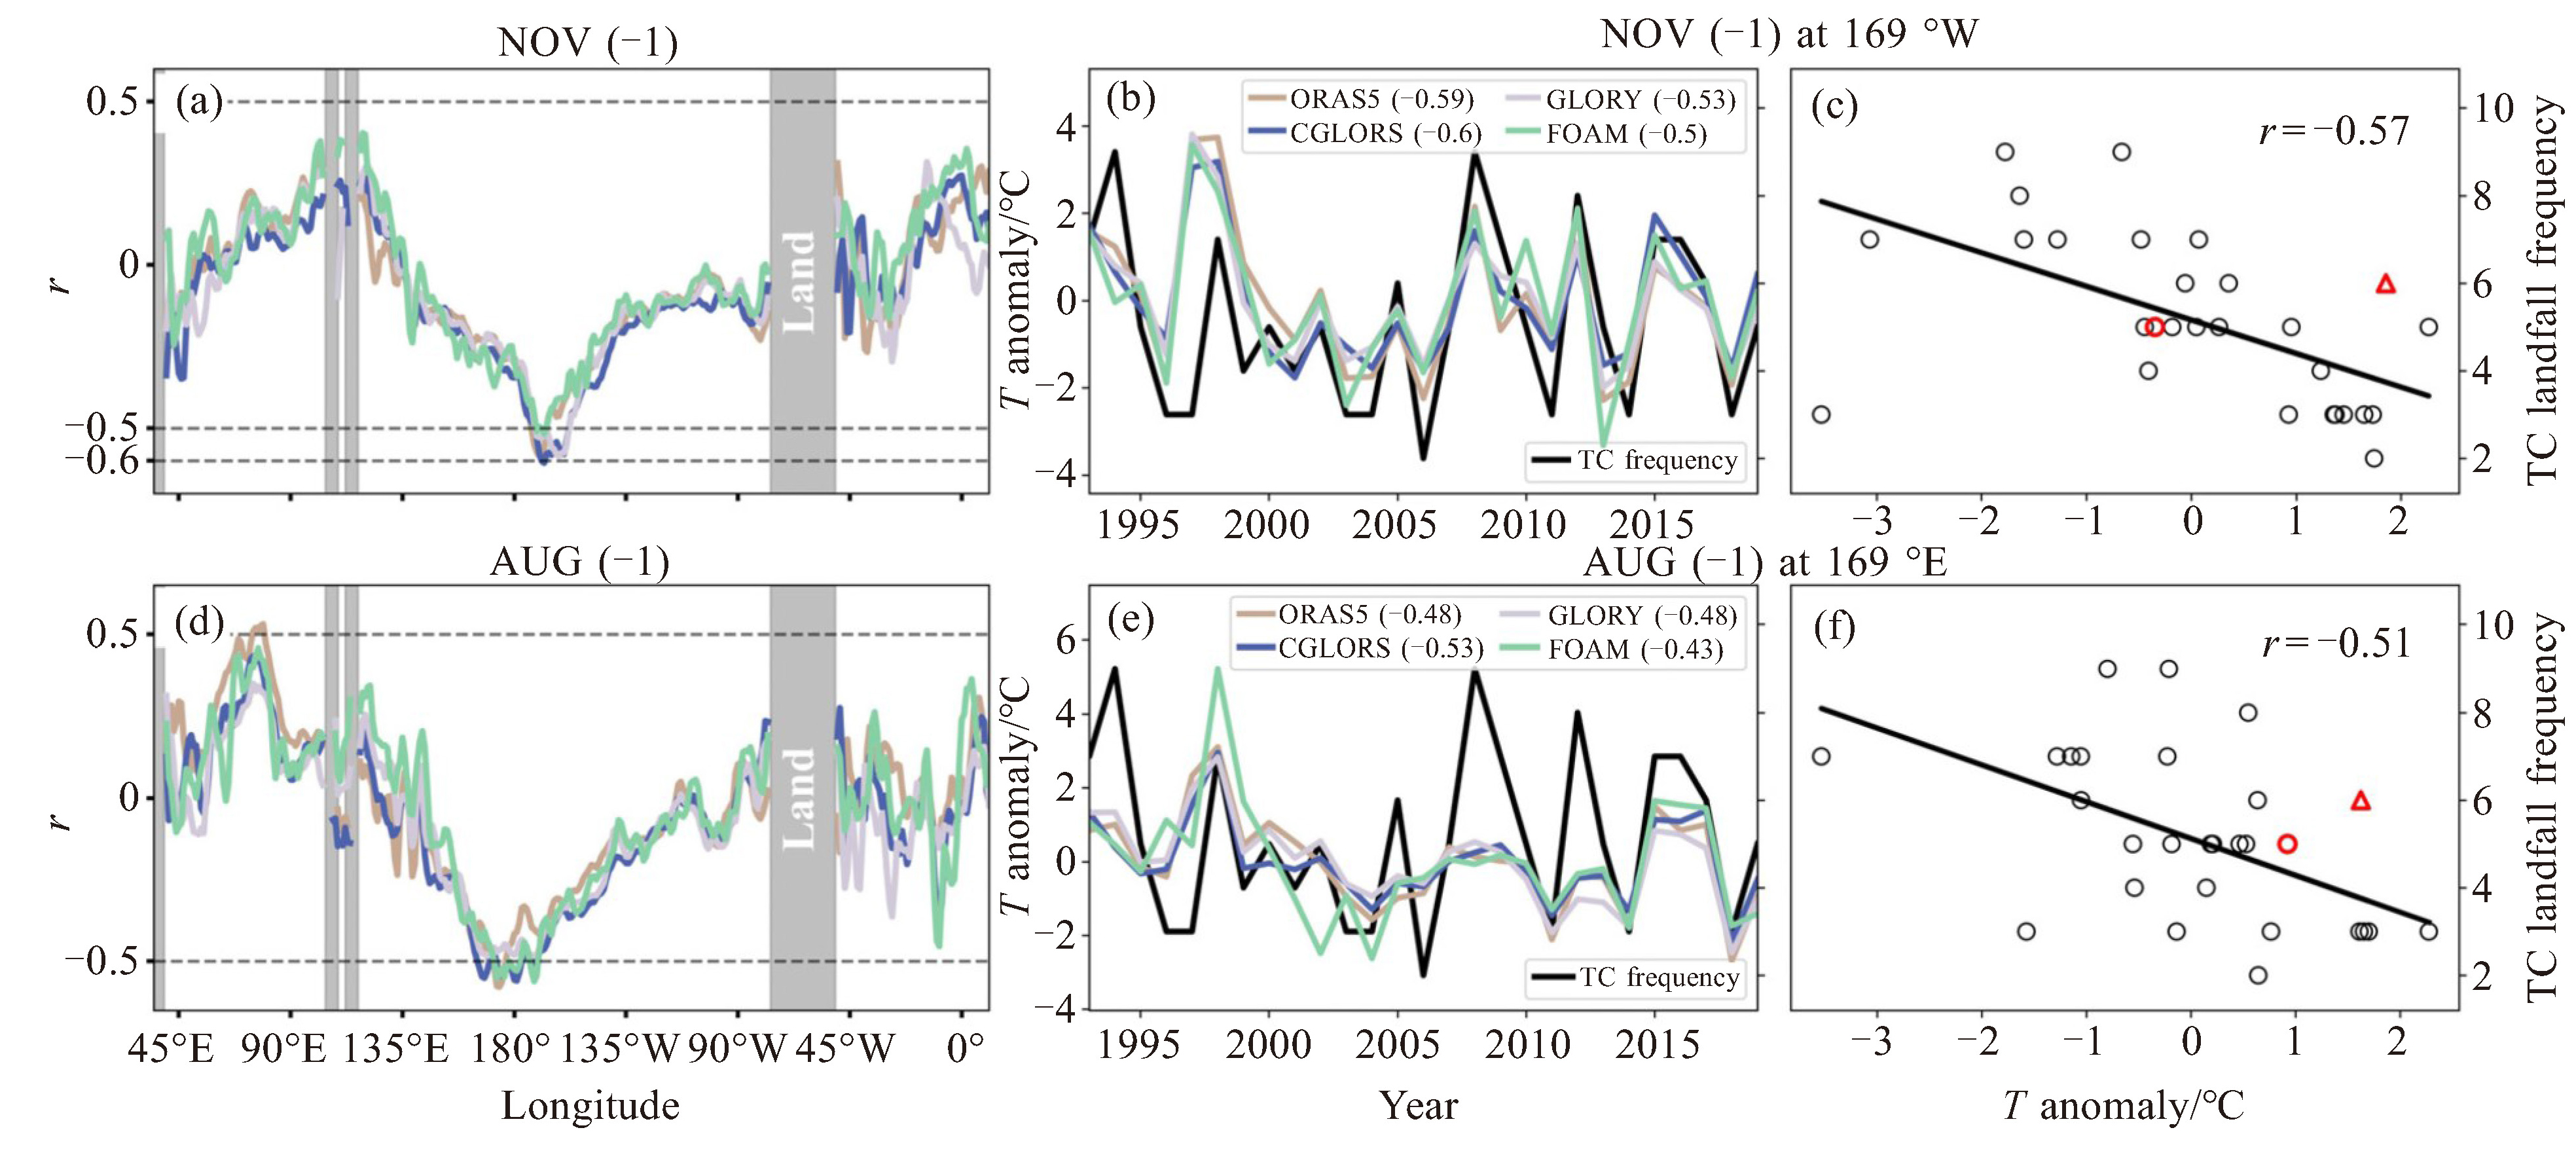
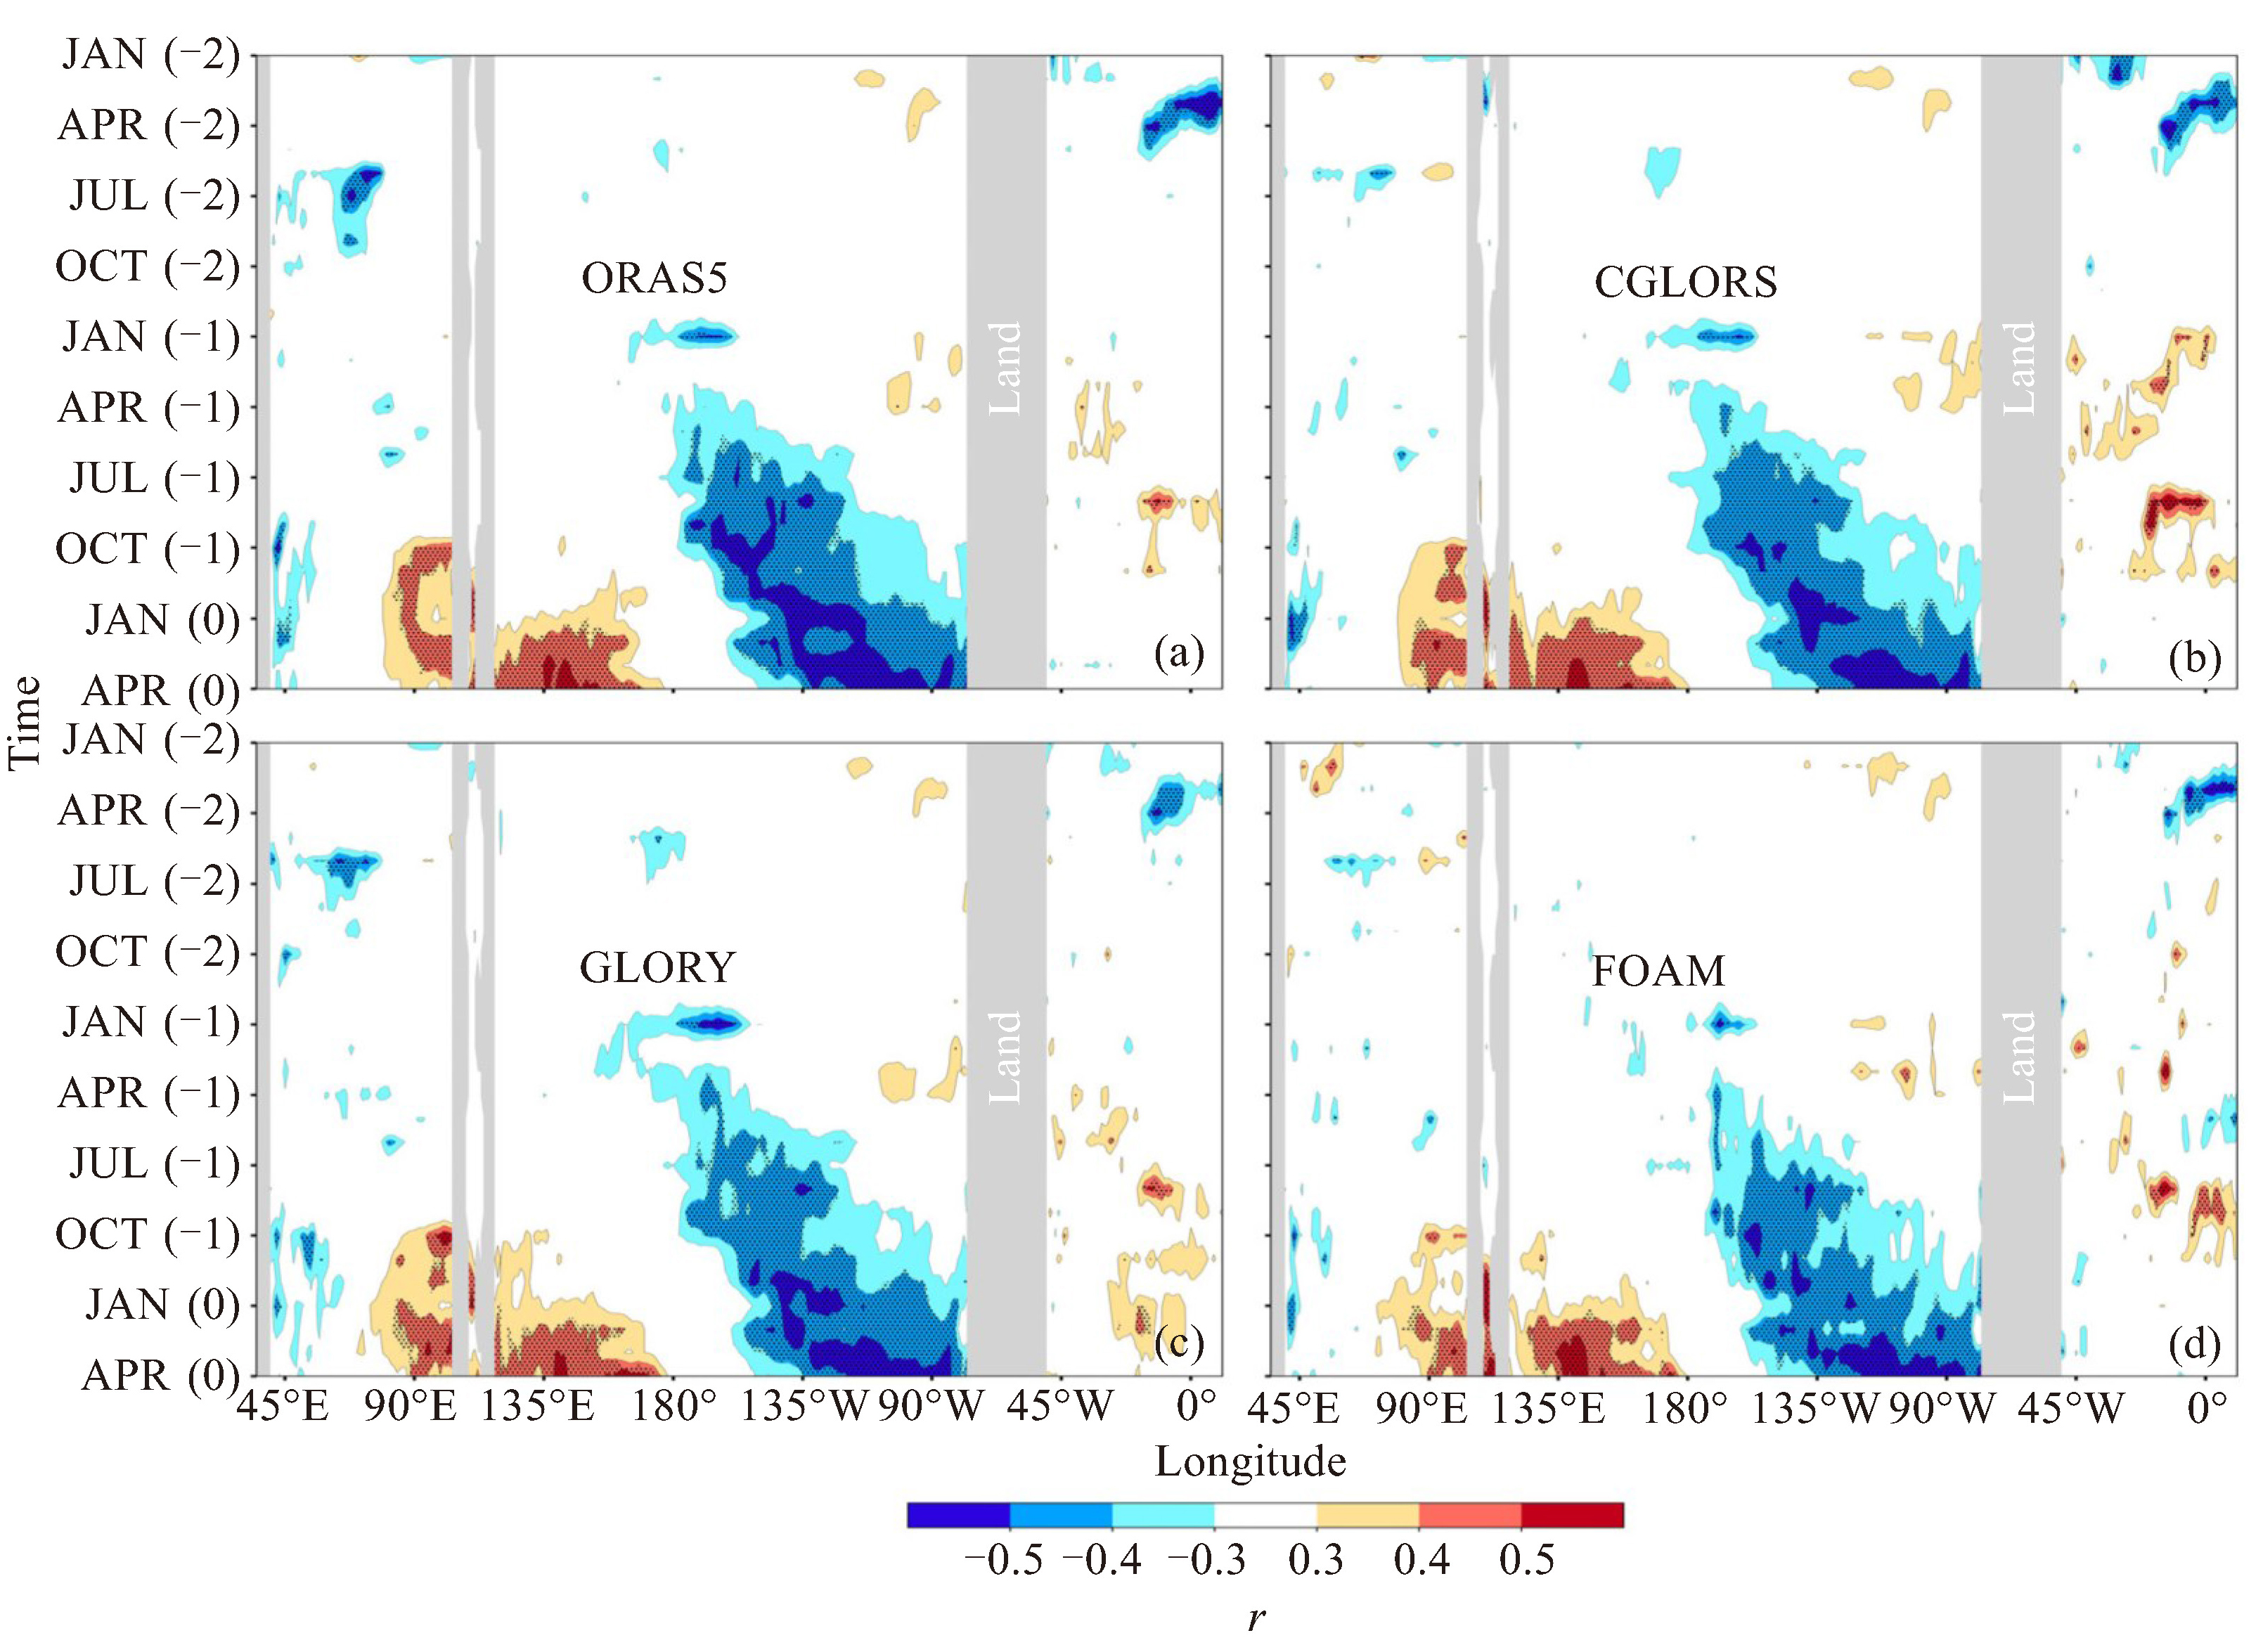
图 2 左列是热带海洋温跃层温度异常与登陆华南地区TC频数的相关系数(r)随着经度在超前时间为NOV(-1)(a)和AUG(-1)(d)时的变化,中列是各数据集在[NOV(-1),169 °W](b)和[AUG(-1),169 °E](e)温跃层温度异常与登陆华南地区TC频数的时间序列,右列是各数据集温跃层温度异常平均值与登陆TC频数的散点拟合图与相关系数(c、f)(b)和(e)中的温度异常均为×(-1)后的结果;(c)和(f)中的红色圆圈和三角形分别为2020年和2021年的登陆TC频数观测值

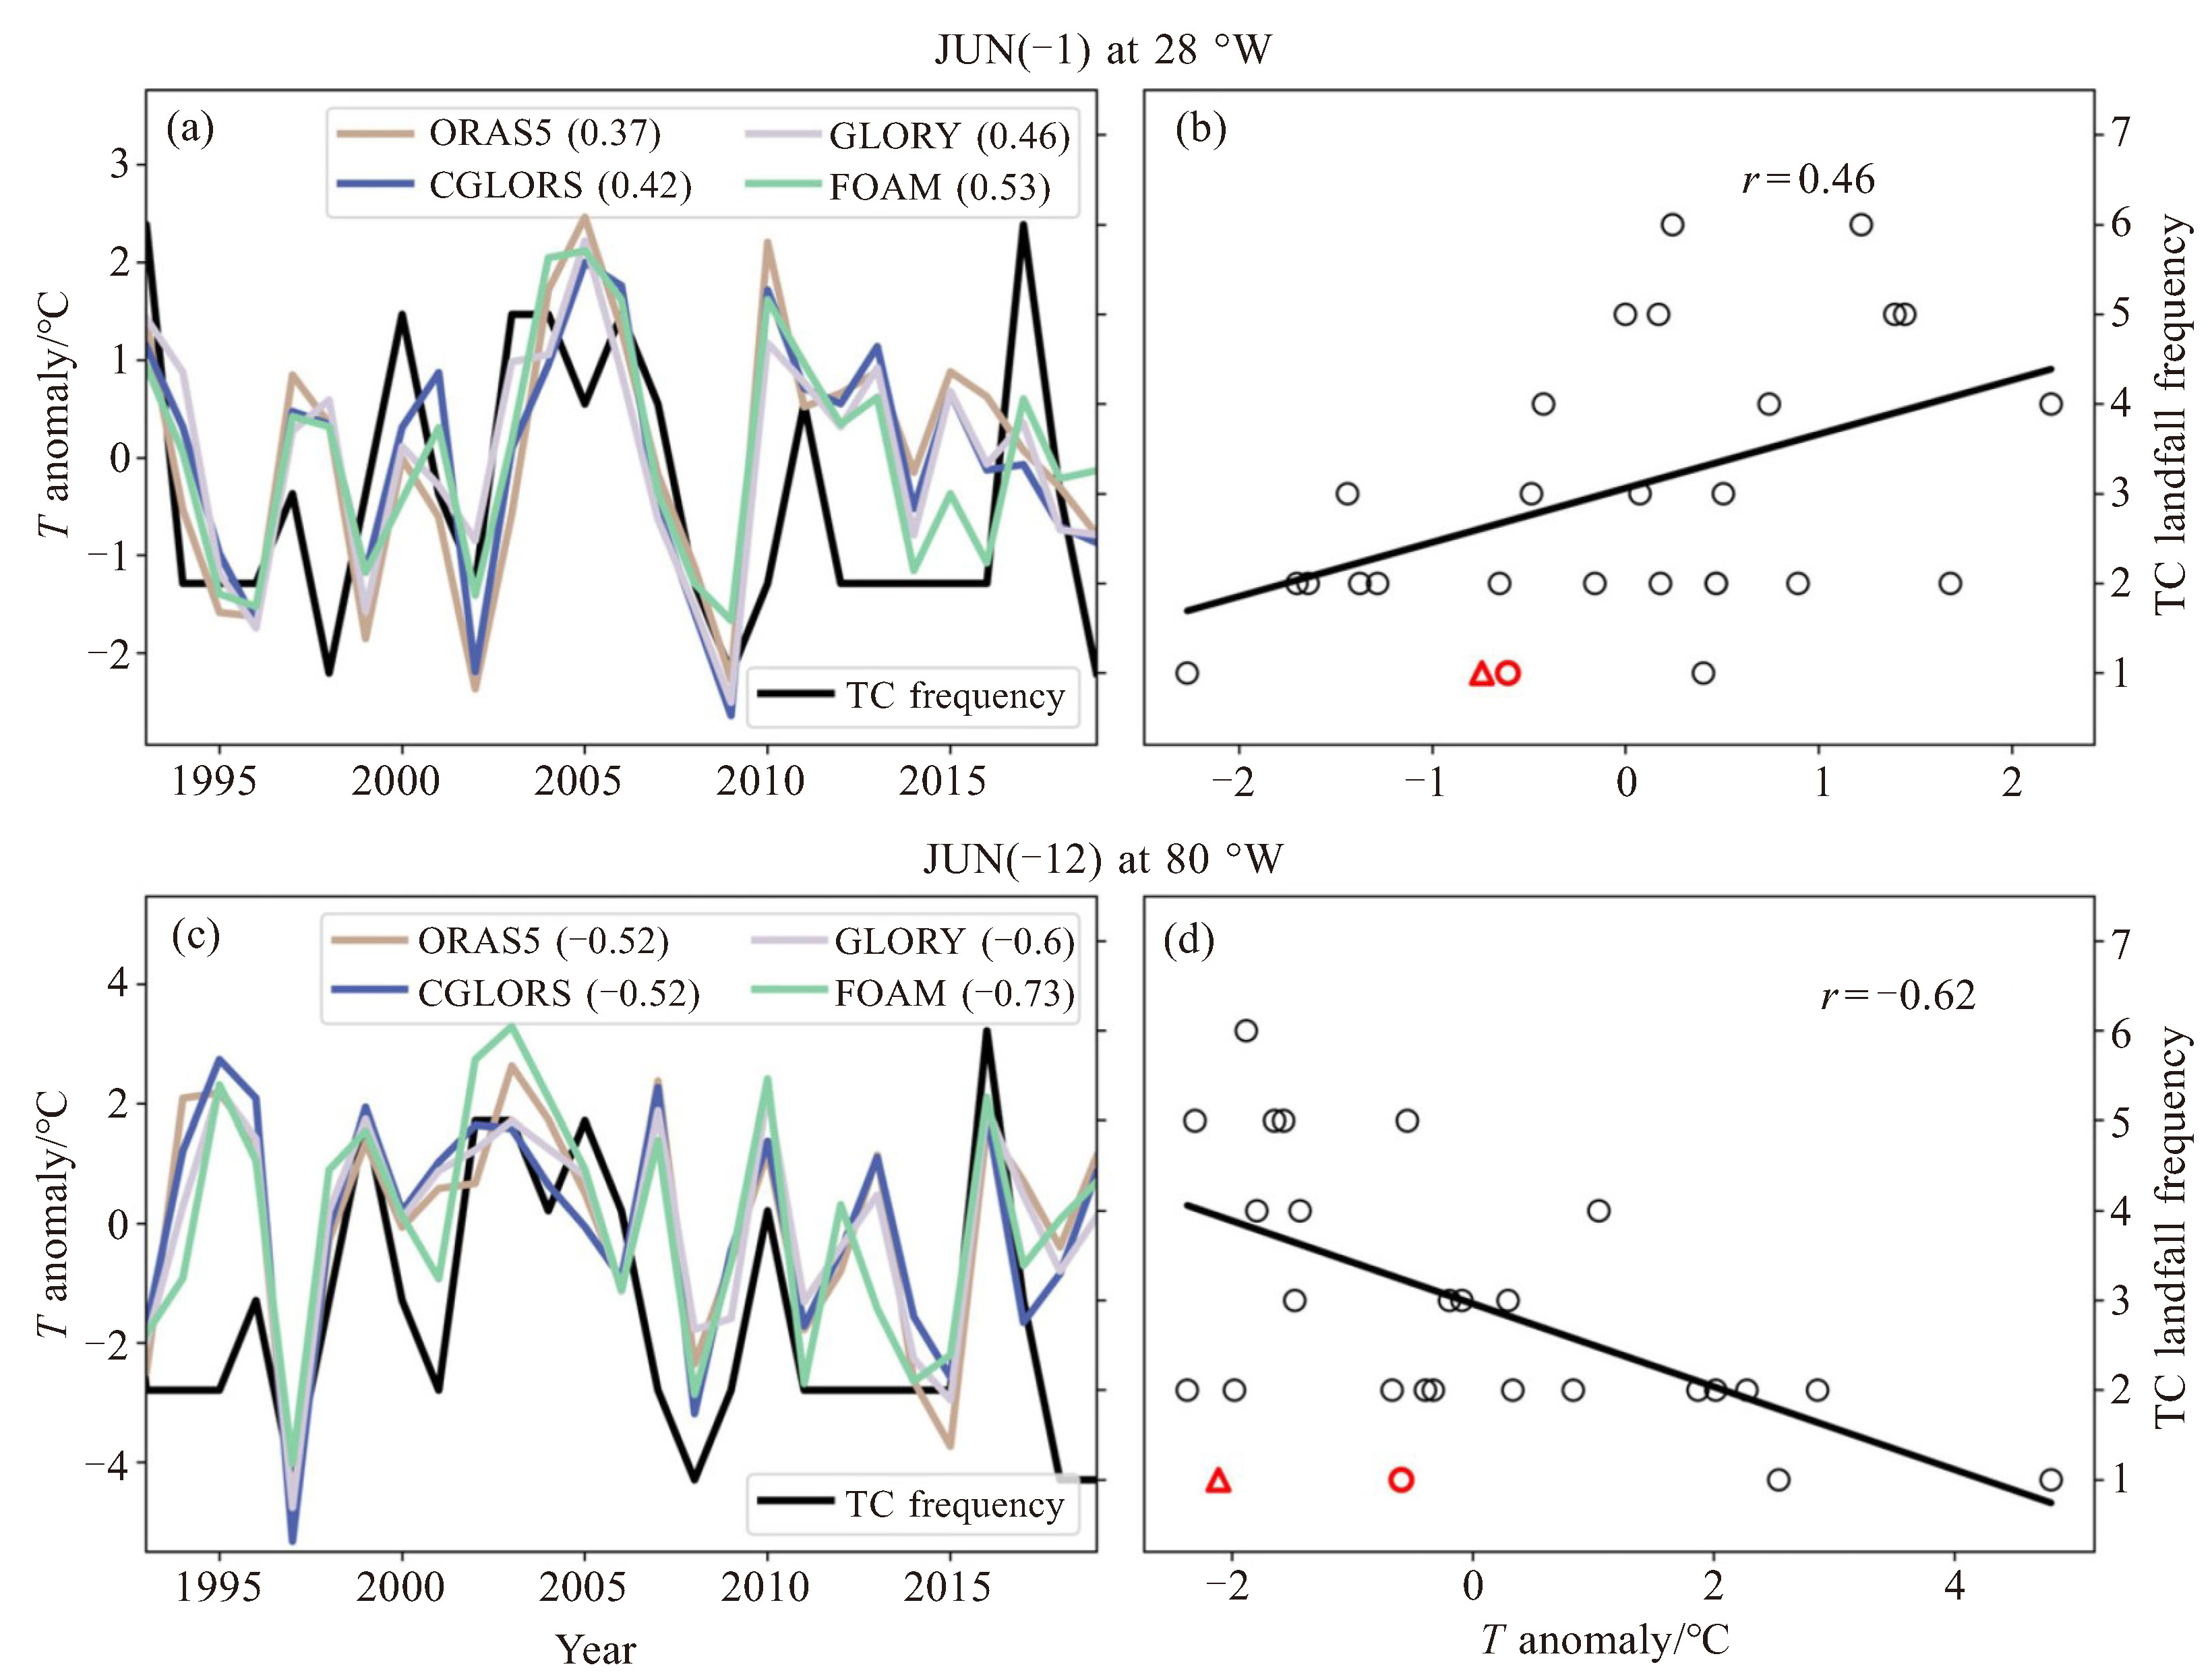
图 3 各数据集在[JUN(-1),28 °W](a、b)和[JUN(-2), 80 °W](c、d)温跃层温度异常与登陆华南地区TC频数的时间序列(a、c),各数据集温跃层温度异常平均值与登陆TC频数的散点拟合图与相关系数(b、d)
(b)和(d)中的红色圆圈和三角形点分别为2020年和2021年的观测值。(c)中的温度异常为×(-1)后的结果。

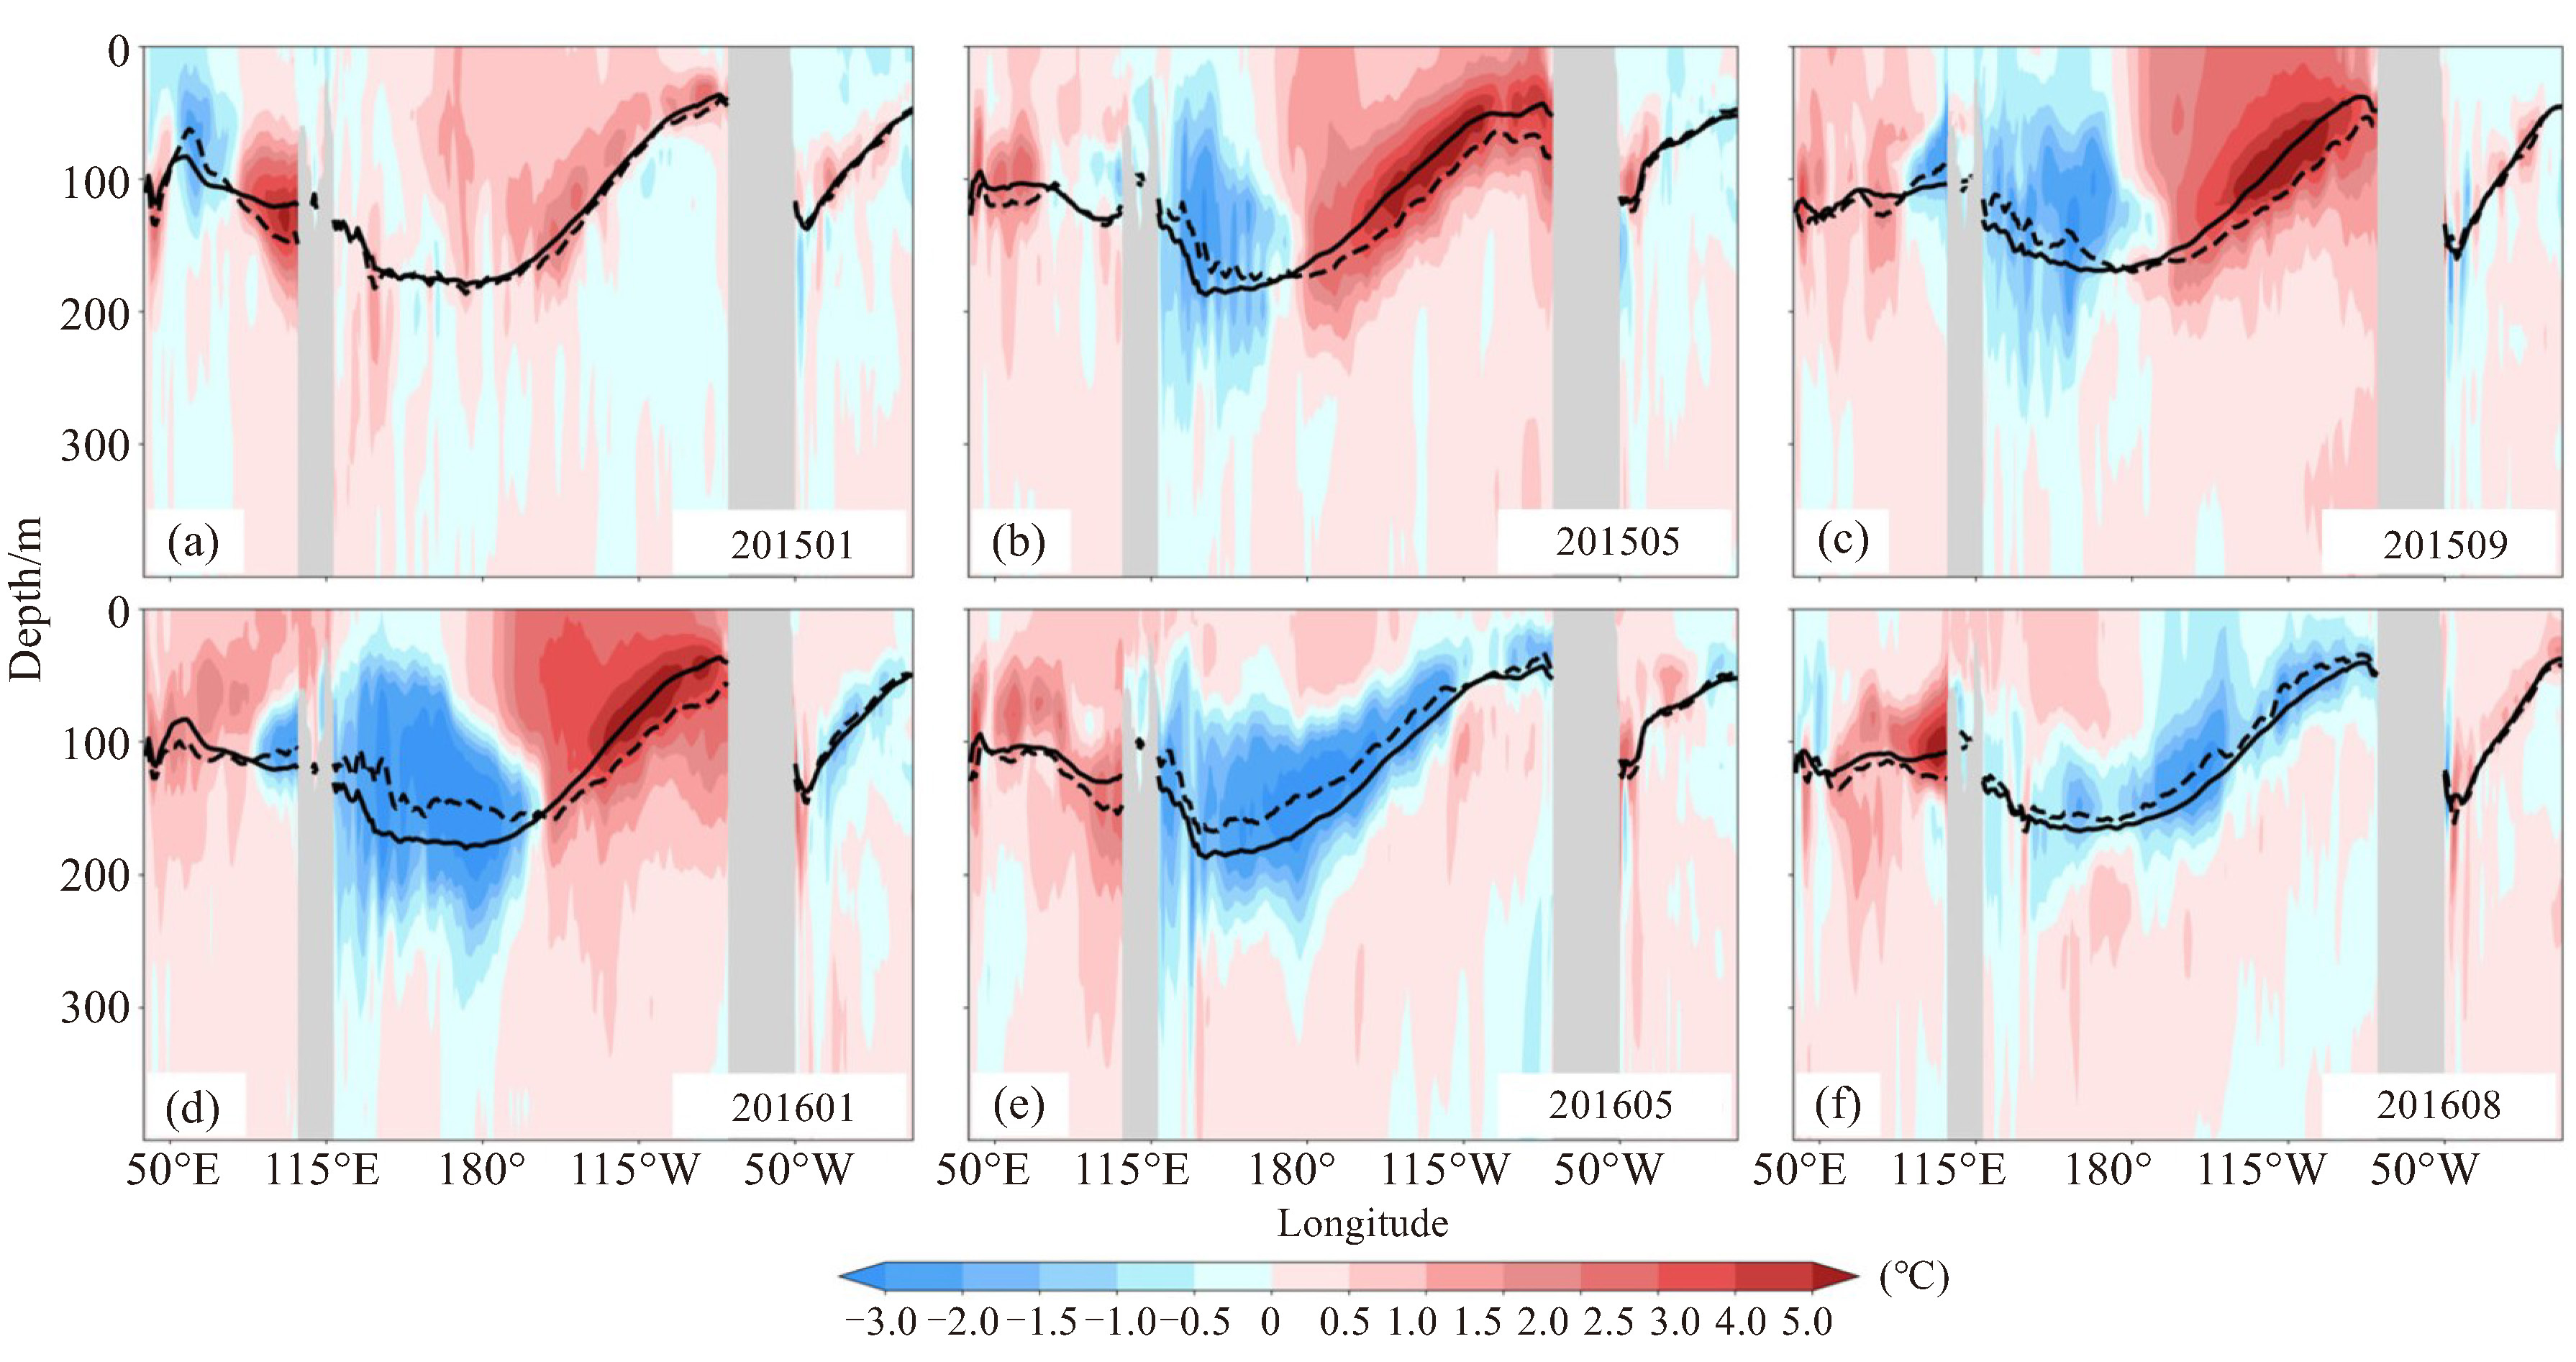
图 4 海洋温度异常在2015年El Niño事件期间沿温跃层的传输
(a)2015年1月、(b)2015年5月、(c)2015年9月、(d)2016年1月、(e)2016年5月和(f)2016年8月。纬度选取范围为5 °S~5 °N,图中灰色区域为陆地。黑色实线和虚线分别代表多年平均的逐月气候态温跃层(即20 ℃等温线)深度与实际温跃层深度。
-
[1] Feng X B, Yang G Y, Hodges K I, et al. Equatorial waves as useful precursors to tropical cyclone occurrence and intensification[J]. Nature Communications, 2023, 14(1): 511. [2] Feng X B, Klingaman N P, Hodges K I. The effect of atmosphere-ocean coupling on the prediction of 2016 western North Pacific tropical cyclones[J]. Quarterly Journal of the Royal Meteorological Society, 2019, 145(723): 2425-2444. [3] 陈联寿, 丁一汇. 西太平洋台风概论[M]. 北京: 科学出版社, 1979. [4] 陈联寿, 徐祥德, 解以杨, 等. 台风异常运动及其外区热力不稳定非对称结构的影响效应[J]. 大气科学, 1997, 21(1): 83-90. [5] Briegel L M, Frank W M. Large-scale influences on tropical cyclogenesis in the western north Pacific[J]. Monthly Weather Review, 1997, 125(7): 1397-1413. [6] Ritchie E A, Holland G J. Large-scale patterns associated with tropical cyclogenesis in the western Pacific[J]. Monthly Weather Review, 1999, 127(9): 2027-2043. [7] 谢义炳, 陈受钧, 张一良, 等. 东南亚基本气流与台风发生的一些事实的统计与分析[J]. 气象学报, 1963, 21(2): 206-217. [8] Liao X Q, Holloway C E, Feng X B, et al. Observed interannual relationship between ITCZ position and tropical cyclone frequency[J]. Journal of Climate, 2023, 36(16): 5587-5603. [9] Chan J C L, Shi J E, Lam C M. Seasonal forecasting of tropical cyclone activity over the Western North Pacific and the South China Sea[J]. Weather and Forecasting, 1998, 13(4): 997-1004. [10] Camargo S J, Sobel A H, Barnston A G, et al. The influence of natural climate variability on tropical cyclones, and seasonal forecasts of tropical cyclone activity[M]//Global perspectives on tropical cyclones. Singapore: World Scientific Publishing, 2010: 325-360. [11] Sparks N, Toumi R. Pacific subsurface ocean temperature as a long-range predictor of South China tropical cyclone landfall[J]. Communications Earth & Environment, 2020, 1(1): 30. [12] Xu H, Xu J J, Liu C L, et al. Distinguishing characteristics of spring and summer onset El Niño events[J]. Journal of Climate, 2020, 33(11): 4579-4597. [13] Cheng L J, Trenberth K E, Fasullo J T, et al. Evolution of ocean heat content related to ENSO[J]. Journal of Climate, 2019, 32(12): 3529-3556. [14] Knapp K R, Kruk M C, Levinson D H, et al. The international best track archive for climate stewardship (IBTrACS): unifying tropical cyclone data[J]. Bulletin of the American Meteorological Society, 2010, 91(3): 363-376. [15] Knapp, K. R, Diamond, H. J., Kossin, J. P., et al. International Best Track Archive for Climate Stewardship (IBTrACS) project, version 4. NOAA National Centers for Environmental Information, 2018. [16] Zuo H, Balmaseda M A, Tietsche S, et al. The ECMWF operational ensemble reanalysis-analysis system for ocean and sea ice: A description of the system and assessment[J]. Ocean Science, 2019, 15(3): 779-808. [17] Storto A, Masina S. C-GLORSv5: An improved multipurpose global ocean eddy-permitting physical reanalysis[J]. Earth System Science Data, 2016, 8(2): 679-696. [18] Lellouche J M, Greiner E, Le Galloudec O, et al. Recent updates to the Copernicus Marine Service global ocean monitoring and forecasting real-time 1/12° high-resolution system[J]. Ocean Science, 2018, 14(5): 1093-1126. [19] Blockley E W, Martin M J, McLaren A J, et al. Recent development of the Met Office operational ocean forecasting system: an overview and assessment of the new Global FOAM forecasts[J]. Geoscientific Model Development, 2014, 7(6): 2613-2638. [20] Li H, Xu F H, Sun J R, et al. Subtropical high affects interdecadal variability of tropical cyclone genesis in the South China Sea[J]. Journal of Geophysical Research: Atmospheres, 2019, 124(12): 6379-6392. [21] Wang B, Xiang B Q, Lee J Y. Subtropical High predictability establishes a promising way for monsoon and tropical storm predictions[J]. Proceedings of the National Academy of Sciences of the United States of America, 2013, 110(8): 2718-2722. [22] Camp J, Roberts M J, Comer R E, et al. The western Pacific subtropical high and tropical cyclone landfall: Seasonal forecasts using the Met Office GloSea5 system[J]. Quarterly Journal of the Royal Meteorological Society, 2019, 145(718): 105-116. [23] Jin L, Liu C L, Cao N, et al. Tracking the variability of the western Pacific warm pool heat content over 1980-2020[J]. Frontiers in Earth Science, 2024, 12: 1377715. -

 下载:
下载:
 点击查看大图
计量
- 文章访问数: 2
- HTML全文浏览量: 1
- PDF下载量: 0
- 被引次数: 0
 粤公网安备 4401069904700003号