


The Comparison and Analysis on the Water Vapor Brightness Temperature and Infrared Brightness Temperature of Three Severe Typhoon in South China Sea Based on HIMAWARI-8 Satellite Data
-
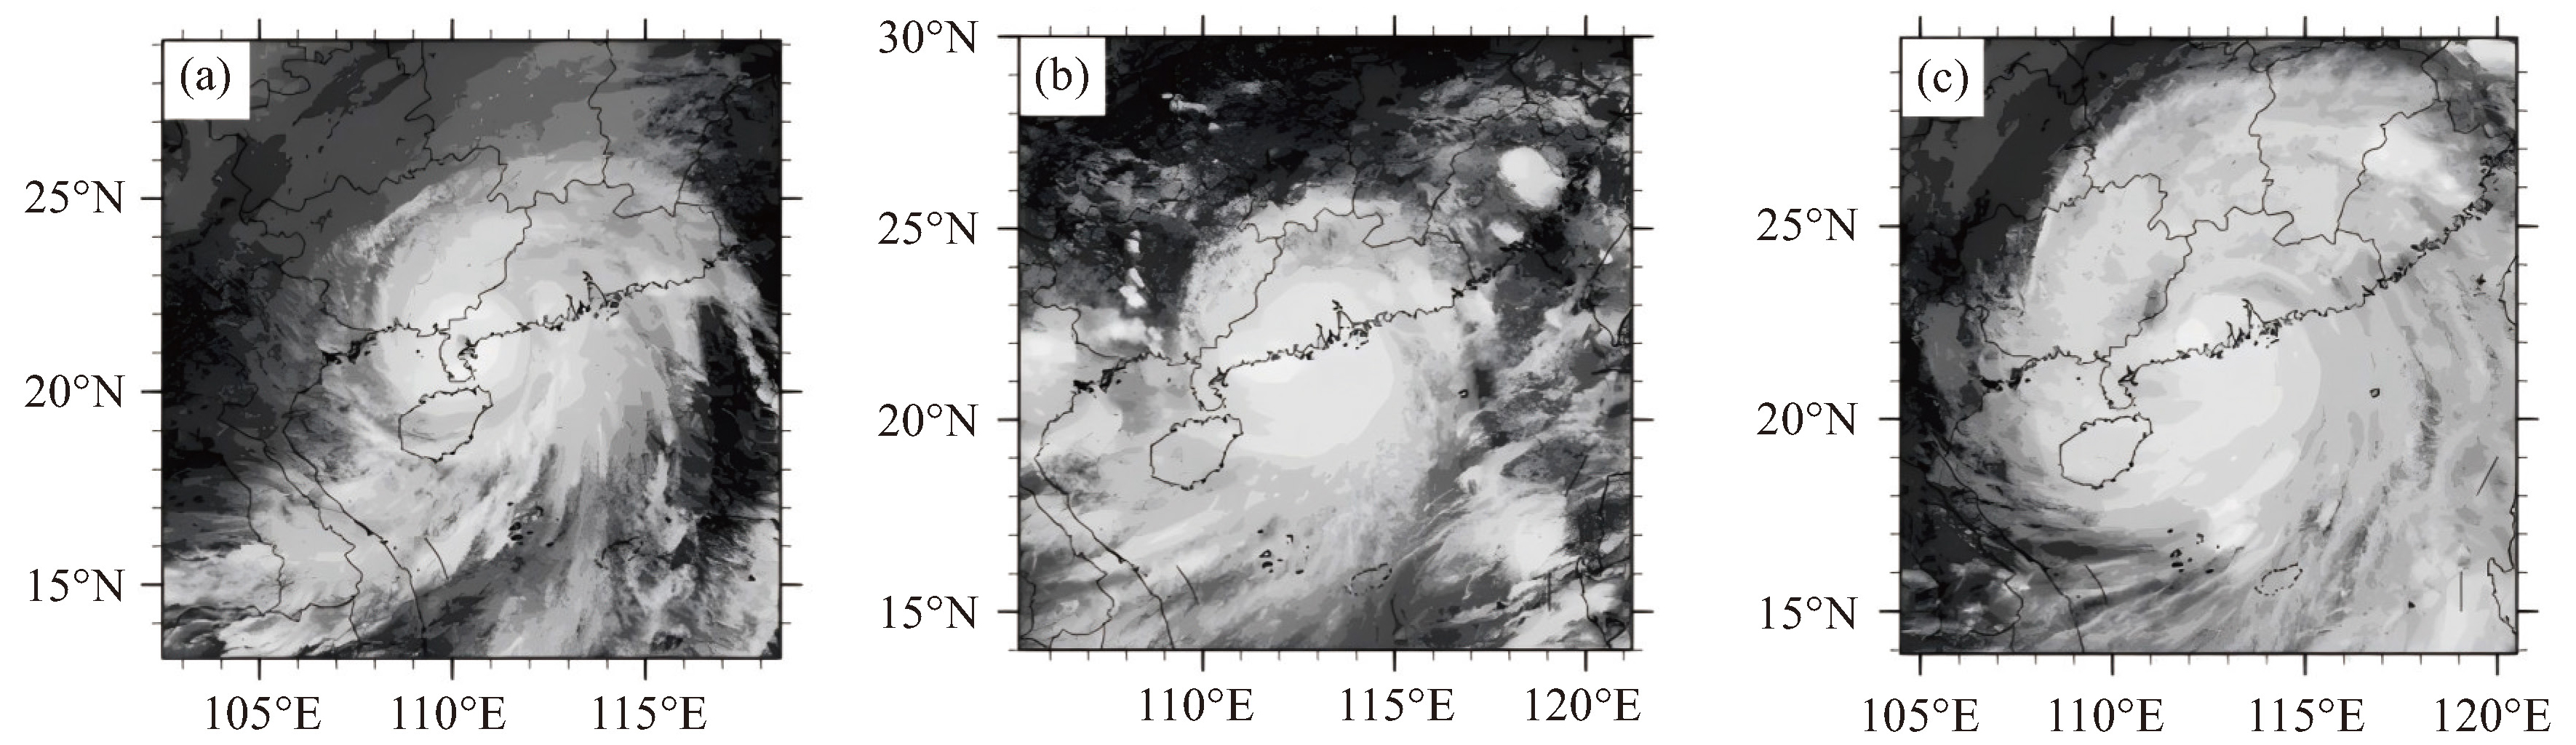
摘要: 在红外通道各亮温数据中,红外亮温可以衡量对流云顶的最高高度,而水汽亮温可以衡量水汽层顶高度。目前,大多数对台风的研究都是探讨单一亮温与降水的关系,把红外亮温和水汽亮温结合起来研究相对较少。本文基于Himawari-8卫星资料中的波段14和波段9的亮温数据,对三个南海登陆广东的强台风“彩虹”(201523)、“天鸽”(201713)和“山竹”(201822)整个生命过程中红外亮温和水汽亮温的变化特征进行了比较分析,并对红外和水汽亮温差与降水率的关系进行了探讨。结果表明:(1“) 天鸽”、“山竹”在生成初期强度为热带风暴的时候,有一段时间台风内部的水汽亮温和红外亮温和外部的差别不大,而在“山竹”强度为强台风和超强台风期间,从距离台风中心30 km的位置到台风中心的范围的水汽亮温和红外亮温明显高于其它地方。(2)在台风结构成熟的时候,台风外围及台风眼的水汽亮温总体低于红外亮温,而在台风内核区的水汽亮温和红外亮温比较接近。(3)台风结构成熟以后、在强度较强时候,内核和外围的亮温大小差异明显,而在台风登陆前后,内核和外围的亮温差明显变小。(4)对于台风“彩虹”和“天鸽”而言,台风都是在登陆陆地前后出现了对流降水,而对于台风“山竹”而言,对流降水主要出现在海上时期,登陆前后反而基本没出现对流降水。(5)在三个台风的整个生命过程中,出现降水和降水较明显的地区都是亮温差小于10 K甚至接近于0的地区,红外和水汽亮温差与降水有较好的对应关系。Abstract: At present, most studies on typhoons focus on the relationship between a single brightness temperature and precipitation, while the combined use of infrared and water vapor brightness temperatures is relatively rare. This study examines the variation characteristics of infrared and water vapor brightness temperatures during the life cycle of typhoons, including "Mujigae" (201523), "Hato" (201713) and "Mangkhut" (201822) using Himawari-8 satellite data. The analysis focuses on Band 9 (infrared) and Band 14 (water vapor), comparing these measurements to understand their relationship with the typhoon's precipitation rate. Key Findings: (1) In the early stages of Typhoon "Hato" and Typhoon "Mangkhut", when both were tropical storm, there was a period of time during which the difference between brightness temperatures at the typhoon's periphery and within the typhoon's core was small. During the time when "Mangkhut" was a severe typhoon or a super typhoon, the brightness temperatures from 30 km away from the typhoon center to the area of the typhoon center were apparently higher than other area of the typhoon. (2) When the typhoon structure is mature, at the typhoon's periphery and the eye of the typhoon, water vapor brightness temperatures are typically lower than infrared temperatures. In contrast, within the typhoon's core, these temperatures are more similar. (3) When the typhoon is over the sea, a significant difference in brightness temperature is observed between the core and the periphery. This difference diminishes as the typhoon approaches landfall. (4) For Typhoon "Mujigae" and Typhoon "Hato", convective precipitation occurred after the typhoon made landfall, but for Typhoon "Mangkhut", convective precipitation mainly occurred when the typhoon was over the sea, while almost no convective precipitation occurred when the typhoon made landfall. (5) Throughout the typhoon's lifecycle, areas with significant precipitation or heavy rainfall correspond to regions where the D-value (the difference between infrared and water vapor brightness temperatures) is less than 10 K, or even close to 0 K. This indicates a strong correlation between the D-value and precipitation intensity.
-

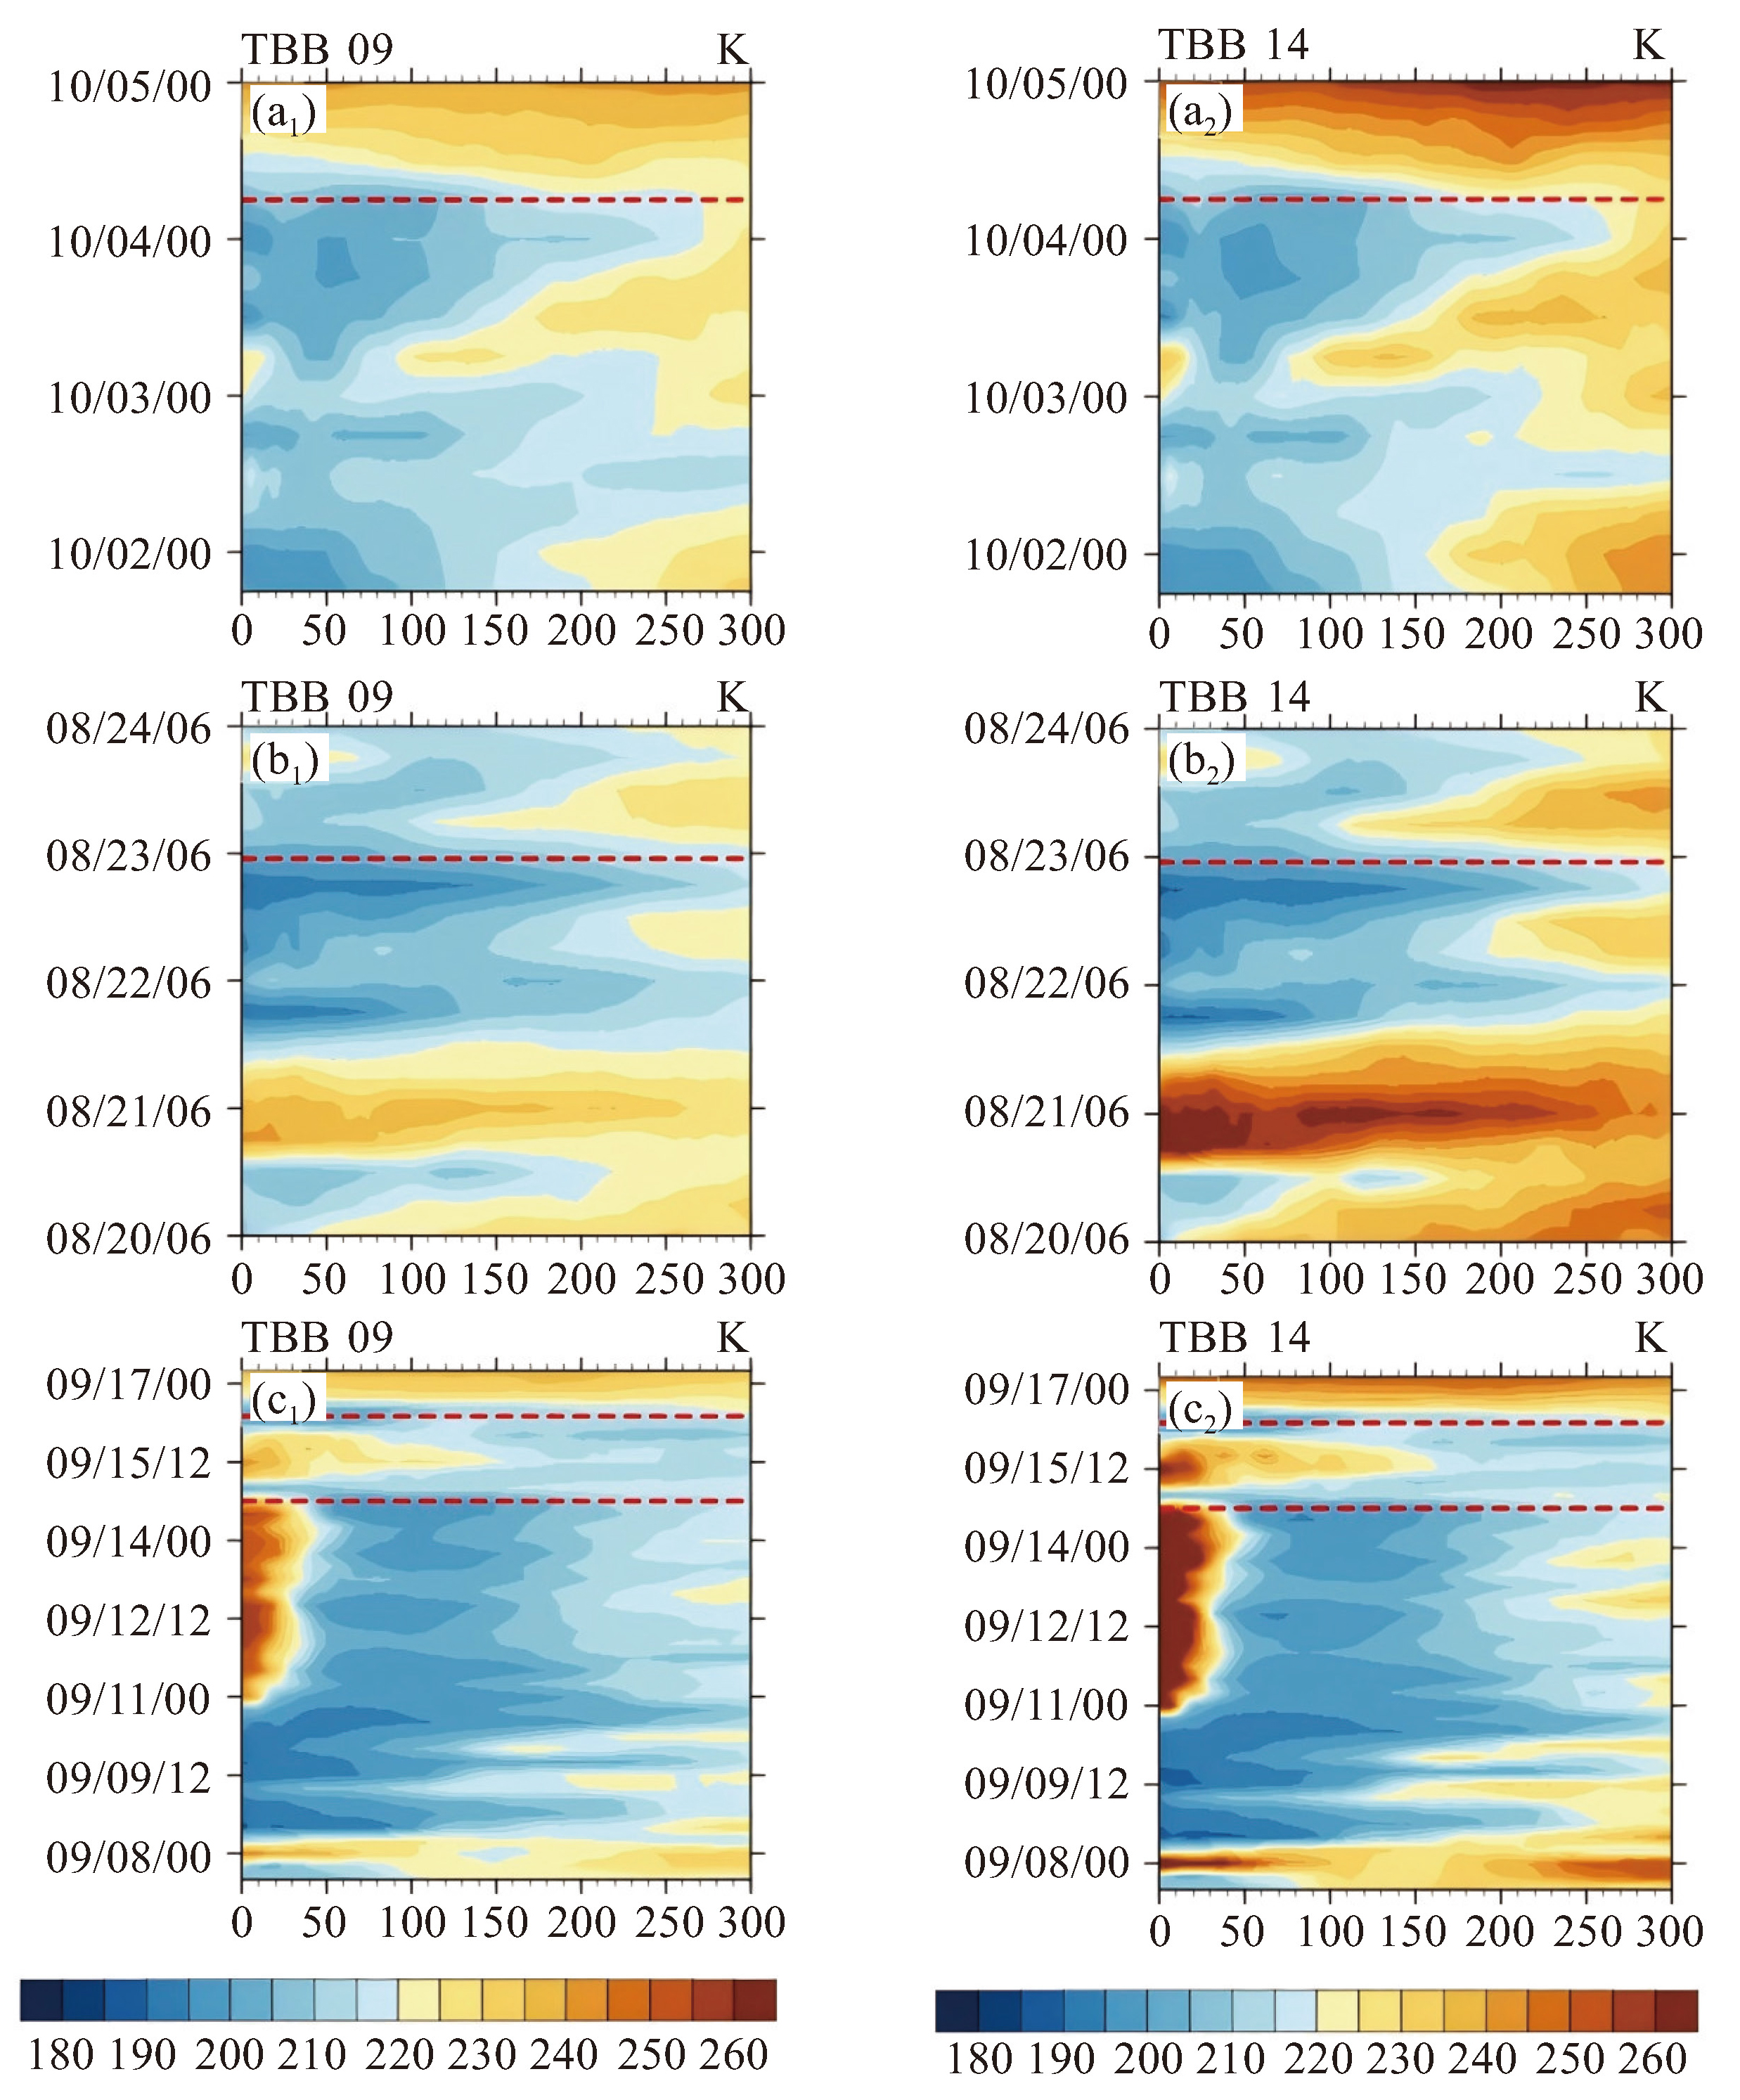
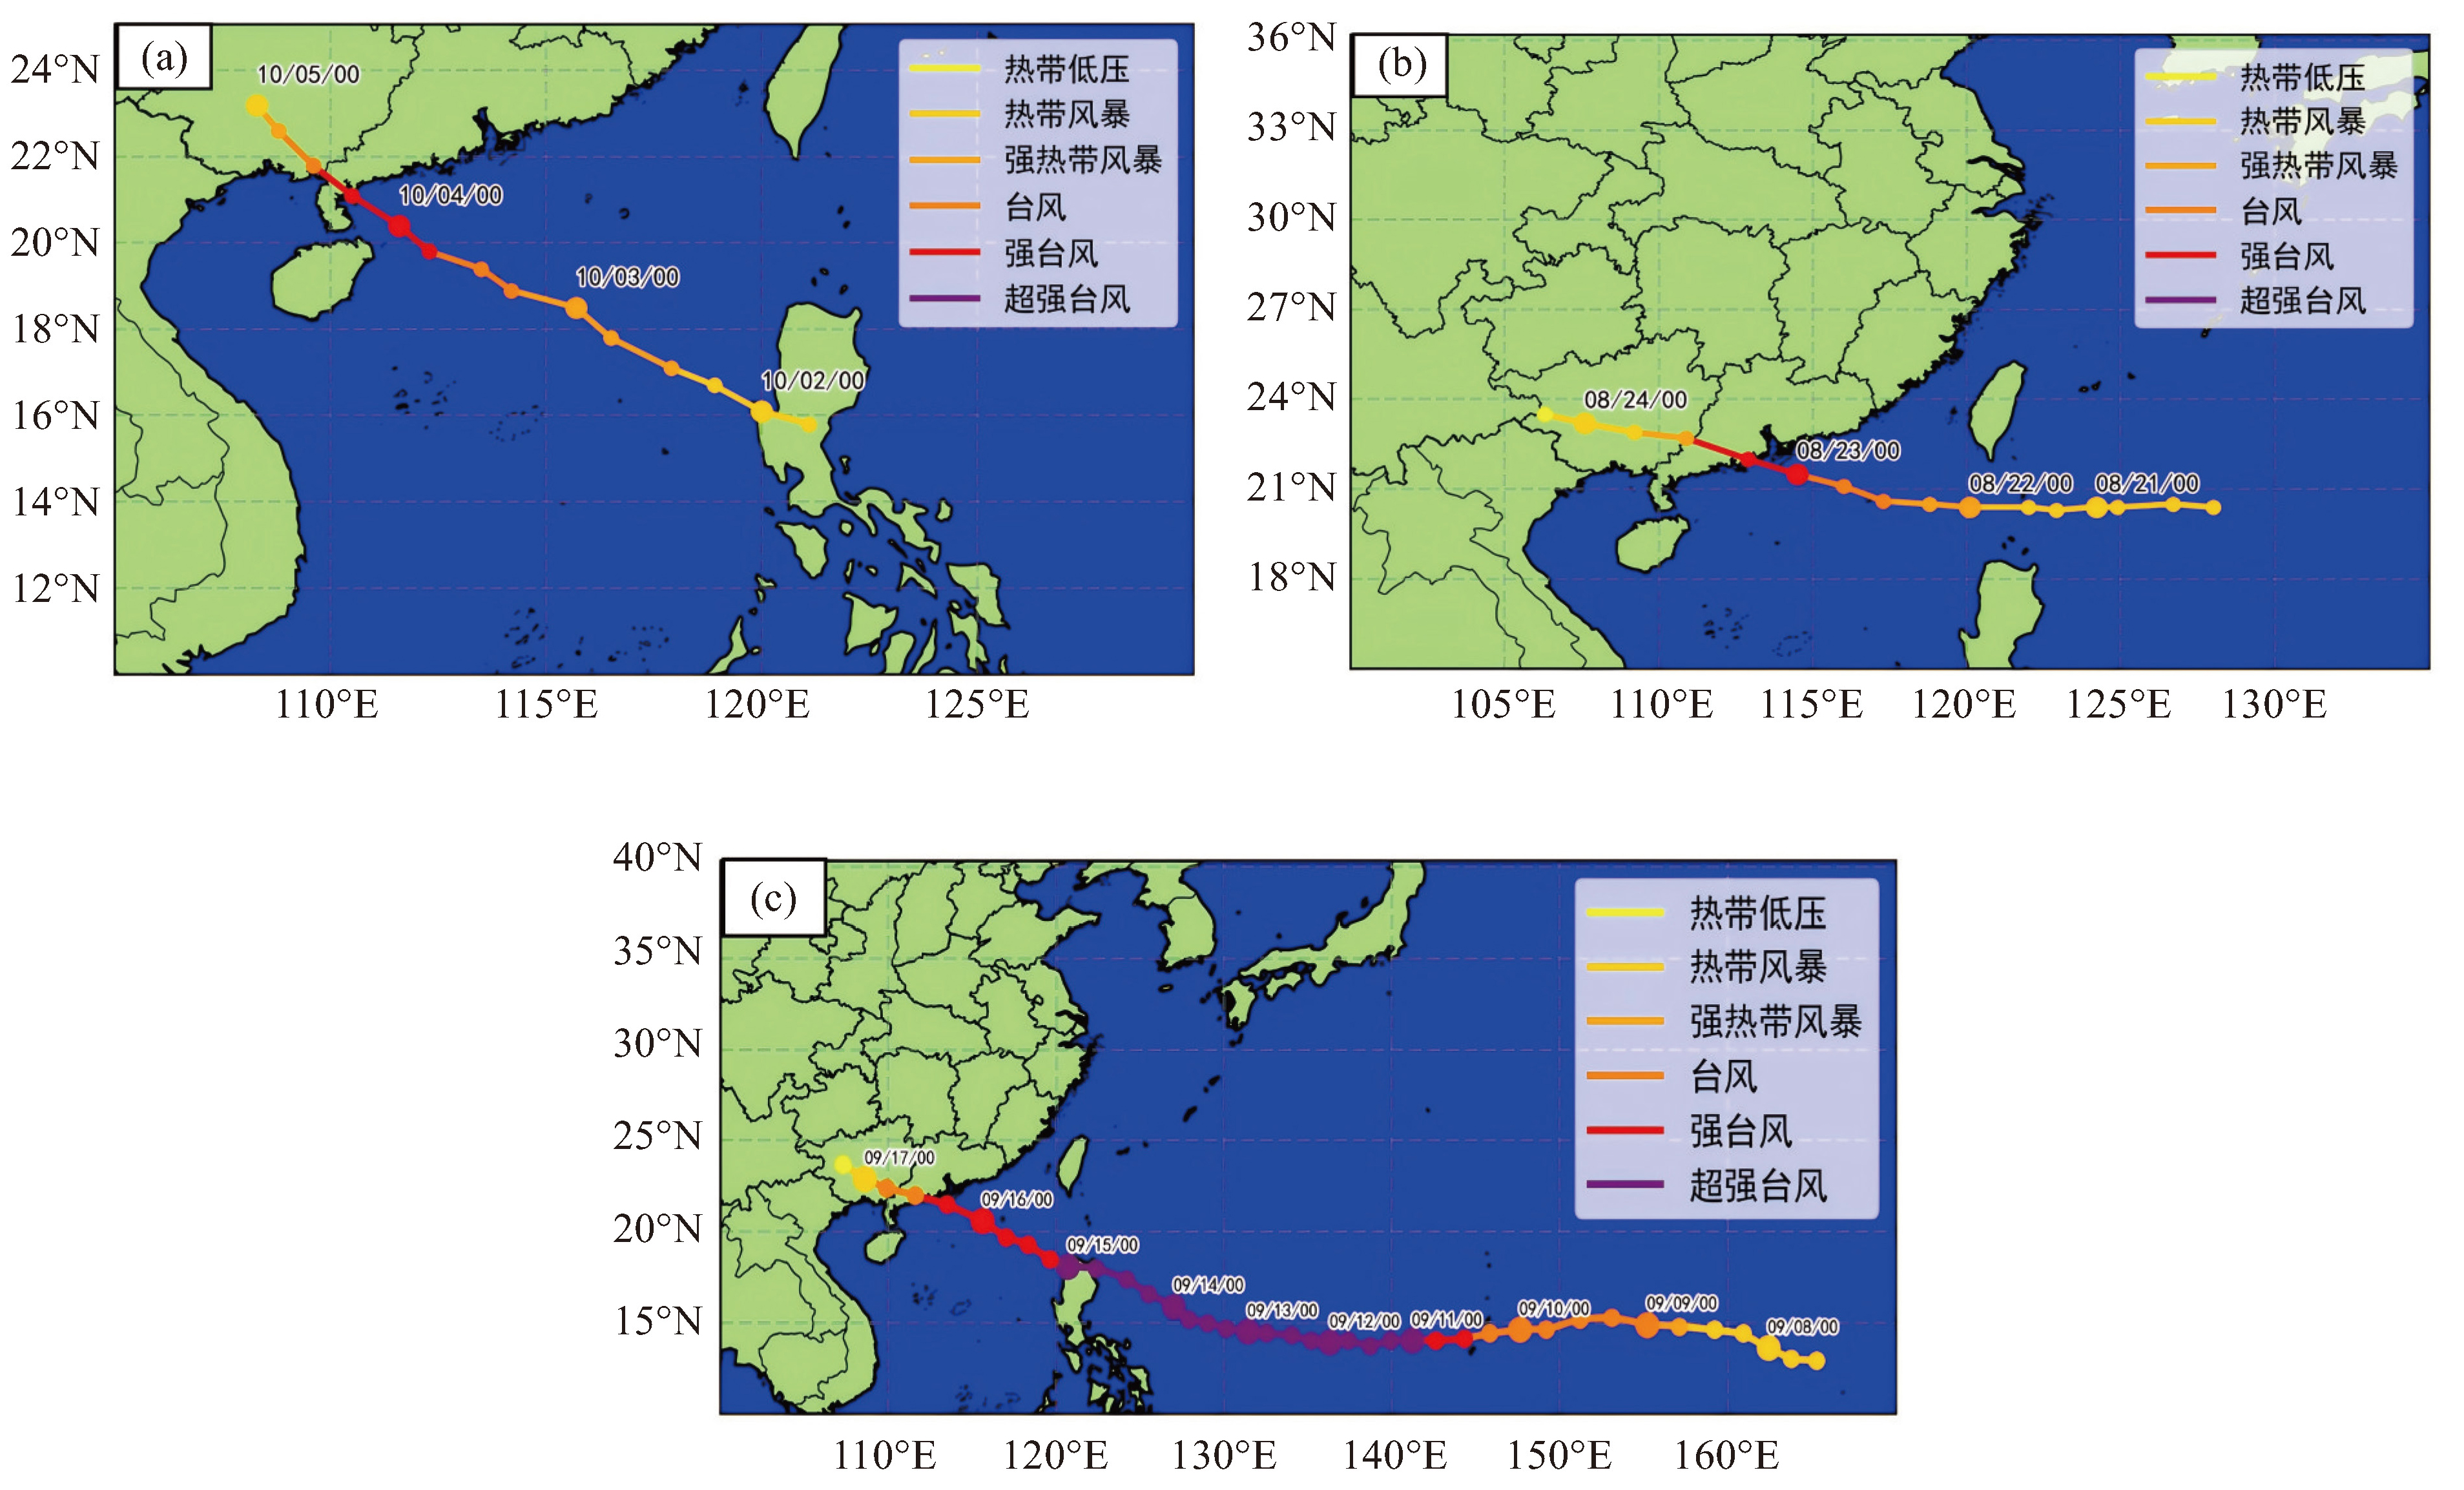
图 3 “彩虹”(a1、a2)、“天鸽”(b1、b2)、“山竹”(c1、c2)从生成到消散的过程中水汽亮温(左列,单位:K)和红外亮温(右列,单位:K)的方位角平均值距台风中心的径向分布随时间(月/日/时)变化,台风中心参考点经纬度如图 1中所示,其中c1、c2图中下方红色虚线表示“山竹”在菲律宾登陆,上方红色虚线表示在广东登陆

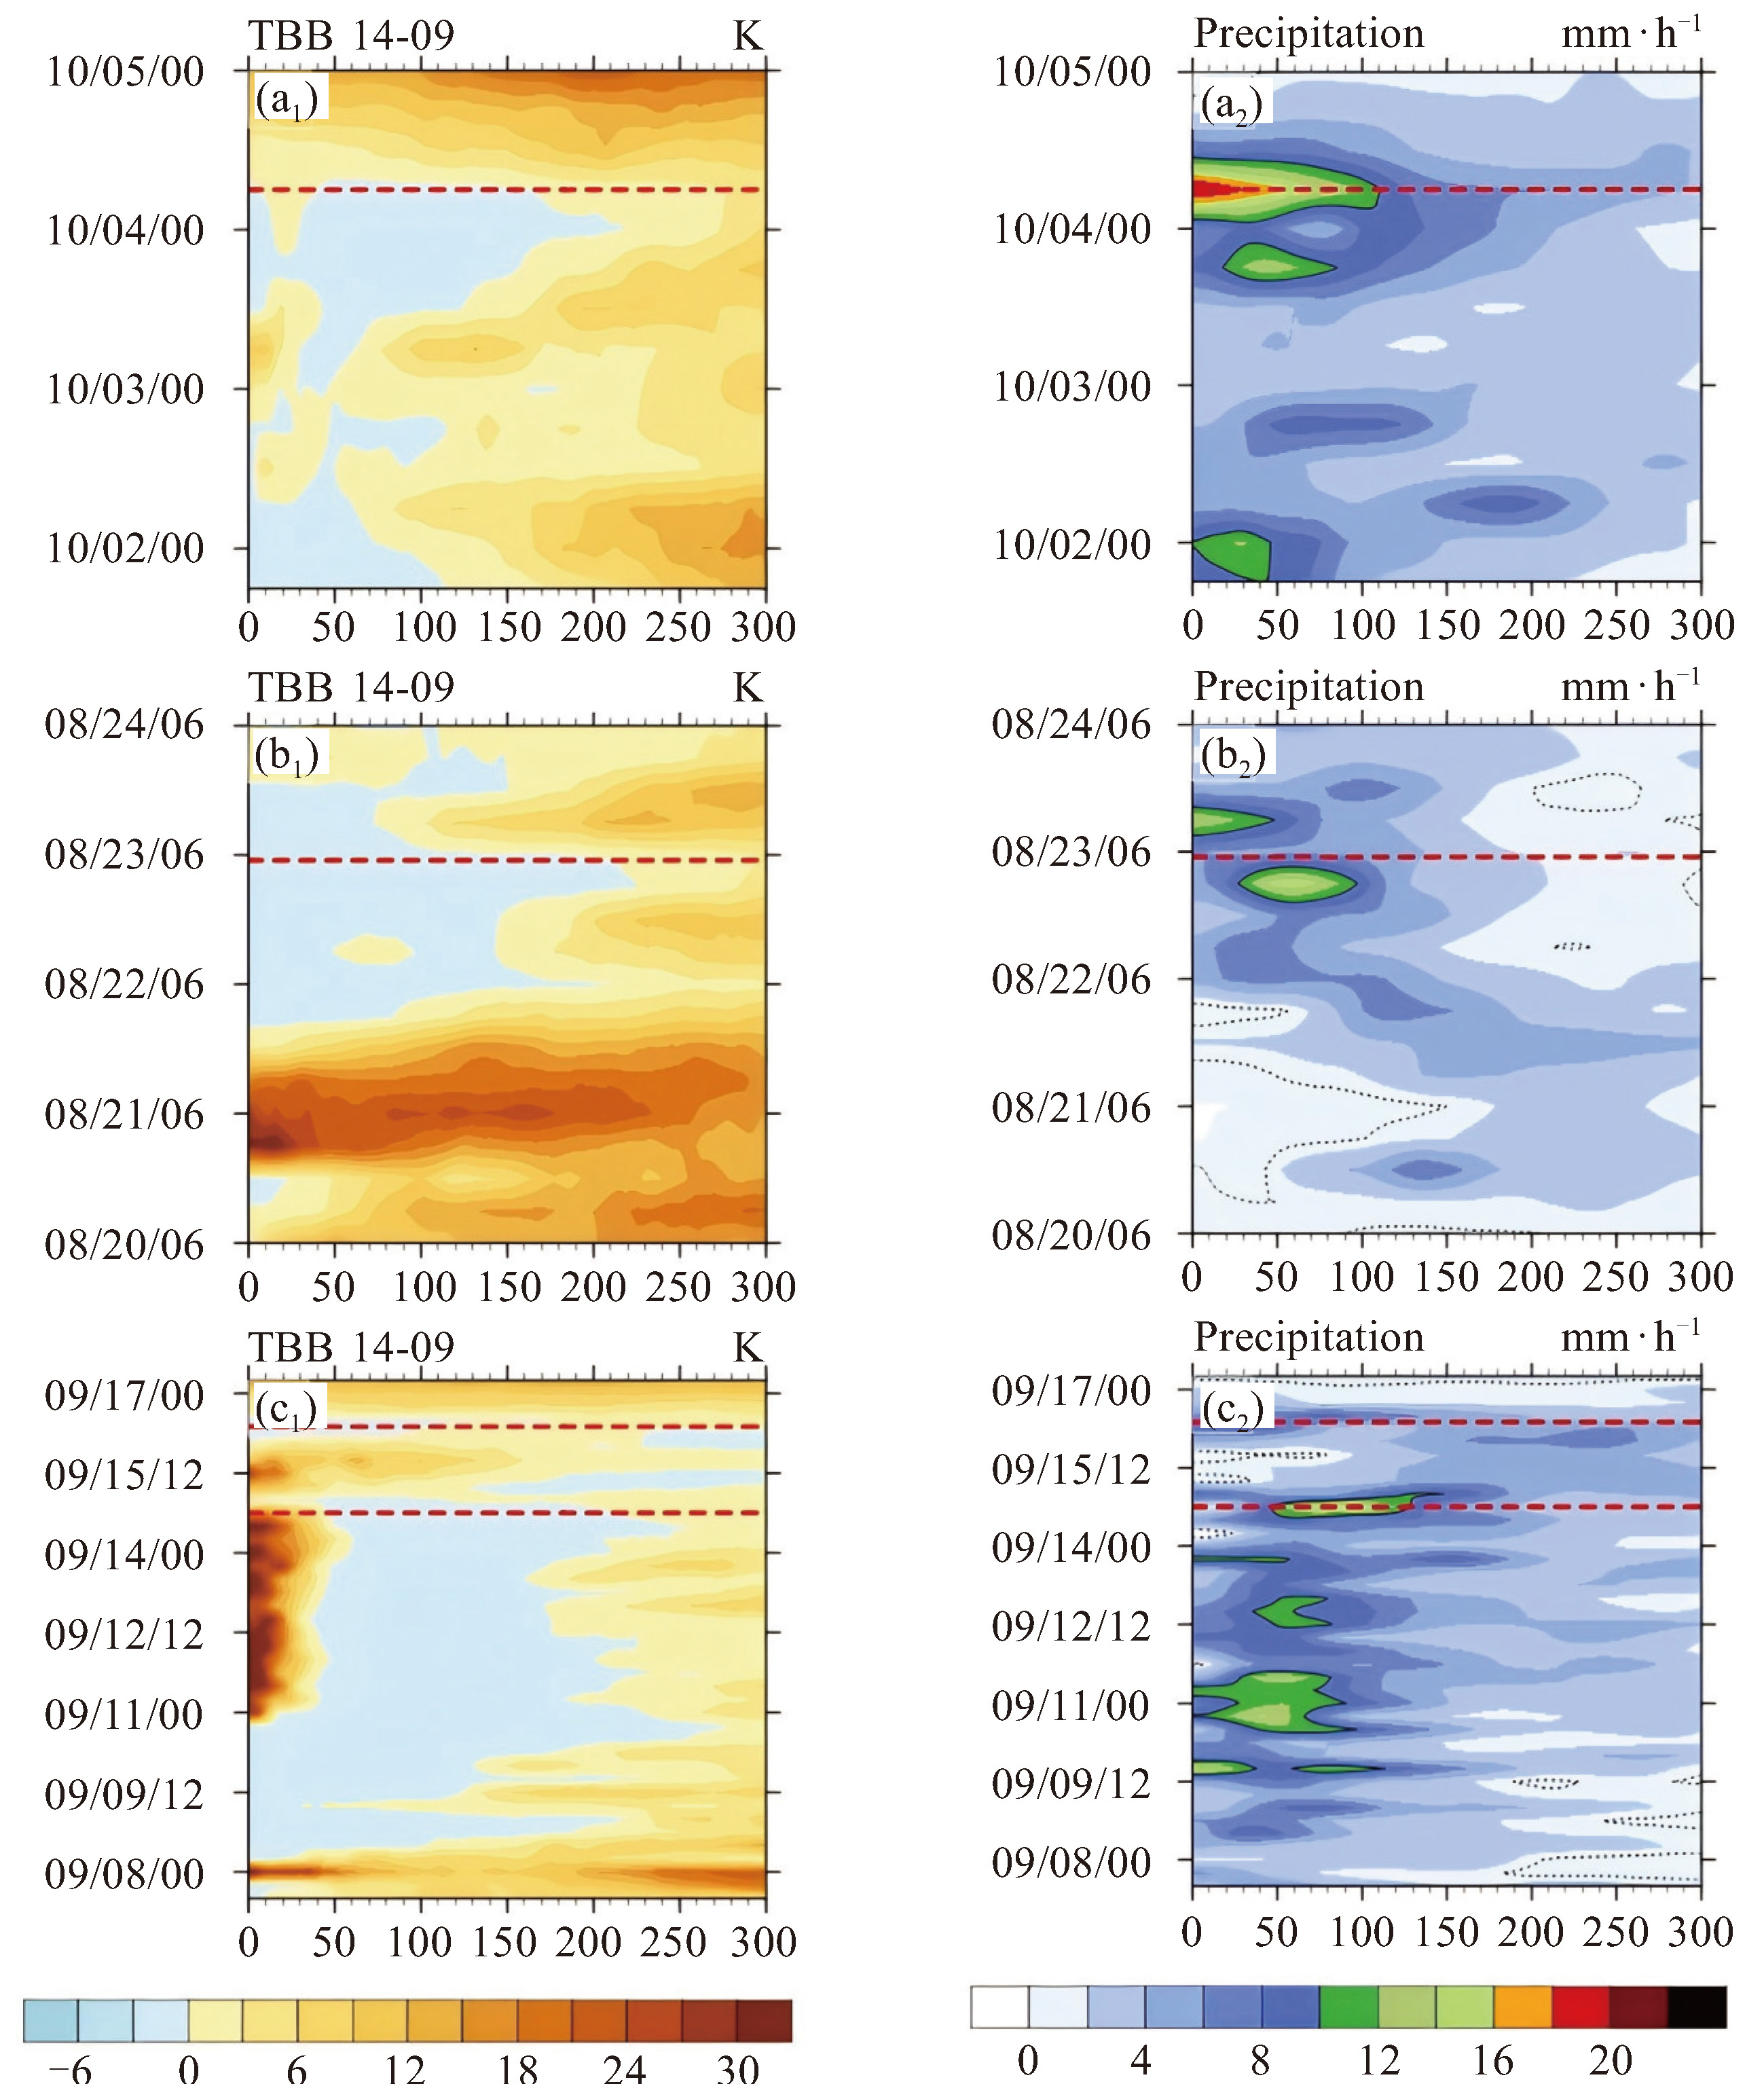
图 4 彩虹”(a1、a2)、“天鸽”(b1、b2)、“山竹”(c1、c2)从生成到消散的过程中红外和水汽亮温差(左图,单位:K)和降水率(右图,单位mm·h-1,实线为对流降水,实线和虚线间为层云降水)的方位角平均值距台风中心的径向分布随时间(月/日/时)变化,台风中心参考点经纬度如图 1中所示,红色虚线对应的时间代表台风的登陆时间,其中c1、c2中下方虚线表示“山竹”在菲律宾登陆,上方虚线表示在广东登陆

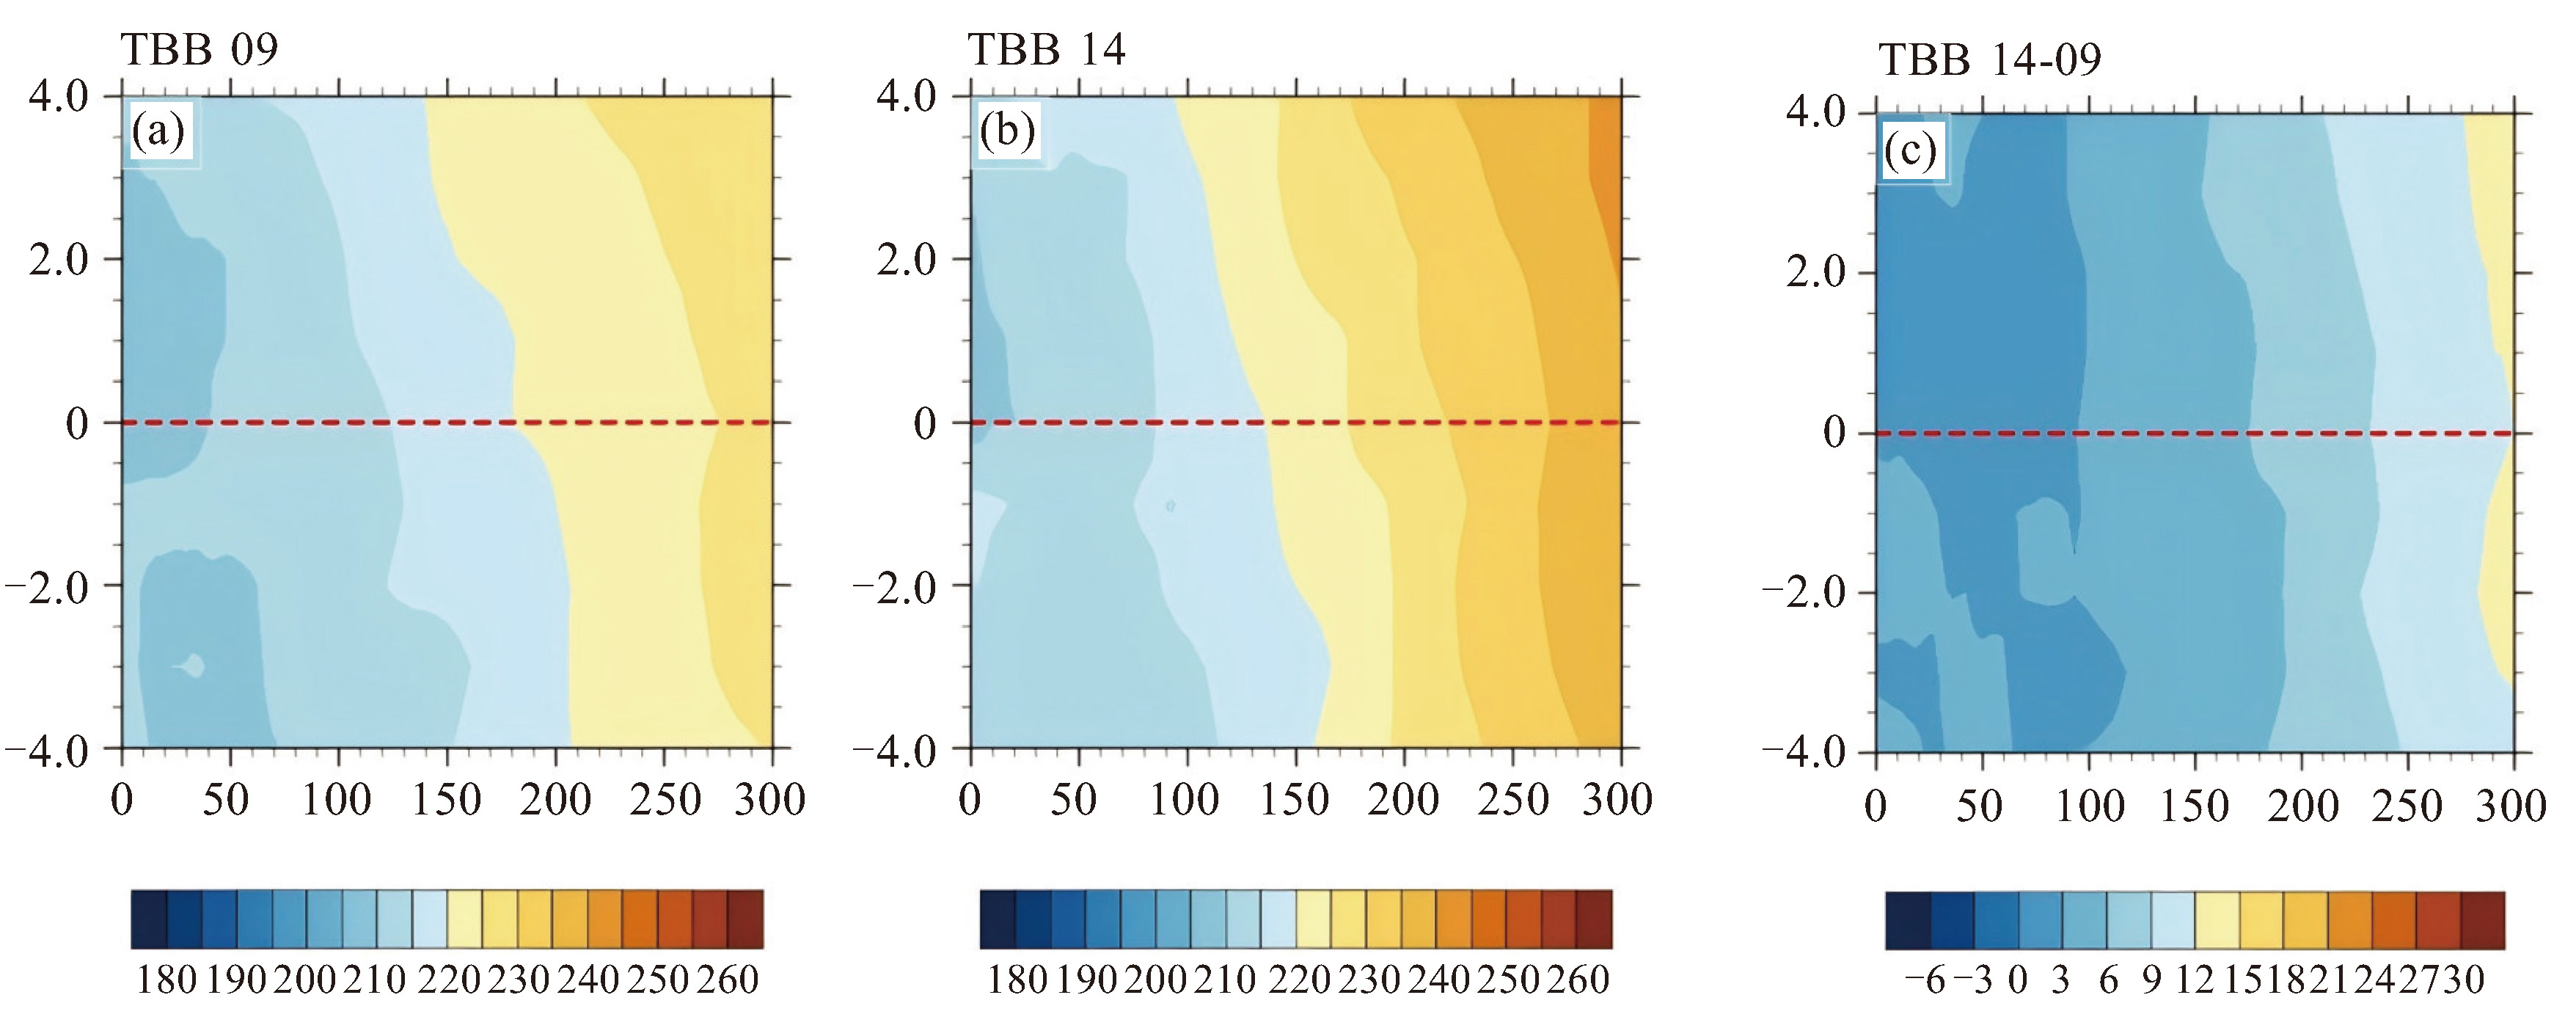
图 5 Himawari-8有数据以来登陆广东且登陆后才内陆停留超过24 h的10个台风登陆前后4 h合成分析出来的水汽亮温(a)、红外亮温(b)和红外和水汽亮温差(c)的(单位:K)的方位角平均值距台风中心的径向分布随时间(以登陆时间为0 h)变化,红色虚线对应的时间代表台风的登陆时间

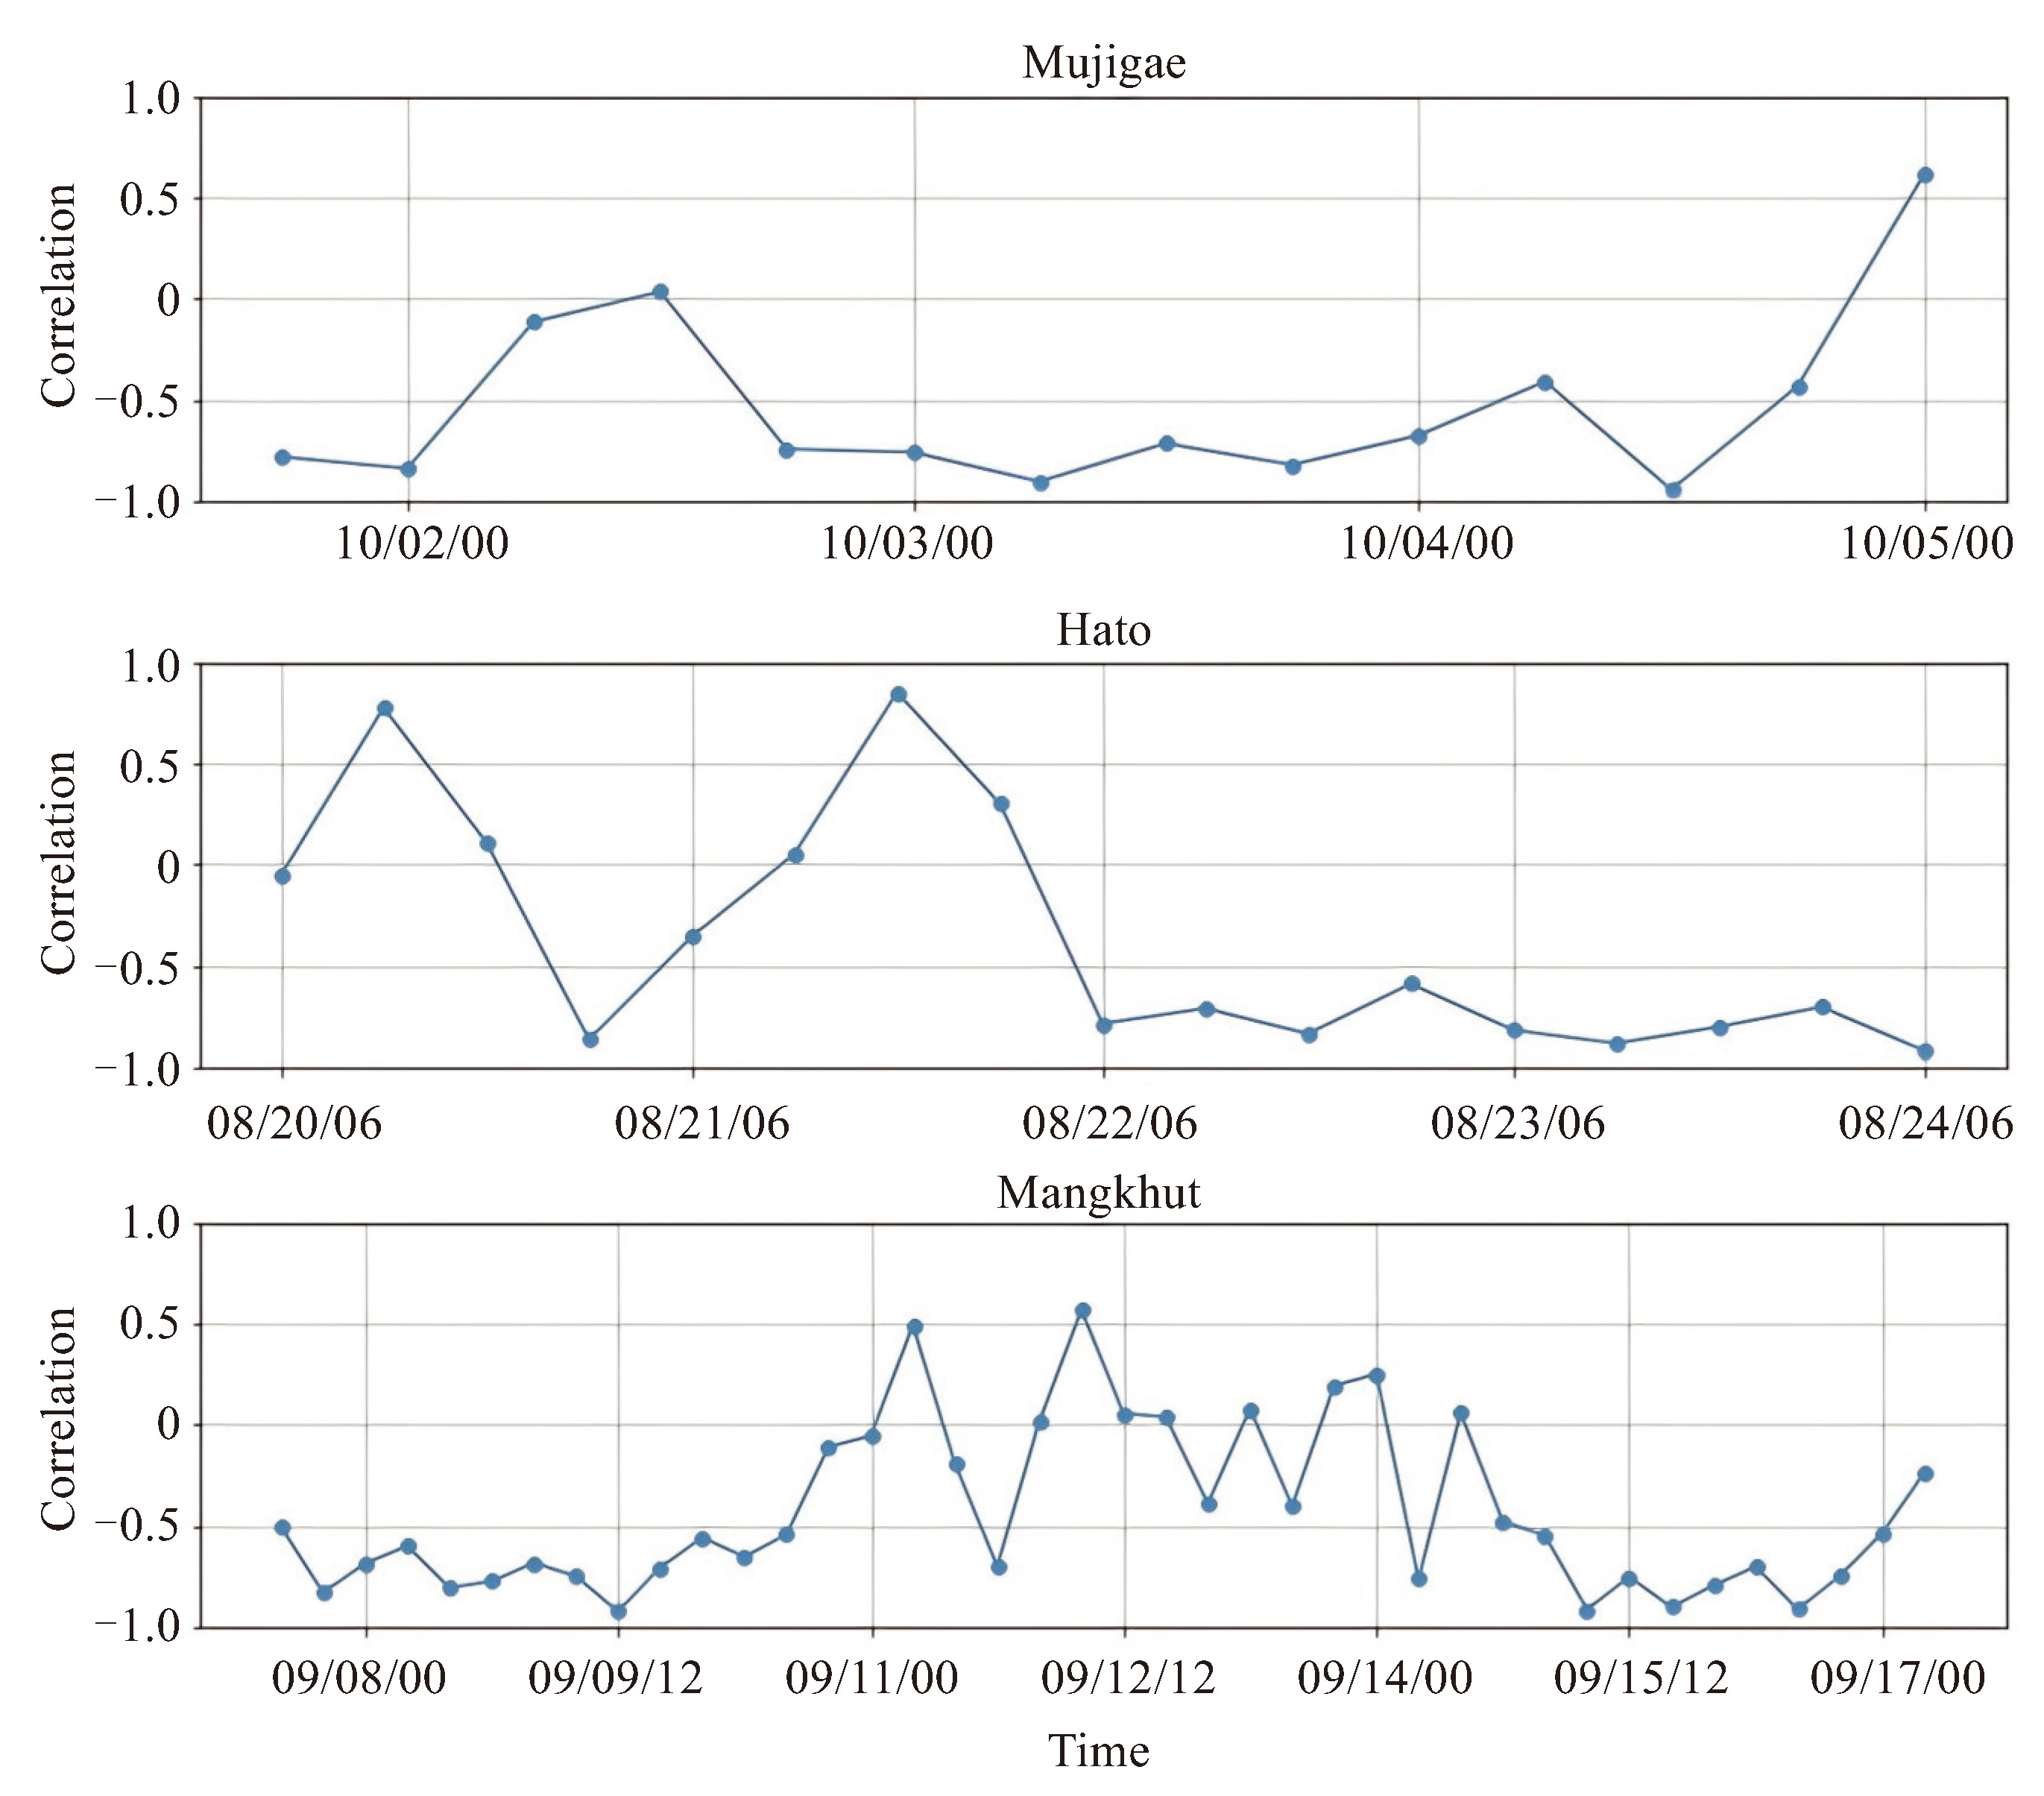
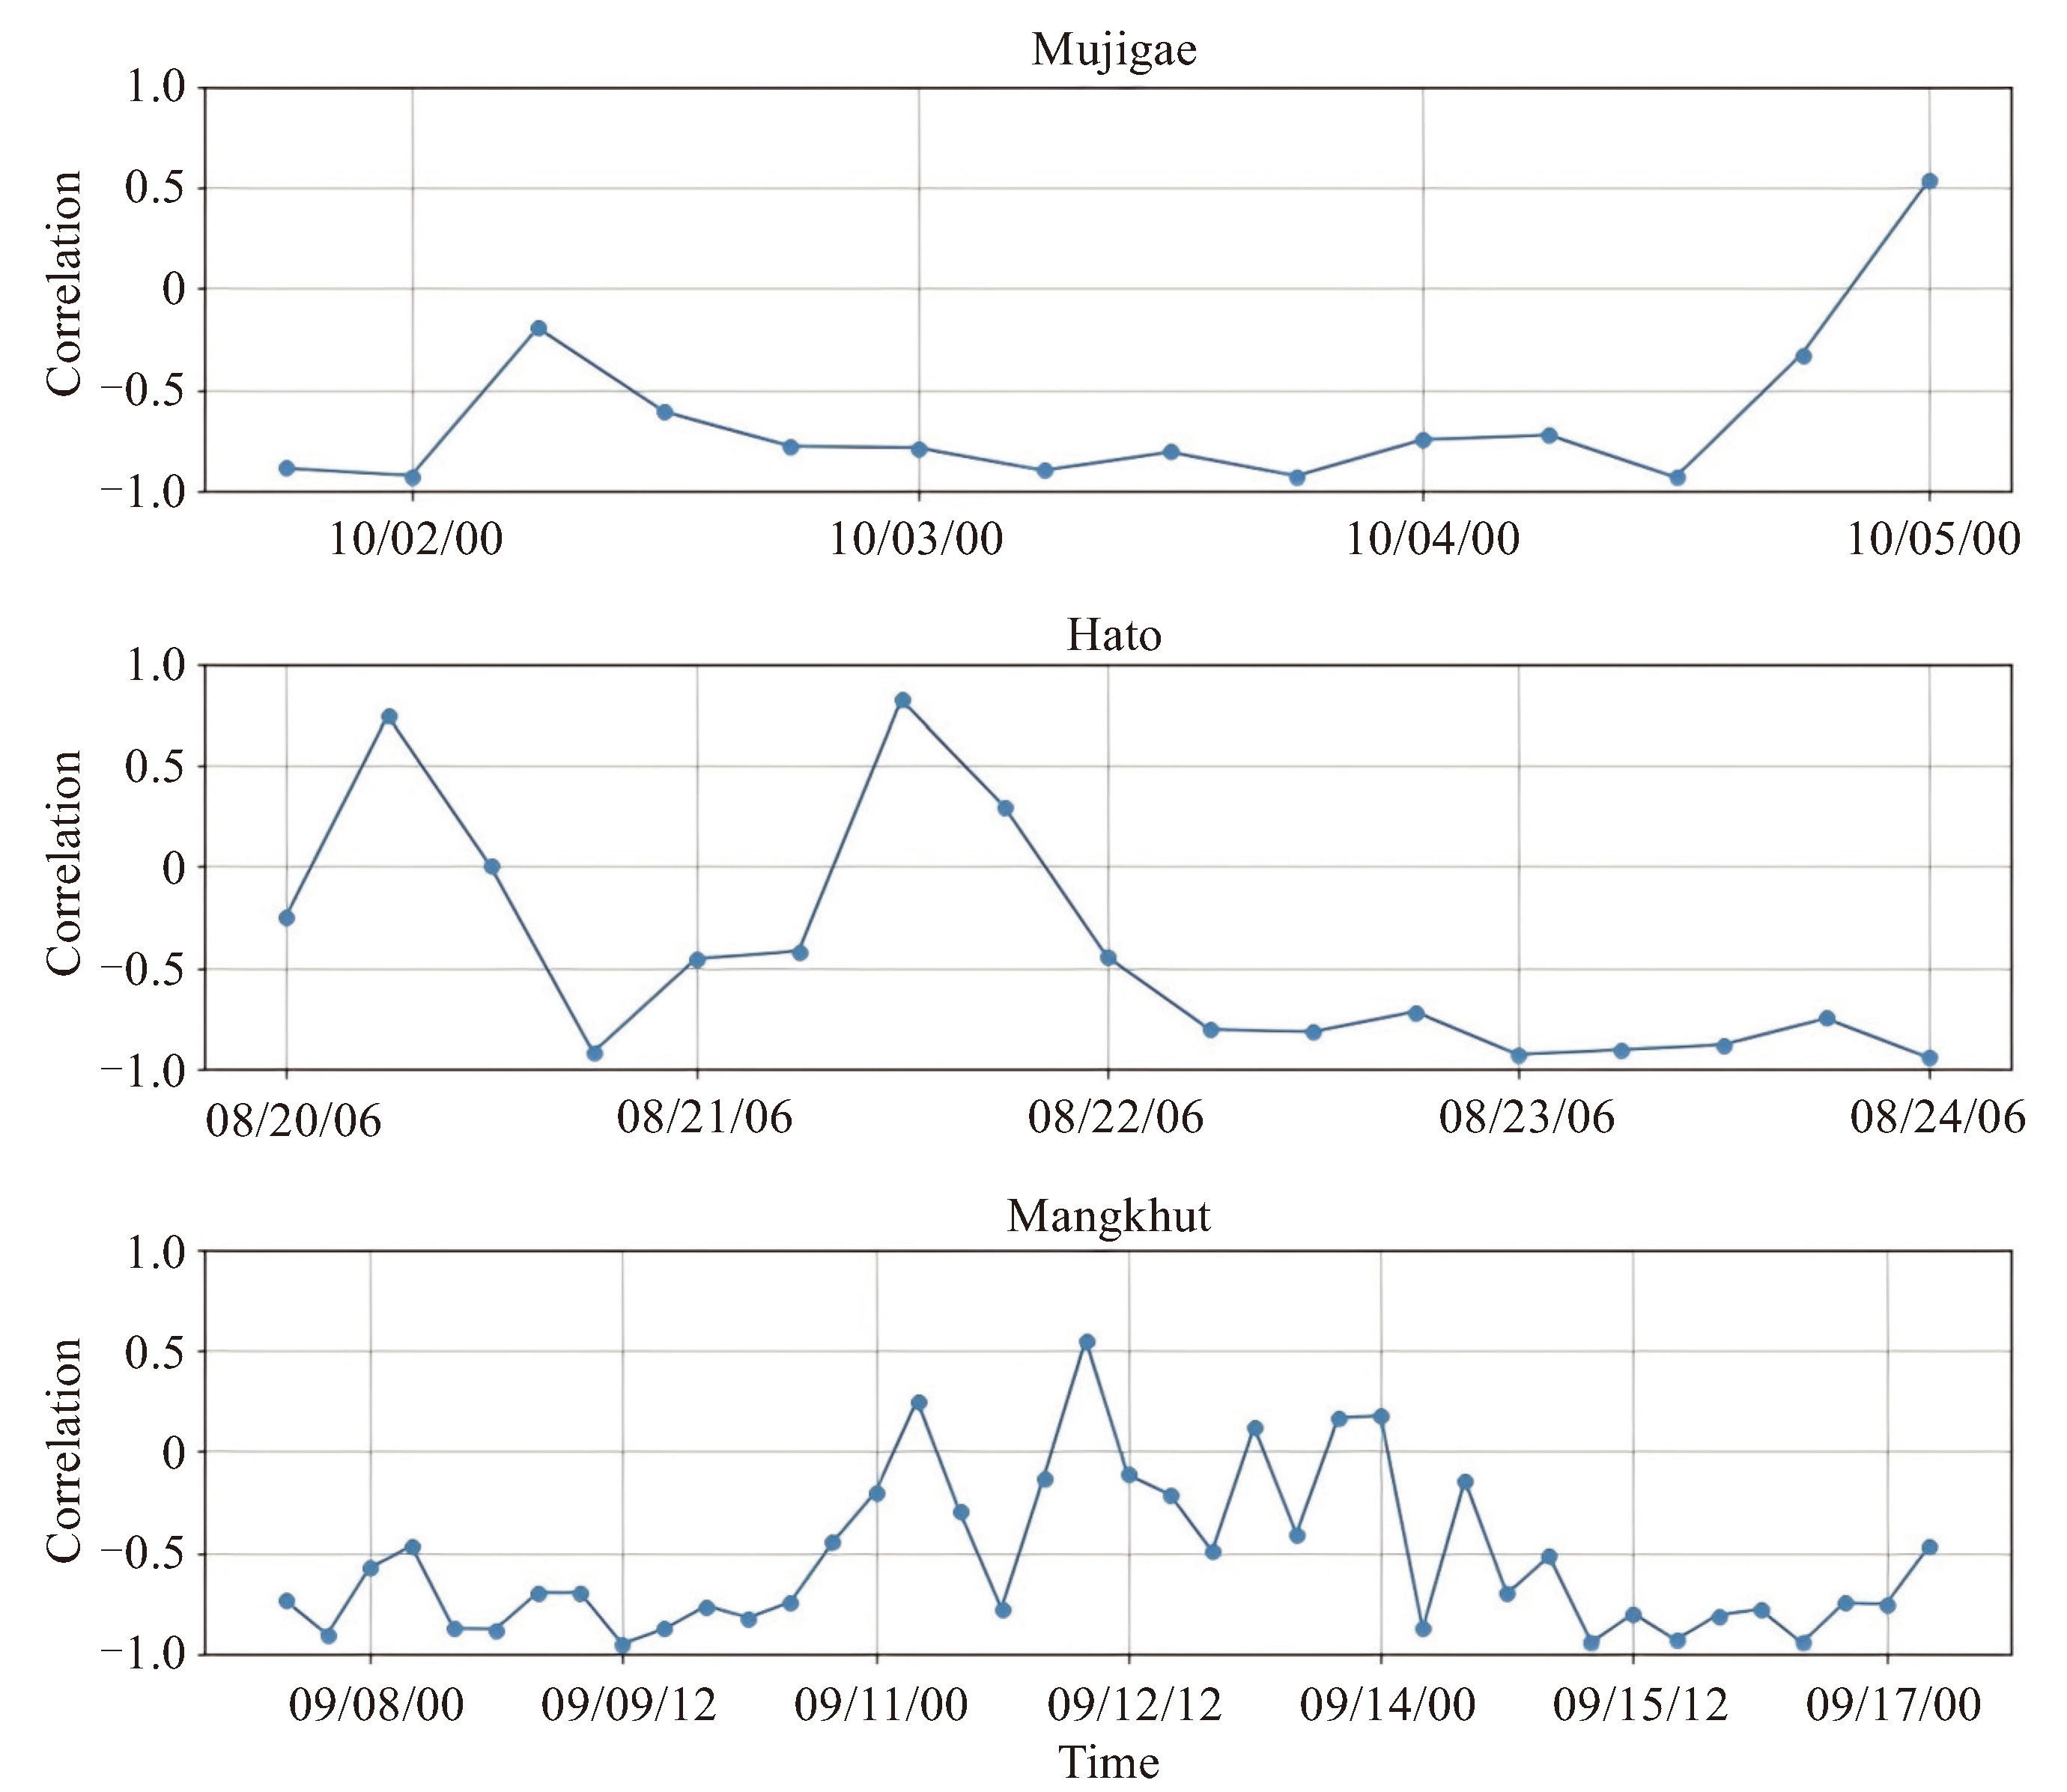
图 6 彩虹”、“天鸽”、“山竹”从生成到消散的过程中台风中心300 km范围内红外水汽亮温差与降水率的相关系数随时间(月/日/时)变化,台风中心参考点经纬度如图 1中所示
表 1 Himawari-8的16个波段及其对应的中心波长
波段 中心波长/μm 波段1 0.46 波段2 0.51 波段3 0.64 波段4 0.86 波段5 1.6 波段6 2.3 波段7 3.9 波段8 6.2 波段9 7.0 波段10 7.3 波段11 8.6 波段12 9.6 波段13 10.4 波段14 11.2 波段15 12.3 波段16 13.3  下载: 导出CSV
-
[1] 赵震. 2016年台风"莫兰蒂"结构特征的多源卫星探测分析[J]. 高原气象, 2019, 38(1): 156-164. [2] 高延康, 赵铜铁钢, 田雨, 等. 台风活动对中国沿海地区极端降水的影响[J]. 水科学进展, 2023, 34(1): 1-11. [3] 唐文, 苏洵. 1621秋季台风"莎莉嘉"路径突变和暴雨成因分析[J]. 气象研究与应用, 2017, 38(4): 32-38, 118. [4] 李彩玲, 炎利军, 李兆慧, 等. 1522号台风"彩虹"外围佛山强龙卷特征分析[J]. 热带气象学报, 2016, 32(3): 416-424. [5] 张晶晶, 俞科爱, 徐彬, 等. 3次南海秋季台风在宁波沿海强天气过程对比分析[J]. 浙江气象, 2020, 41(1): 43-47. [6] 黄滢, 潘一铭, 蒋静. 秋季台风"海燕"的特点及成因分析[J]. 气象研究与应用, 2019, 40(3): 13-17. [7] 黄巾旗, 王盛繁, 梁毅进, 等. 2015年秋季台风"彩虹"暴雨诊断分析[J]. 中国农学通报, 2017, 33(14): 87-94. [8] 韩鼎妍, 李敏, 胡睿, 等. 秋季登陆广东热带气旋特征变化及机制分析[J]. 热带海洋学报, 2024, 43(1): 64-78. [9] 姚秀萍, 彭思越. 秋季西北太平洋上热带气旋研究进展及展望[J]. 海洋气象学报, 2023, 43(3): 1-8. [10] 许冬梅, 沈菲菲, 李泓, 等. 新一代静止气象卫星葵花8号的晴空红外辐射率资料同化对台风"天鸽"的预报影响研究[J]. 海洋学报, 2022, 44(3): 40-52. [11] 燕亚菲, 谈建国, 崔林丽, 等. 利用葵花8号(Himawari-8)高时空分辨率的红外亮温资料估计台风莫兰蒂的短时强降水及其演变[J]. 气象, 2019, 45(3): 318-329. [12] 方红亮. 基于地球静止气象卫星的地表参数遥感研究进展[J]. 遥感学报, 2021, 25(1): 109-125. [13] Tierra M C M, Bagtasa G. Identifying the rapid intensification of tropical cyclones using the Himawari-8 satellite and their impacts in the Philippines[J]. International Journal of Climatology, 2023, 43(1): 1-16. [14] Ma X L, Wang J, Huang H, et al. Comprehensive analysis of typhoon nangka based on the satellite data from the GPM, CloudSat and himawari-8[J]. Atmosphere, 2023, 14(3): 440. [15] Tan J K, Yang Q D, Hu J J, et al. Tropical cyclone intensity estimation using himawari-8 satellite cloud products and deep learning[J]. Remote Sensing, 2022, 14(4): 812. [16] 杨磊, 孙丽, 王东东, 等. 2017年"海棠"台风影响辽宁不同区域极端暴雨成因分析[J]. 气象与环境学报, 2020, 36(1): 1-10. [17] 陈渭民. 卫星气象学[M]. 3版. 北京: 气象出版社, 2017. [18] 杨磊, 才奎志, 孙丽, 等. 基于葵花8号卫星资料的沈阳两次暴雨过程中对流云特征对比分析[J]. 暴雨灾害, 2020, 39(2): 125-135. [19] 周鑫, 周顺武, 覃丹宇, 等. 利用FY-2F快速扫描资料分析对流初生阶段的云顶物理量特征[J]. 气象, 2019, 45(2): 216-227. [20] Pang S M, Li J N, Guo T Y, et al. Influence of the species number of hydrometeors on numerical simulation of the super typhoon mujigae in 2015[J]. Asia-Pacific Journal of Atmospheric Sciences, 2024, 60(1): 29-47. [21] 朱小燕, 邓雅倩, 黄春莎. 1522号台风"彩虹"路径及降水分析[J]. 河南农业, 2016(14): 63-64. [22] 王炳赟, 魏鸣, 范广洲, 等. 1522强台风"彩虹"螺旋雨带中衍生龙卷的超级单体演变与机理研究Ⅰ: 谱宽和速度[J]. 热带气象学报, 2018, 34(4): 472-480. [23] 沈菲菲, 闵锦忠, 吴乃庚, 等. 扩展水凝物控制变量的雷达资料同化对台风"天鸽"数值模拟的影响[J]. 热带气象学报, 2023, 39(1): 23-36. [24] 谭晓伟. 边界层高度和动量粗糙度的不确定性对台风"天鸽"(1713)模拟的影响[J]. 海洋气象学报, 2023, 43(1): 39-51. [25] 张志伟, 郭凤霞, 初雨, 等. 超强台风"山竹"(1822)的闪电活动特征[J]. 大气科学, 2023, 47(2): 399-416. [26] 徐敬涵, 冉令坤, 炎利军, 等. 台风"山竹"外围强龙卷的结构和机理分析[J]. 大气科学, 2024, 48(3): 843-858. [27] 吕心艳, 许映龙, 董林, 等. 2018年西北太平洋台风活动特征和预报难点分析[J]. 气象, 2021, 47(3): 359-372. [28] Yan L, Zhou Y S, Wang S Z, et al. Composite analysis of the rainfall distribution caused by strong and weak landfalling tropical cyclones over the China Mainland[J]. Dynamics of Atmospheres and Oceans, 2025, 110: 101551. [29] 毛家燊, 陈逸伦, 张奡祺, 等. 崇左和防城港两地的台风韦帕(201907)降雨雨滴谱对比分析[J]. 大气科学, 2023, 47(3): 655-666. [30] 高晓梅, 李峰, 王文波, 等. 台风"利奇马"引发山东极端暴雨的多尺度特征分析[J]. 海洋气象学报, 2022, 42(2): 33-43. -

 点击查看大图
计量
- 文章访问数: 2
- HTML全文浏览量: 1
- PDF下载量: 0
- 被引次数: 0
 粤公网安备 4401069904700003号