



Spatiotemporal Characteristics and Physical Mechanisms of the Summer High Temperature Heat Waves over South China in 2020
-
摘要: 基于1960—2020年华南地区183个气象站和NOAA/CPC逐日最高气温、NCAR/NCEP日再分析资料,采用百分位法提取华南地区区域性高温热浪事件,分析其时空变化特征及可能的物理机理。结果表明:(1)与1991—2020年气候态和2003年相比,2020年夏季华南区域性高温日开始时间偏早、结束偏晚、高温日数偏多和高温热浪事件发生频次偏多。2020年夏季共有4次区域性高温热浪事件,第2、3次事件偏湿且持续时间最长,高温日数占比为64.2%(34天/53天)。(2)2020年夏季高温期南亚高压偏强偏东、高空西风急流偏强偏东和副高偏强偏西,华南地区受异常反气旋环流控制。在欧亚大陆中高纬度地区第2、3次事件中200 hPa位势高度异常为“西低东高”、第1、4次事件则为“西高中低东高”分布型。(3)海温异常偏暖是华南高温高湿的重要前兆因子,2020年华南高温期间大气以偏湿为主,与春季—盛夏印度洋、热带大西洋、西北太平洋和东北太平洋海温持续性一致偏暖有关,激发从欧亚中西部向东传播到东亚大陆的Rossby波列,有利于夏季东亚地区维持南亚高压偏强偏东、高空西风急流偏强偏东和副高强盛且西伸的大气环流异常结构,华南地区受异常反气旋环流控制,诱发持续性高温高湿热浪事件。Abstract: Based on the daily maximum temperature from 183 ground stations in South China and NOAA/CPC gridded datasets and NCAR/NCEP reanalysis data during 1960-2020, this study identifies regional-level heatwave events (HWEs) in South China by applying a percentile analysis method, and investigates their spatiotemporal characteristics and underlying physical mechanisms. The results revealed that: (1)Compared to the 1991-2020 climatological average state and the 2003 summer HWEs in South China, the 2020 summer HWEs exhibited earlier onset and later termination, with high frequency of the highwave day (HWD) and HWE. Four strong regional HWEs occurred during summer 2020, with the second and third HWEs being wetter and persisting longest, and accounting for 64.2% (34 days/53 days) of the HWDs. (2) In 2020 heat episodes, the South Asian high pressure (SAHP) was strong and eastward, the upper-level jet stream (ULJS) was strong and eastward, and the Northwest Pacific high pressure (NWPHP)was strong and westward. The South China region was controlled by abnormal anticyclonic circulation. In the mid-and high-latitude Eurasian continent, the second and third HWEs showed "west-low/east-high" patterns in summer 2020, with the first and fourth HWEs exhibiting a "high-low-high" pattern. (3) The abnormally warm sea surface temperature is an important precursor factor for high temperature and high humidity in South China. During the 2020 high temperature period in South China, the atmosphere was mainly humid, which is related to the sustained warm sea surface temperature in the Indian Ocean, tropical Atlantic, northwest Pacific, and northeast Pacific from spring to summer. It triggered Rossby wave trains that spread eastward from central and western Eurasia to the East Asian continent, which is conducive to maintaining the strong eastward SAHP, strong eastward ULJS, and NWPHP intensity and westward extension of atmospheric circulation in East Asia during summer. The South China region is controlled by abnormal anticyclonic circulation, triggering sustained high temperature and high humidity heat waves.
-

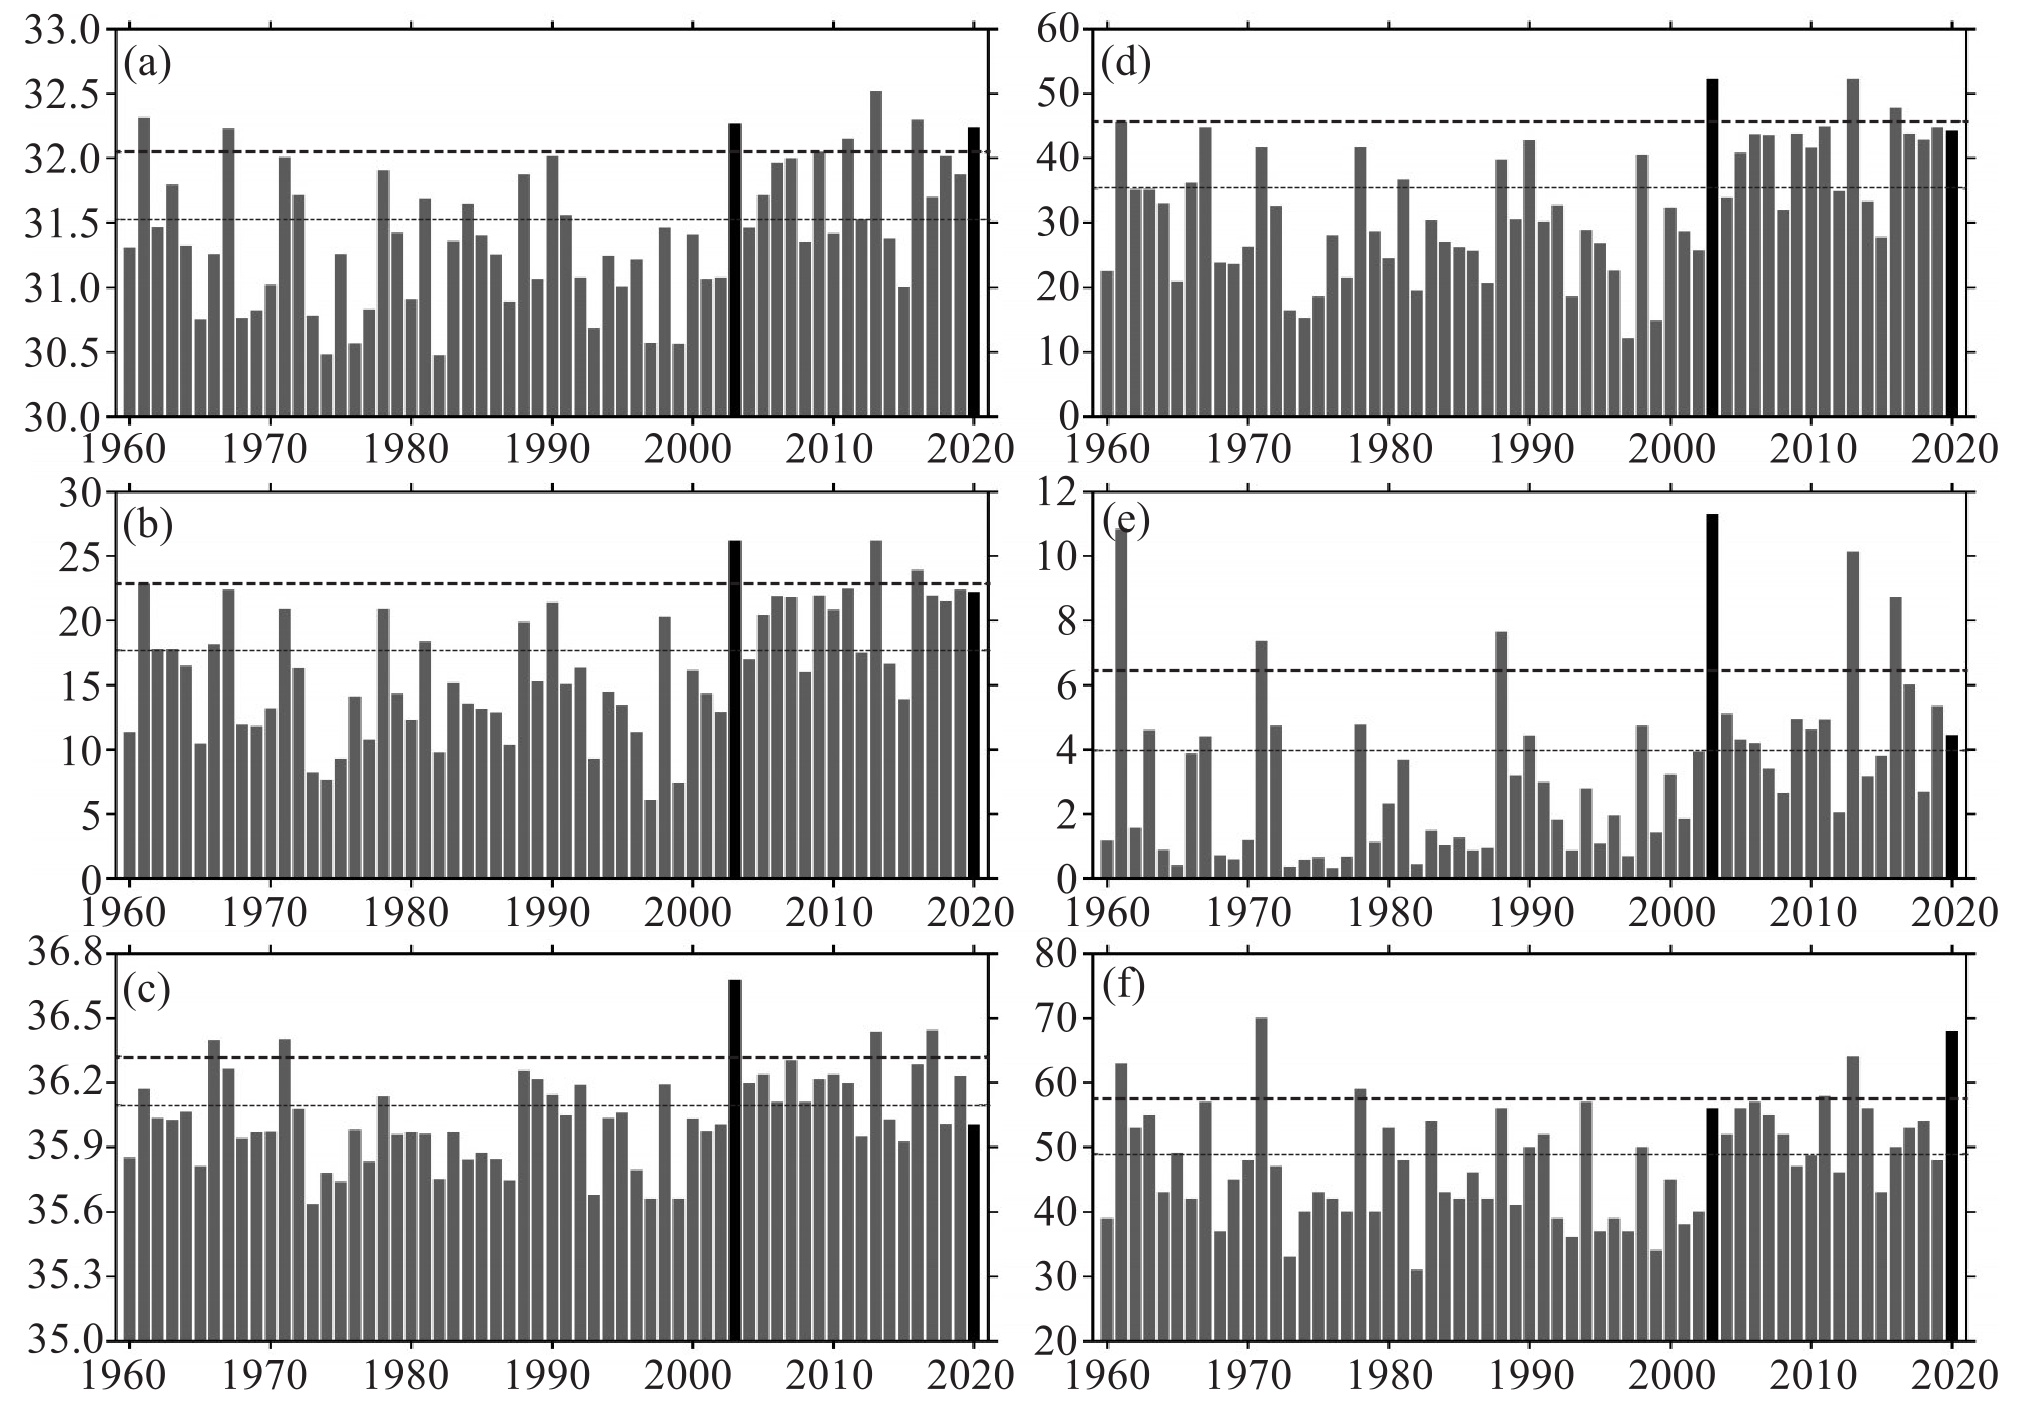
图 1 1960—2020年夏季华南地区平均最高气温(a,单位:℃)、高温日数(b,单位:天)、极端高温(c,单位:℃)、高温日台站数平均值(d,单位:个)、高温突破历史极值的台站数平均值(e,单位:个)和华南台站高温日数最大值(f,单位:个)
细(粗)虚线为气候态(1倍标准差),黑色条柱分别表示2003和2020年。

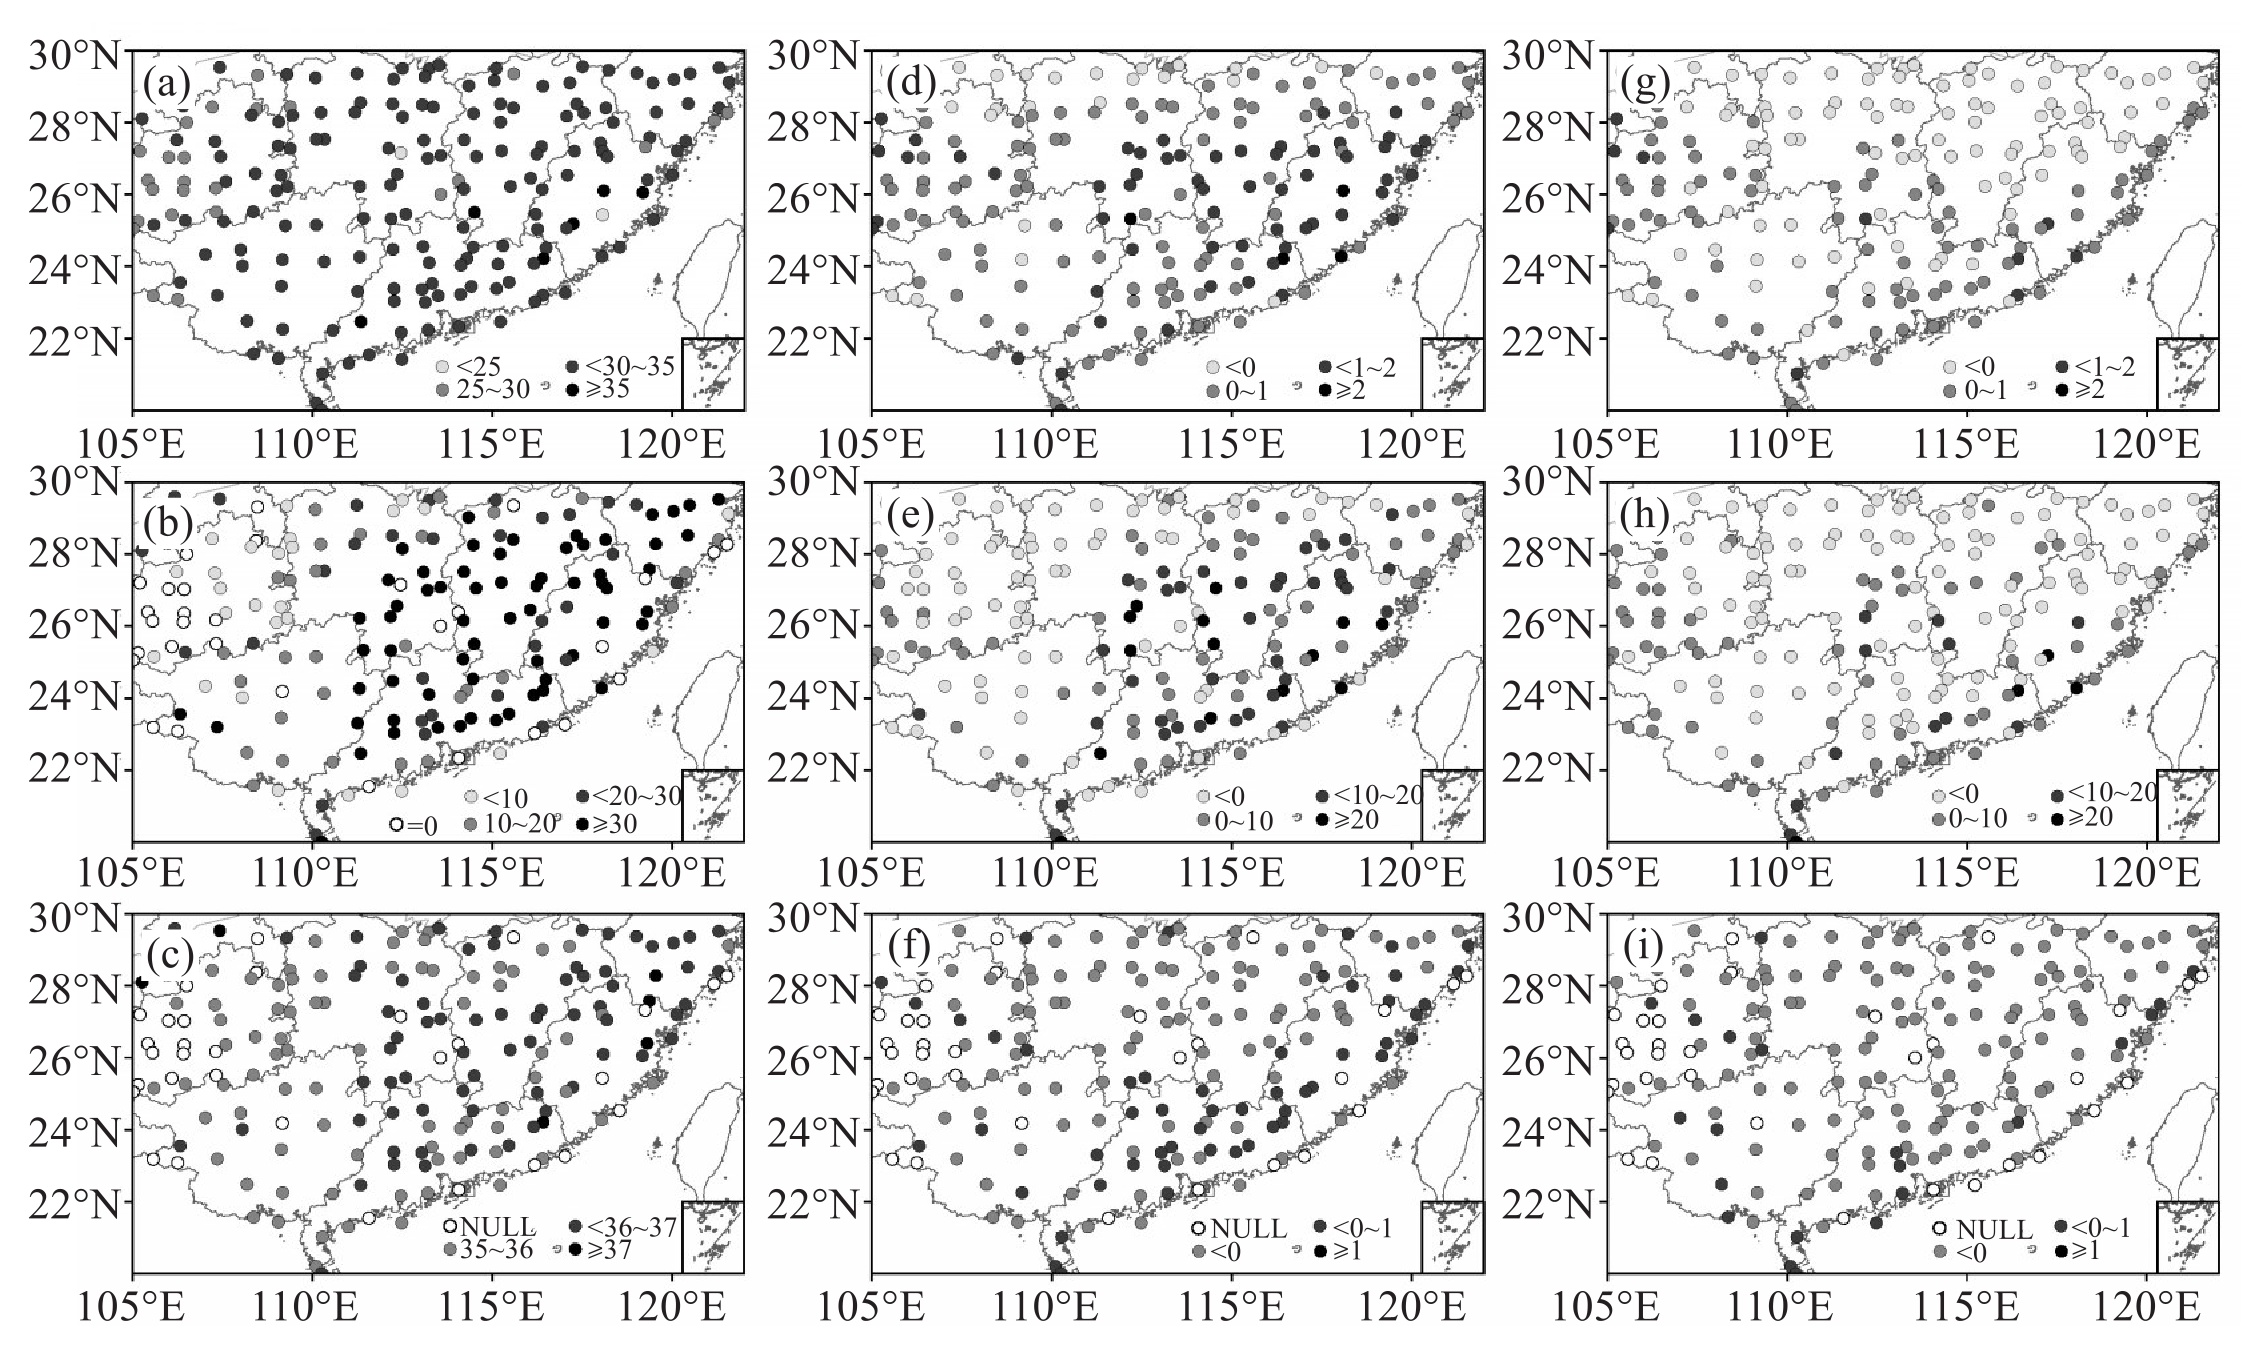
图 2 华南地区2020年(a~c)夏季平均最高气温(a,单位:℃)、高温日数(b,单位:天)和极端高温(c,单位:℃)及其与气候态(d~f)和2003年(g~i)的差值的空间分布

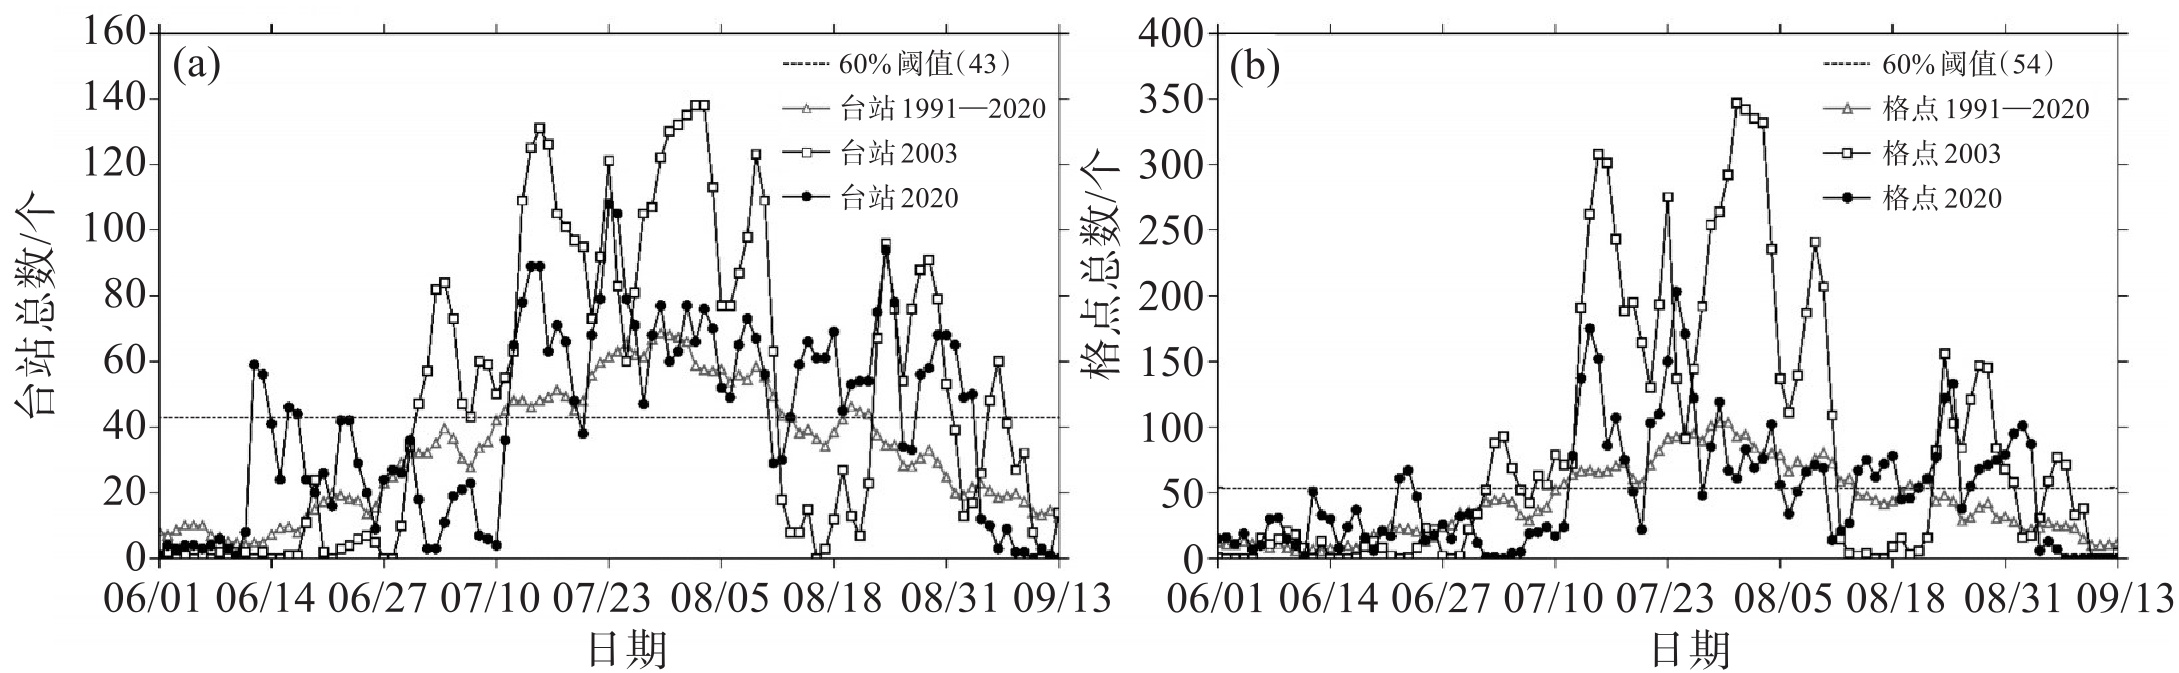
图 3 2020年(●)、气候态(△)和2003年(□)夏季华南地区台站(a)和NCAR/NCEP格点(b)总高温日数的时间序列
黑虚线为第60百分位值所对应的台站数/格点数。

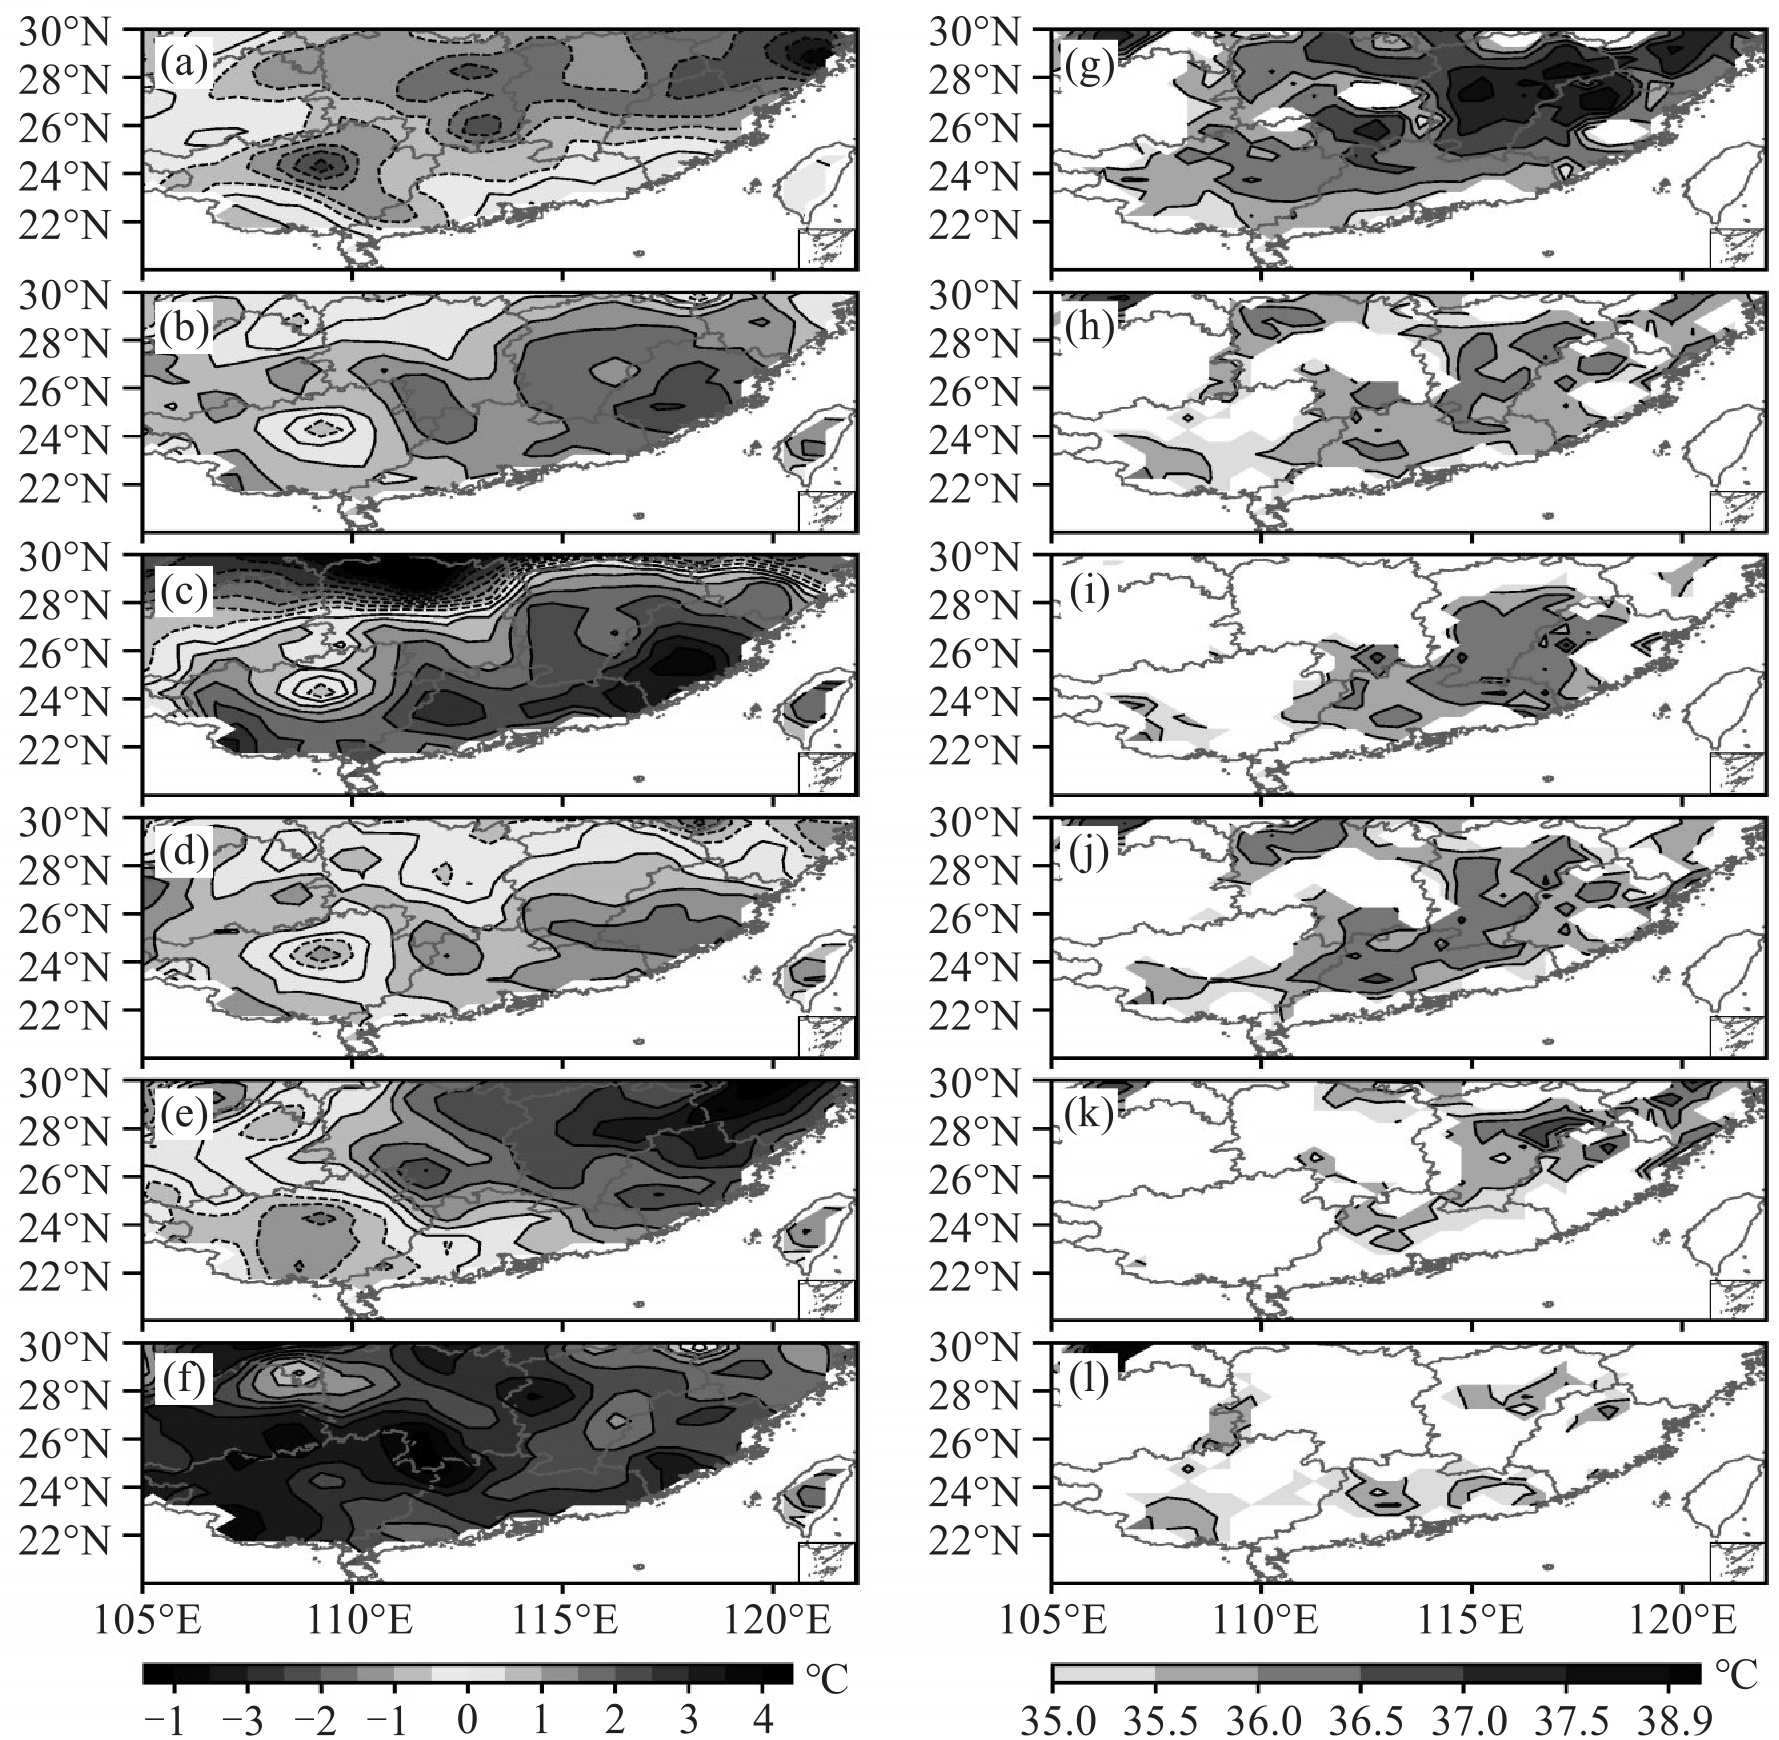
图 4 2020年夏季高温期与2003年夏季高温期(a)、2020年夏季高温期与气候态(1991—2020年)夏季高温期(b)、2020年4次事件与同期气候态(1991—2020年)(c~f)的平均最高气温差值(左);2003年(g)和2020年(h)夏季高温期、2020年4次事件(i~l)的平均极端高温(右)的空间分布

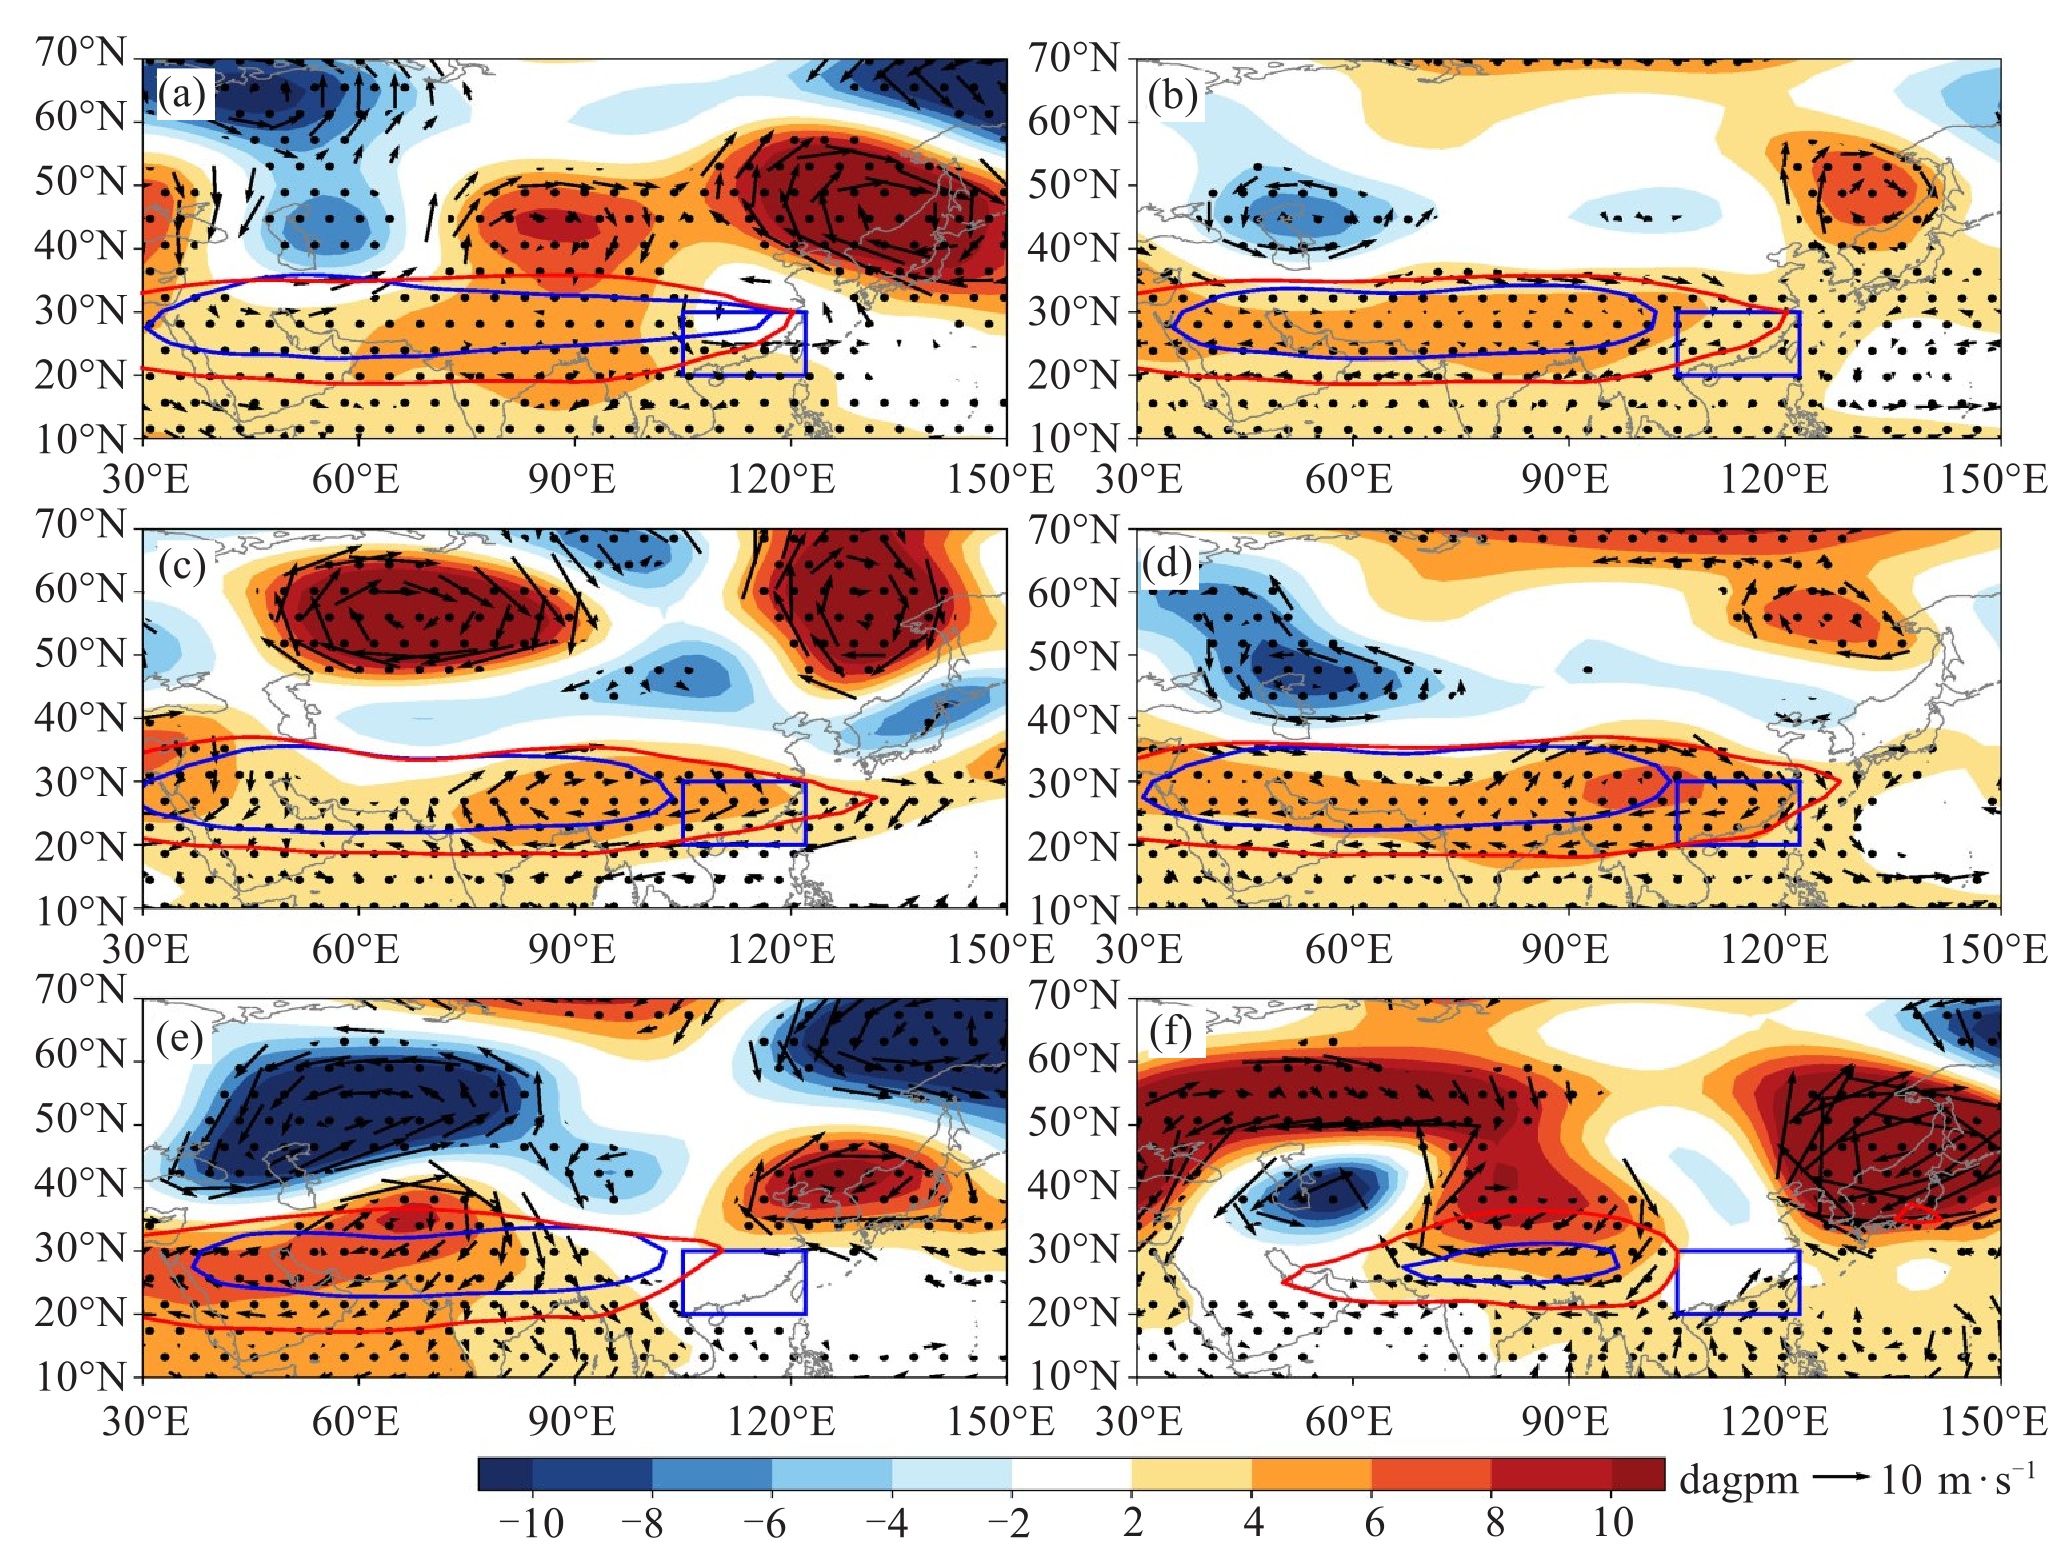
图 5 2020年夏季高温期与2003年夏季高温期(a)、2020年夏季高温期与气候态(1991—2020年)夏季高温期(b)、2020年4次事件与同期气候态(1991—2020年)(c~f)的200 hPa位势高度差值(阴影,单位:dagpm)和水平风场差值(矢量,单位:m·s-1)的空间分布
红(蓝)粗实线表示2020年(2003年(a)和气候态(b~f))等1 255 dagpm线。黑点为通过0.05显著性水平的区域。蓝框表示华南地区。

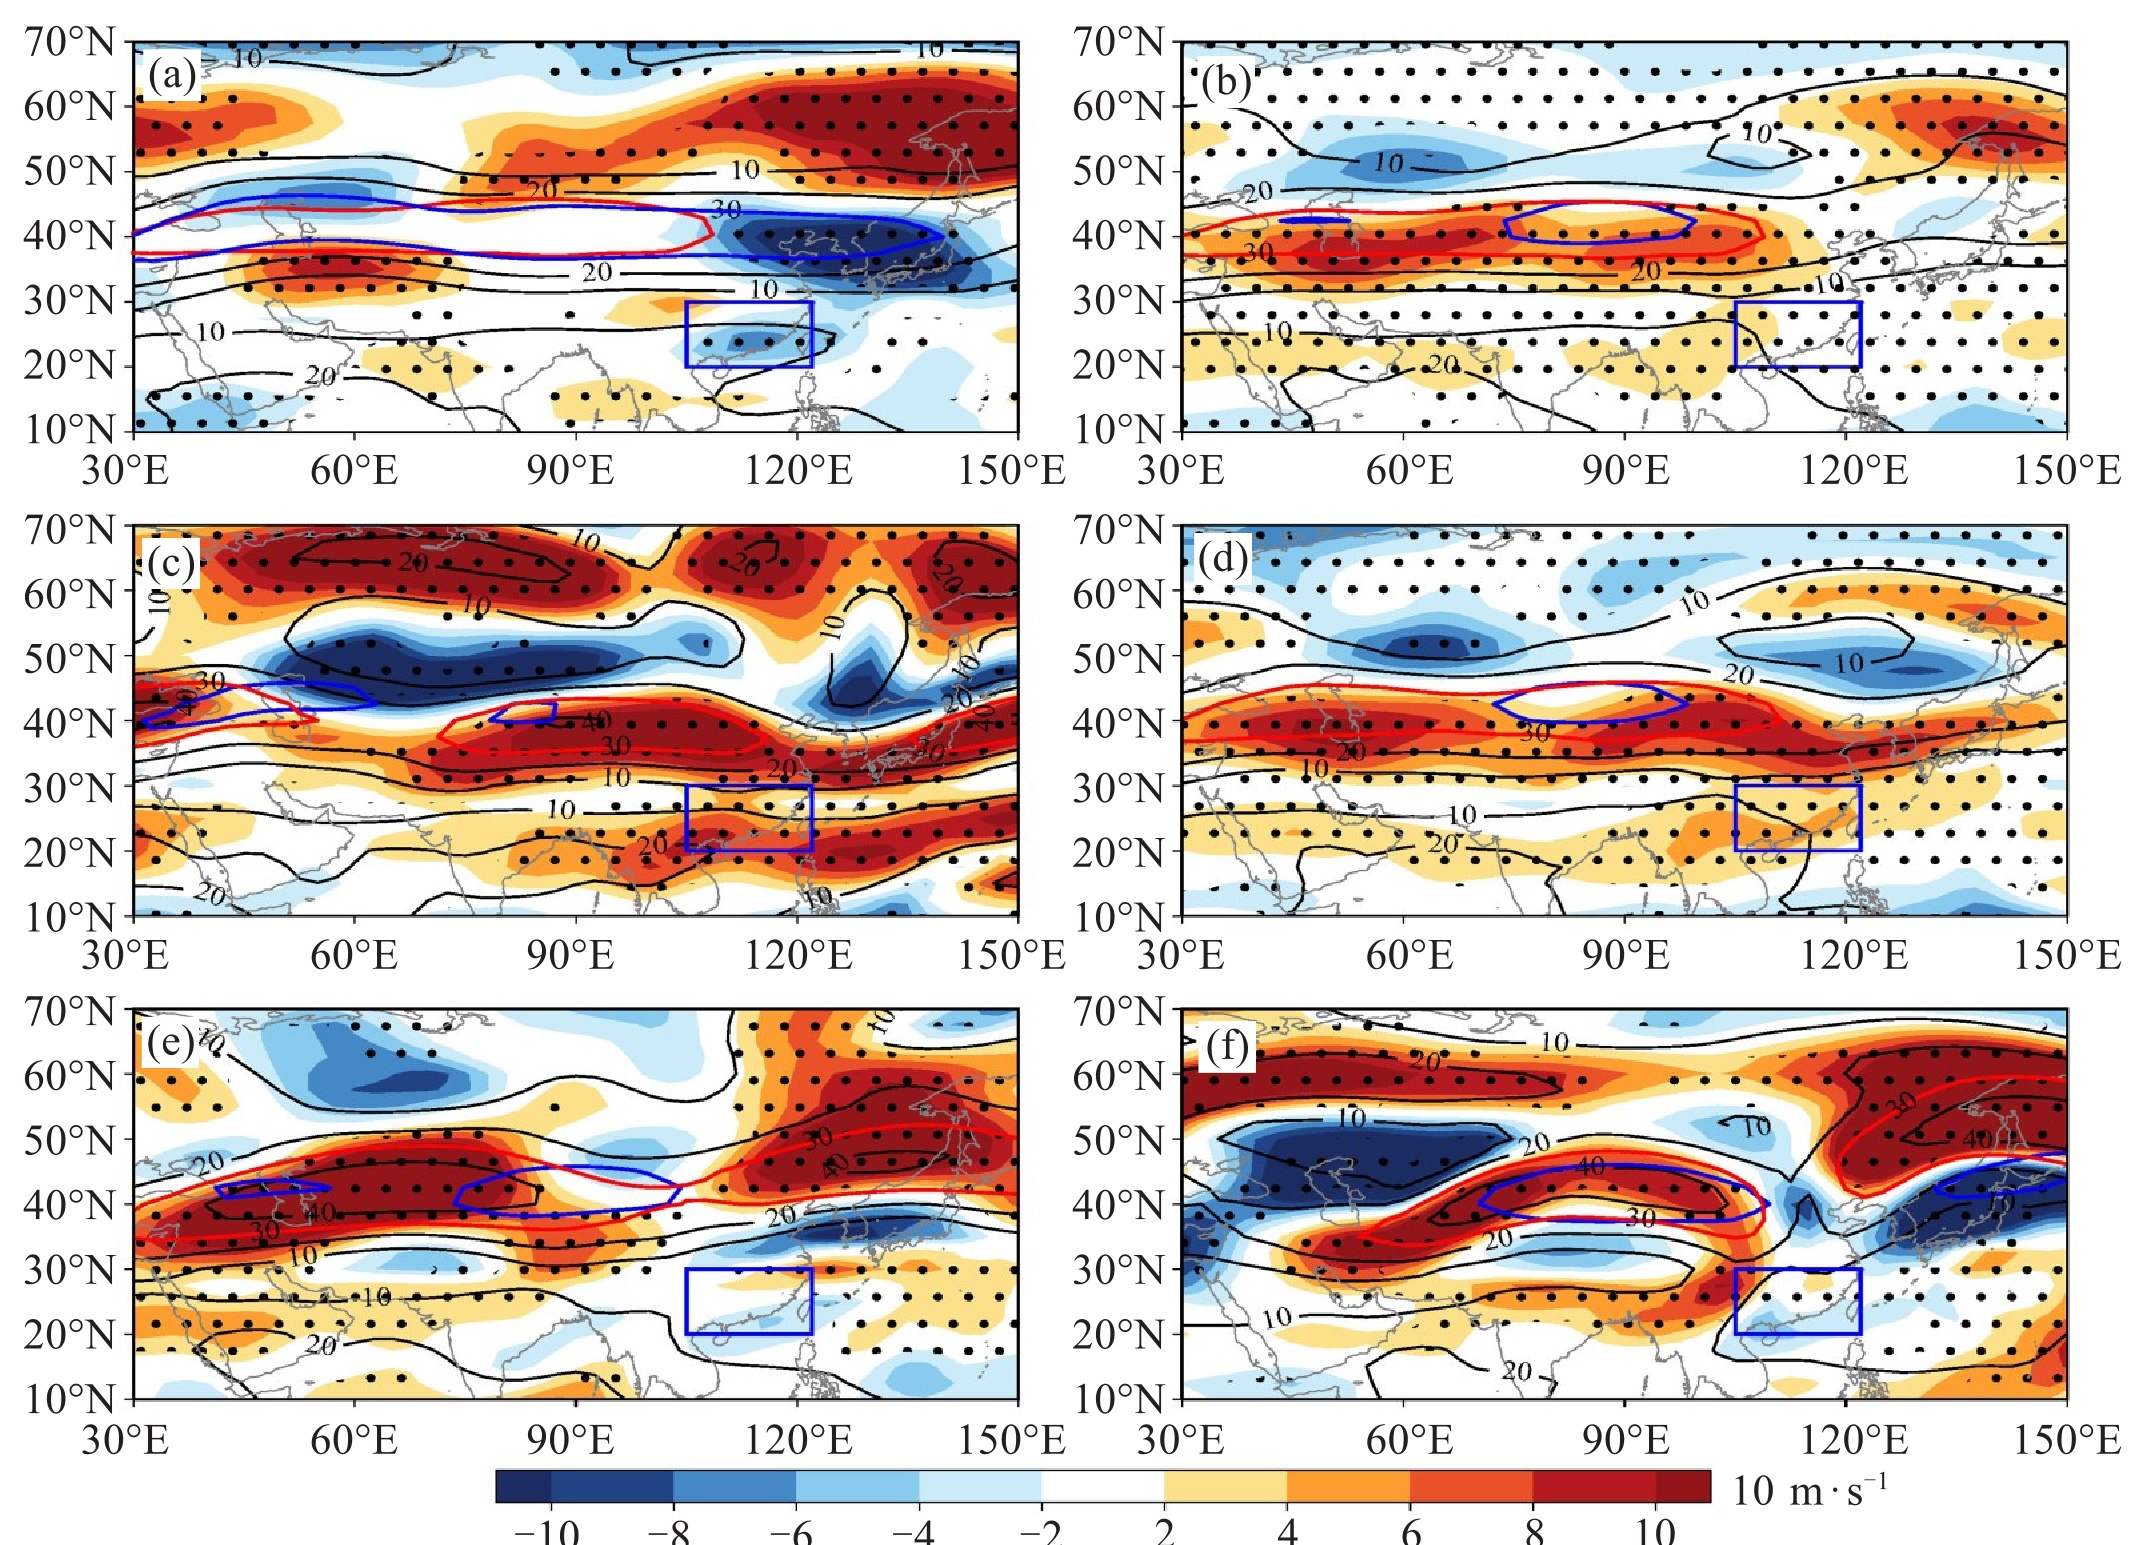
图 6 2020年夏季高温期(a~b)和4次事件(c~f)的200 hPa风场(单位:m·s-1)的空间分布
等值线表示水平风速,阴影表示纬向风差值(相对于2003年(a);相对于1991—2020年气候态(b~f))。红(蓝)粗实线表示2020年(2003年(a)和气候态(b~f))的30 m·s-1等值线。黑点为通过0.05显著性水平的区域。蓝框表示华南地区。

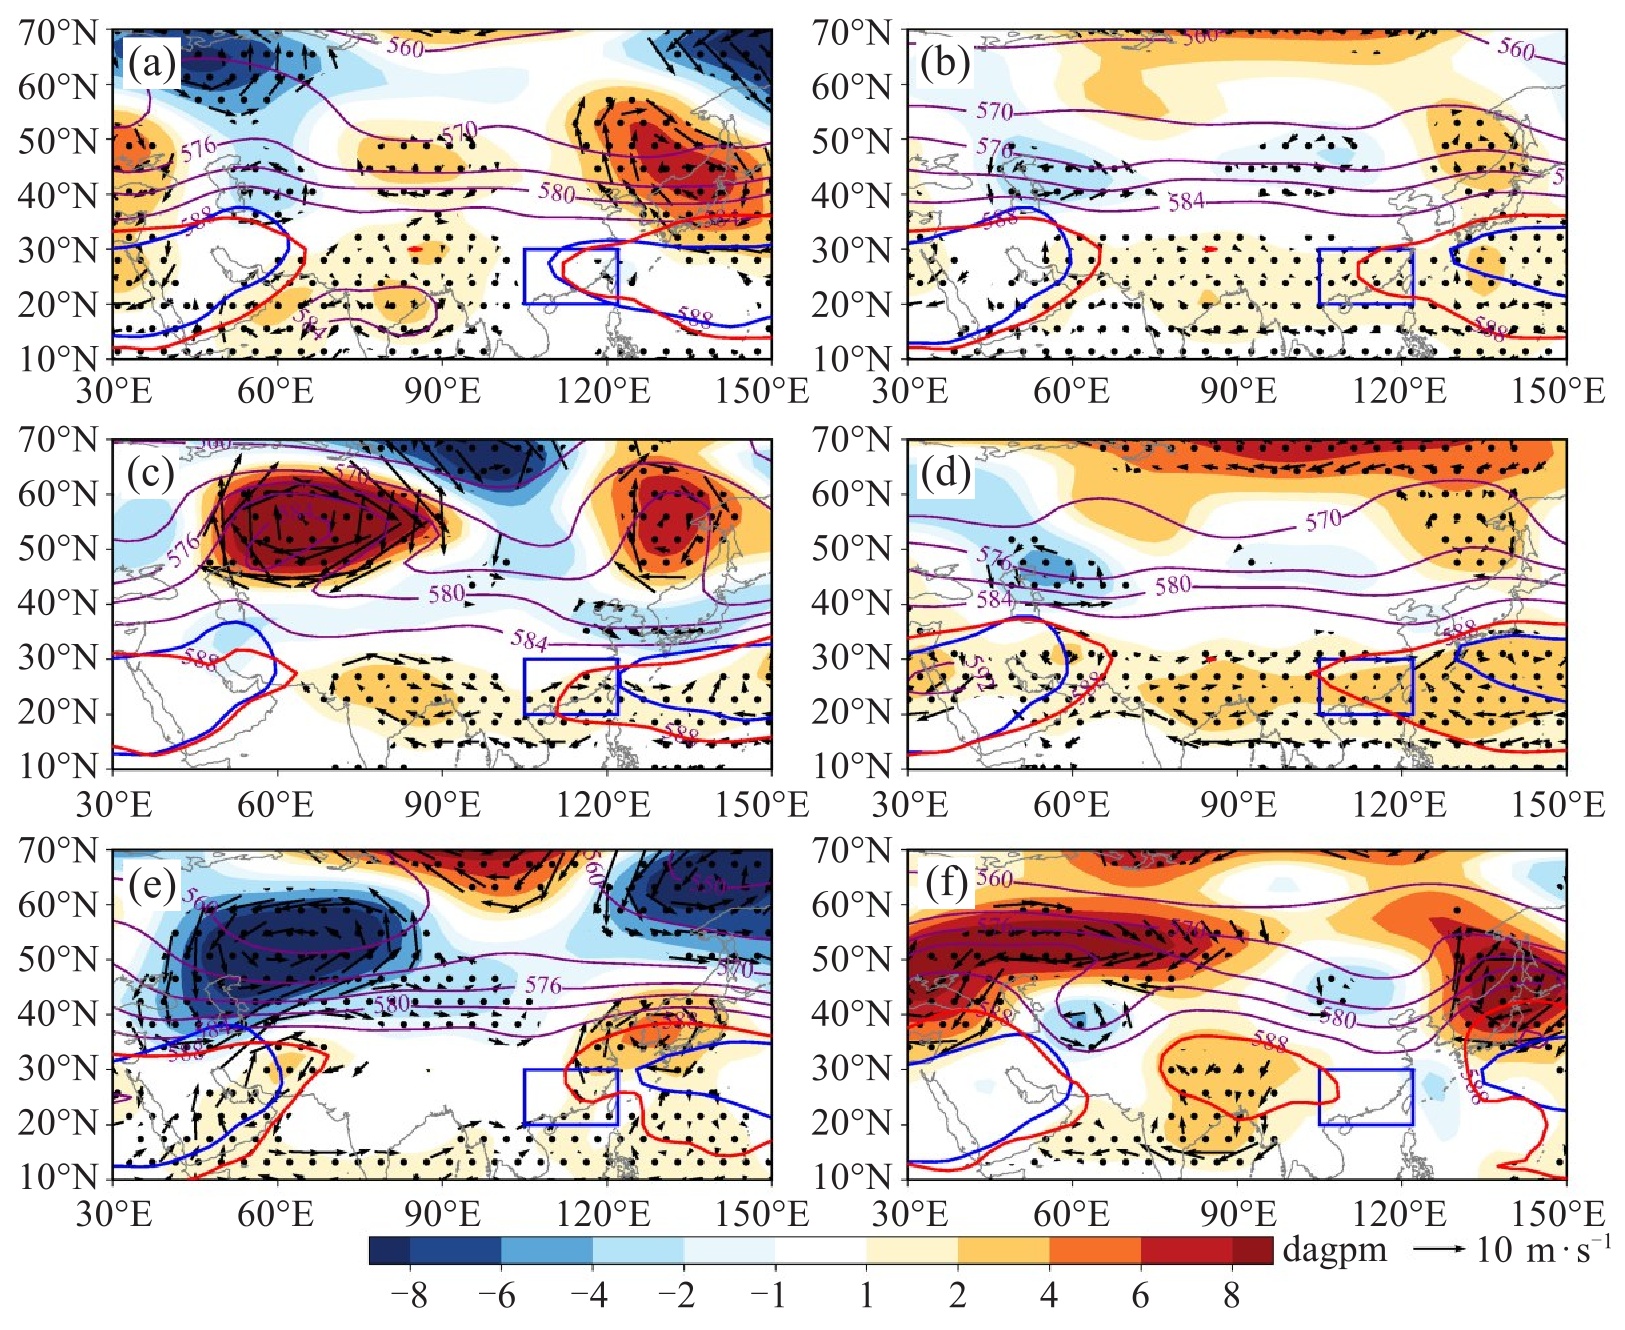
图 7 同图 5,但为500 hPa(dagpm)
红(蓝)粗实线表示2020年(2003年(a)和气候态(b~f))的588 dagpm等值线。紫粗实线为500 hPa位势高度。蓝框表示华南地区。

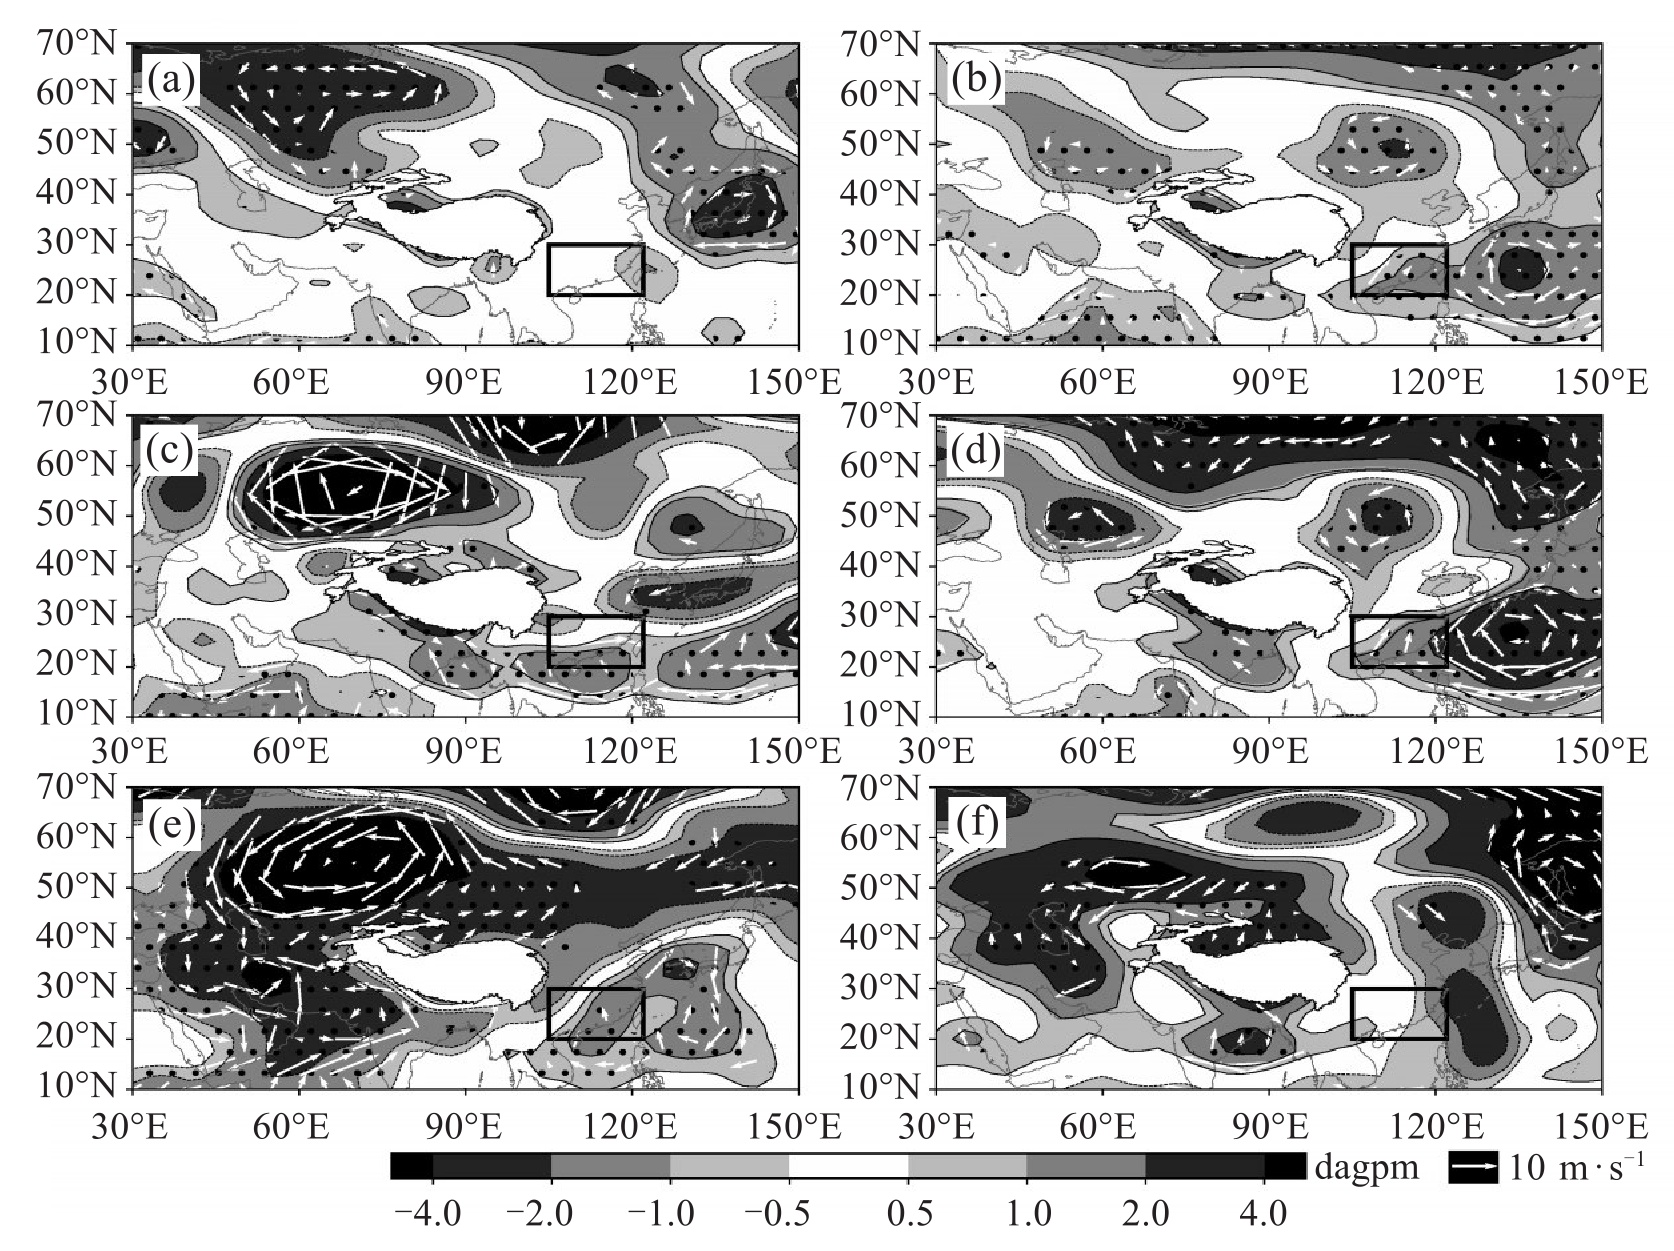
图 8 2020年夏季高温期与2003年夏季高温期(a)、2020年夏季高温期与气候态(1991—2020年)夏季高温期(b)、2020年4次事件与同期气候态(1991—2020年)(c~f)的850 hPa位势高度差值(阴影,单位: dagpm)和水平风场差值(矢量,单位: m·s-1)的空间分布
黑点为通过0.05显著性水平的区域。粗框表示华南地区。

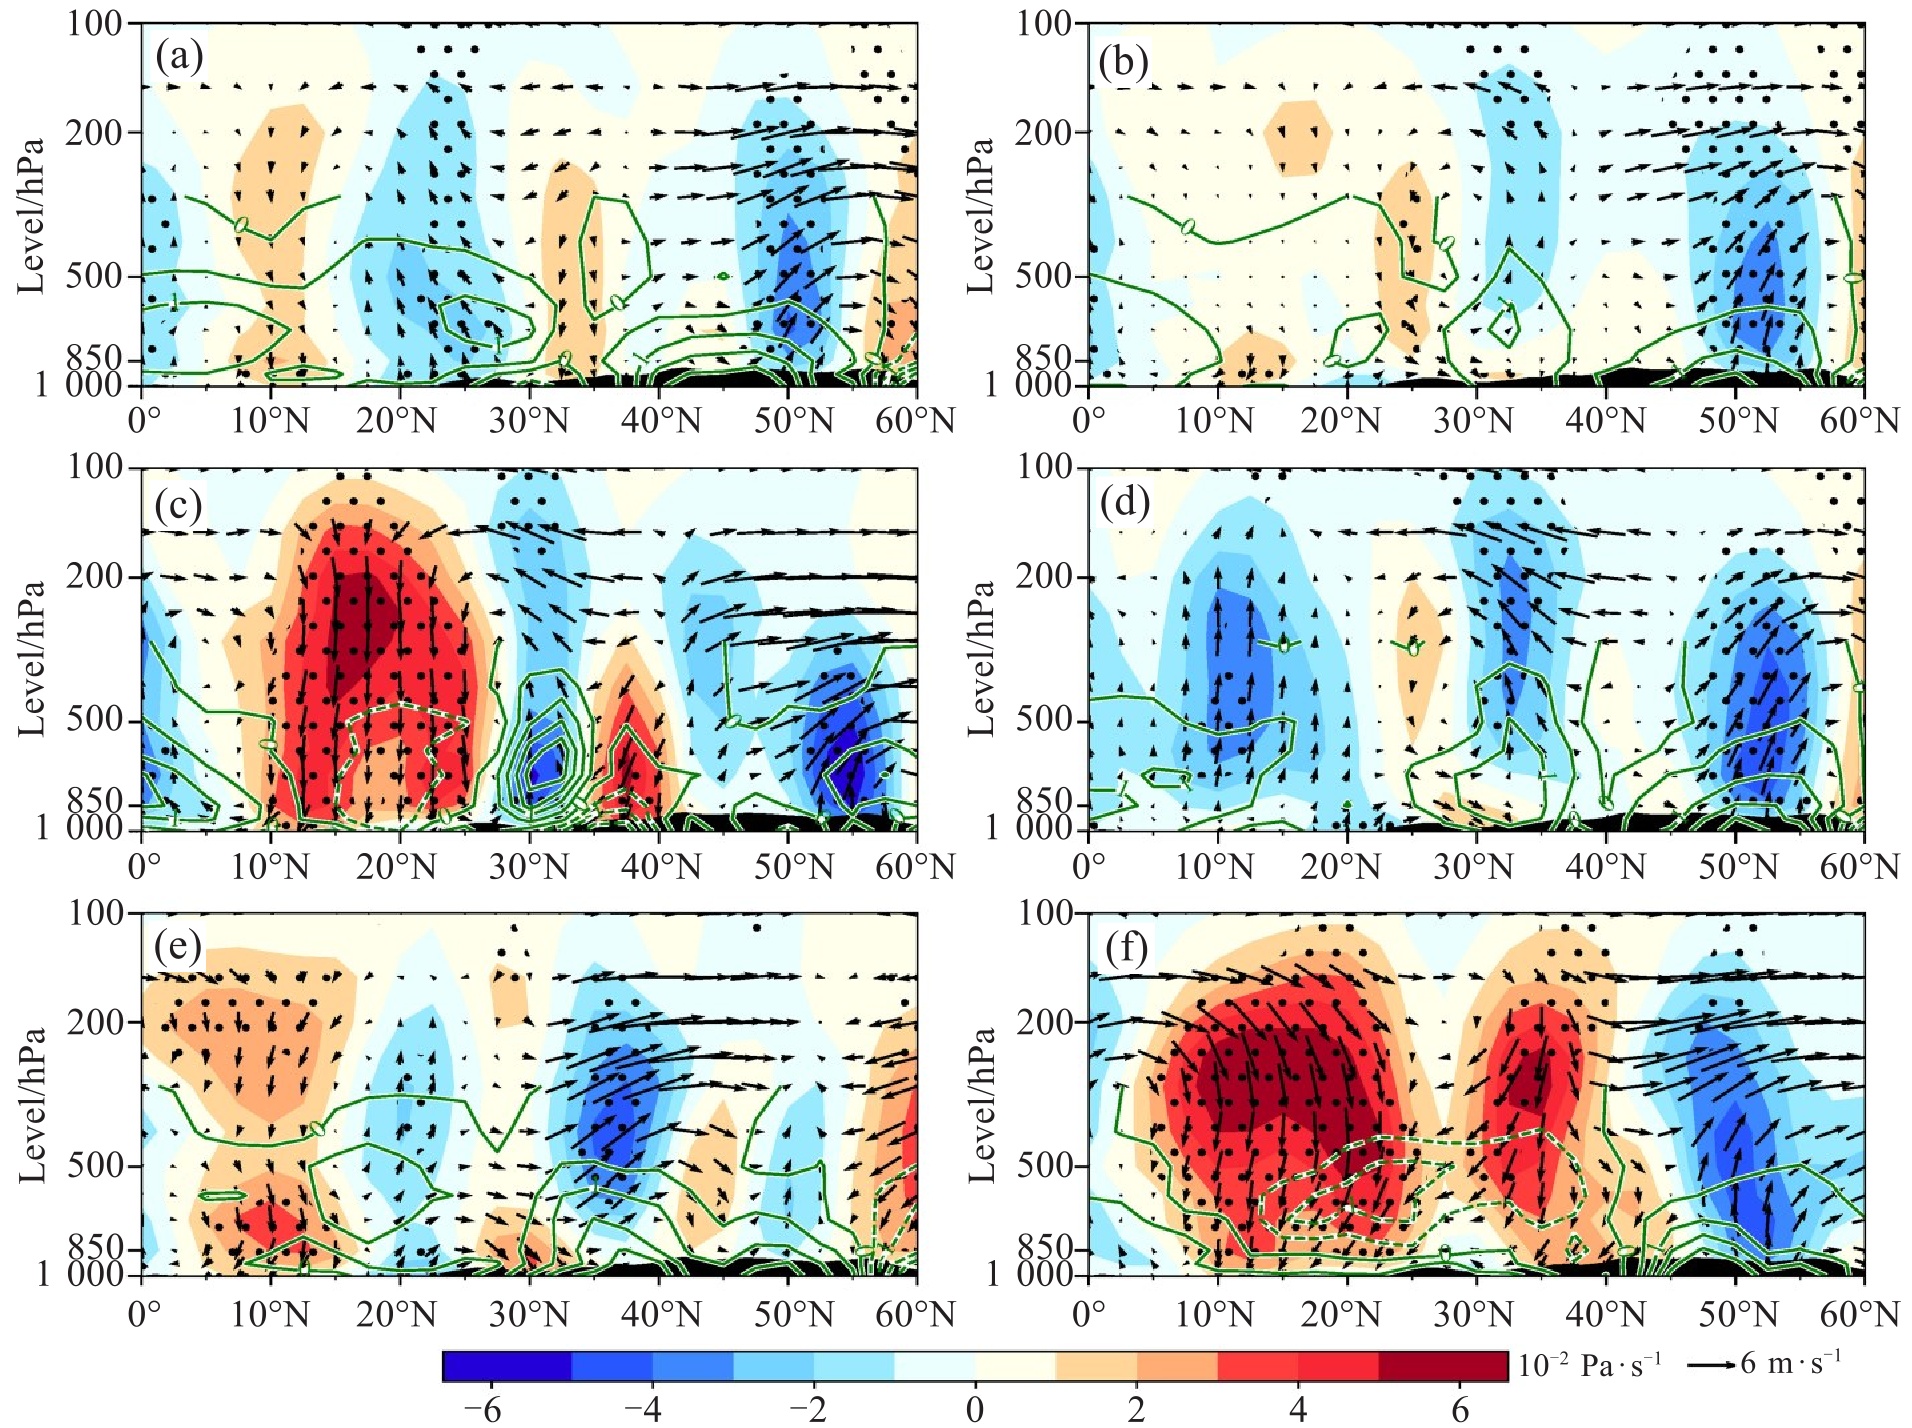
图 9 2020年夏季高温期与2003年夏季高温期(a)、2020年夏季高温期与气候态(1991—2020年)夏季高温期(b)、2020年4次事件与同期气候态(1991—2020年)(c~f)的105~122°E平均垂直速度差值(阴影,单位: 10-2 Pa·s-1)经向环流差值(矢量,单位: m·s-1)和比湿差值(绿色等值线,单位: g·kg-1)的纬度-气压剖面图
绿色实(虚)线等值线为差值大于等于(小于)零。黑点表示通过0.05显著性水平的区域。

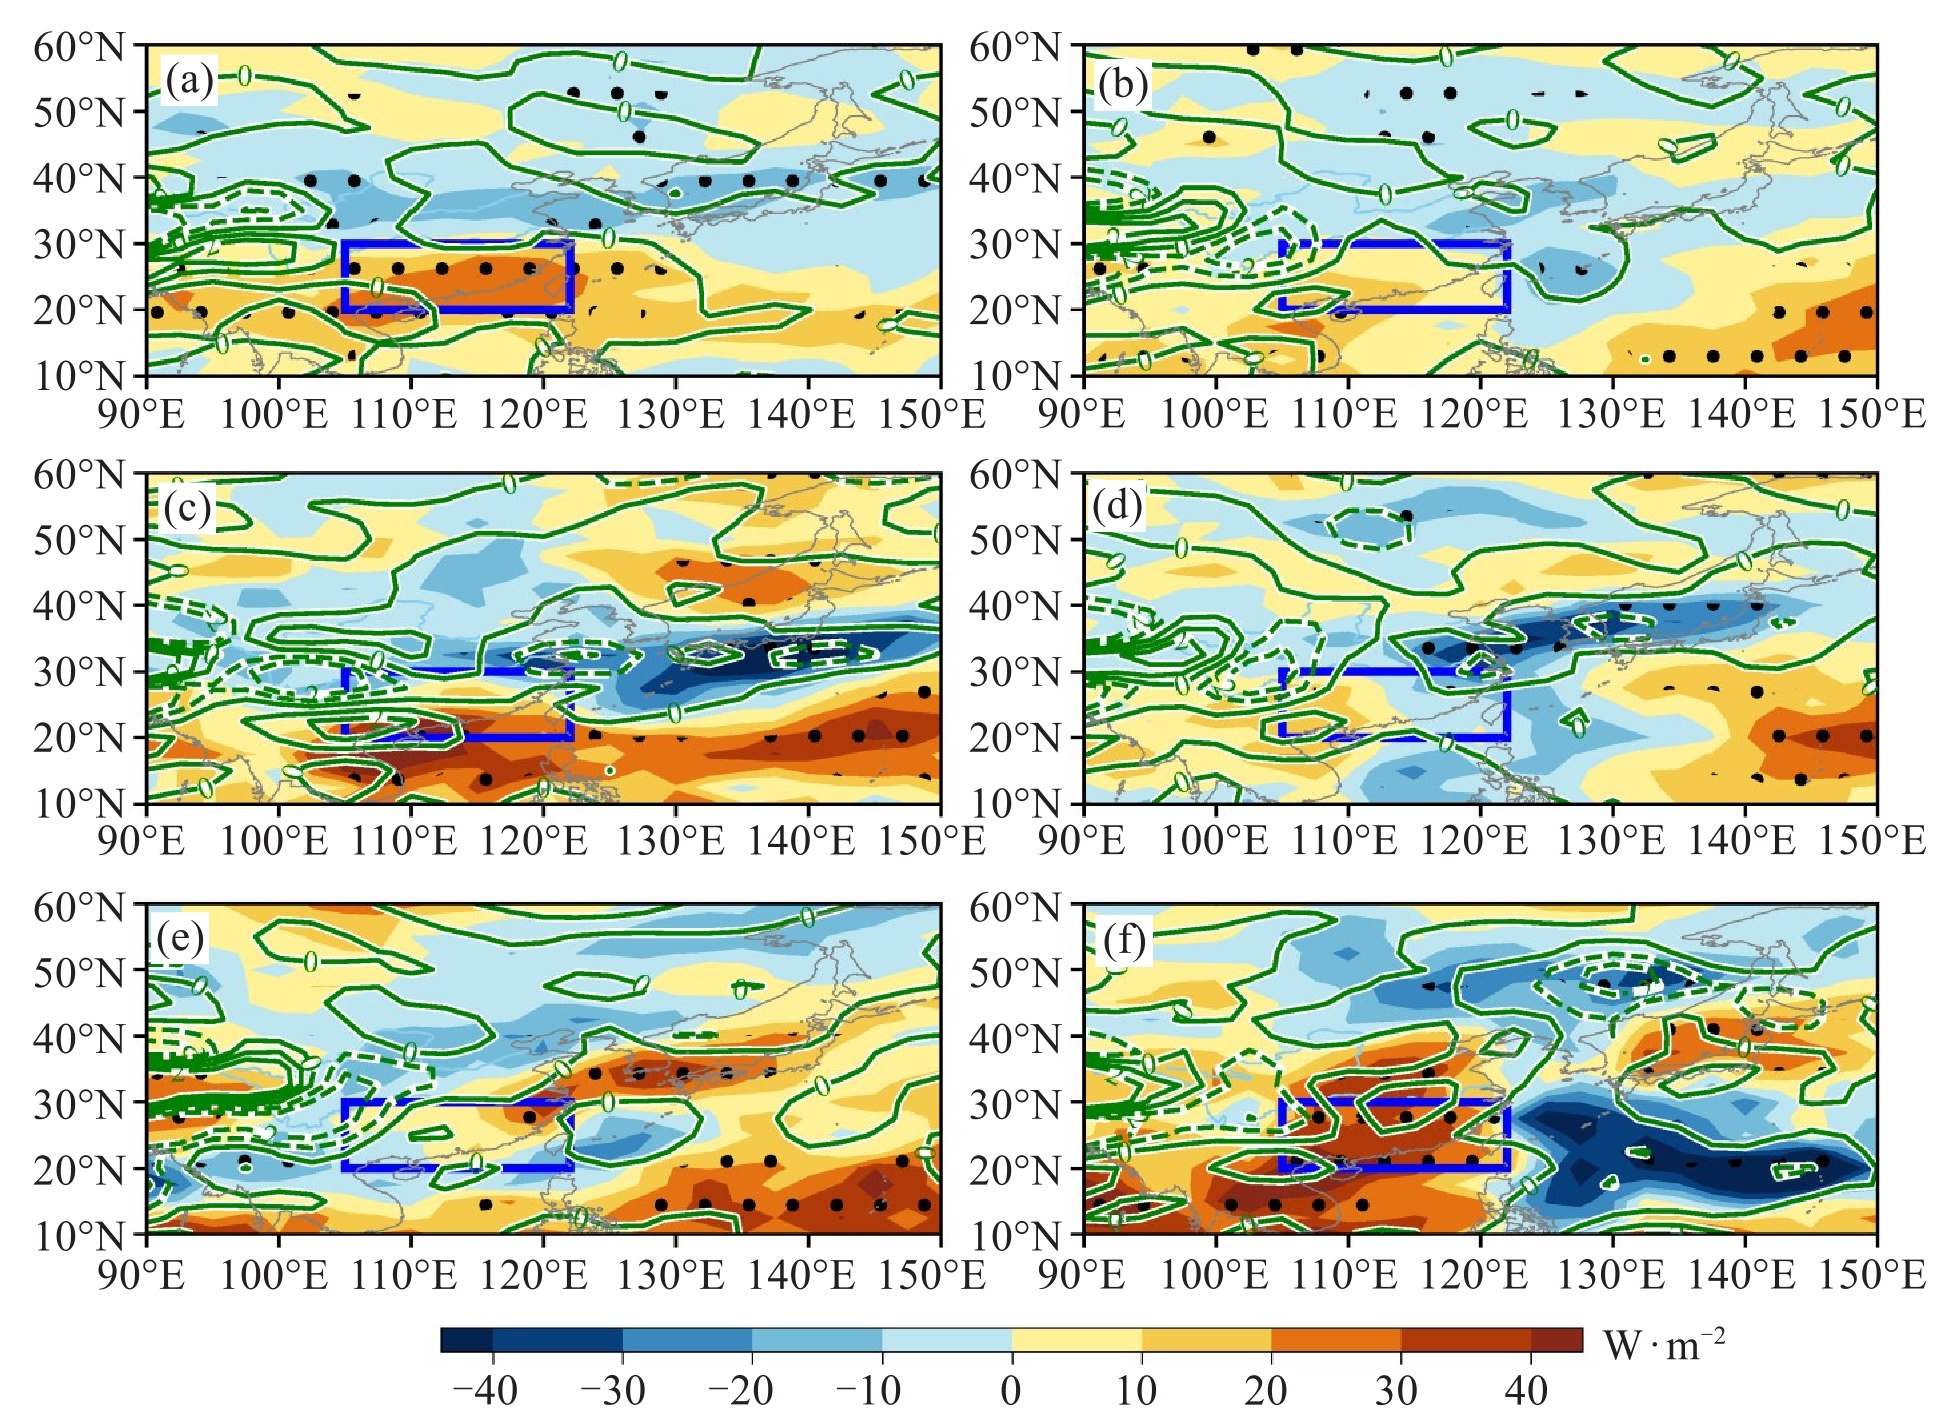
图 10 2020年夏季高温期与2003年夏季高温期(a)、2020年夏季高温期与气候态(1991—2020年)夏季高温期(b)、2020年4次事件与同期气候态(1991—2020年)(c~f)的OLR差值(阴影,单位: W·m-2)和整层水汽输送散度差值(绿色等值线,单位: 106 kg·m-2·s-1)的空间分布
绿色实(虚)线等值线为差值大于等于(小于)零。黑点表示通过0.05显著性水平的区域。蓝框表示华南地区。

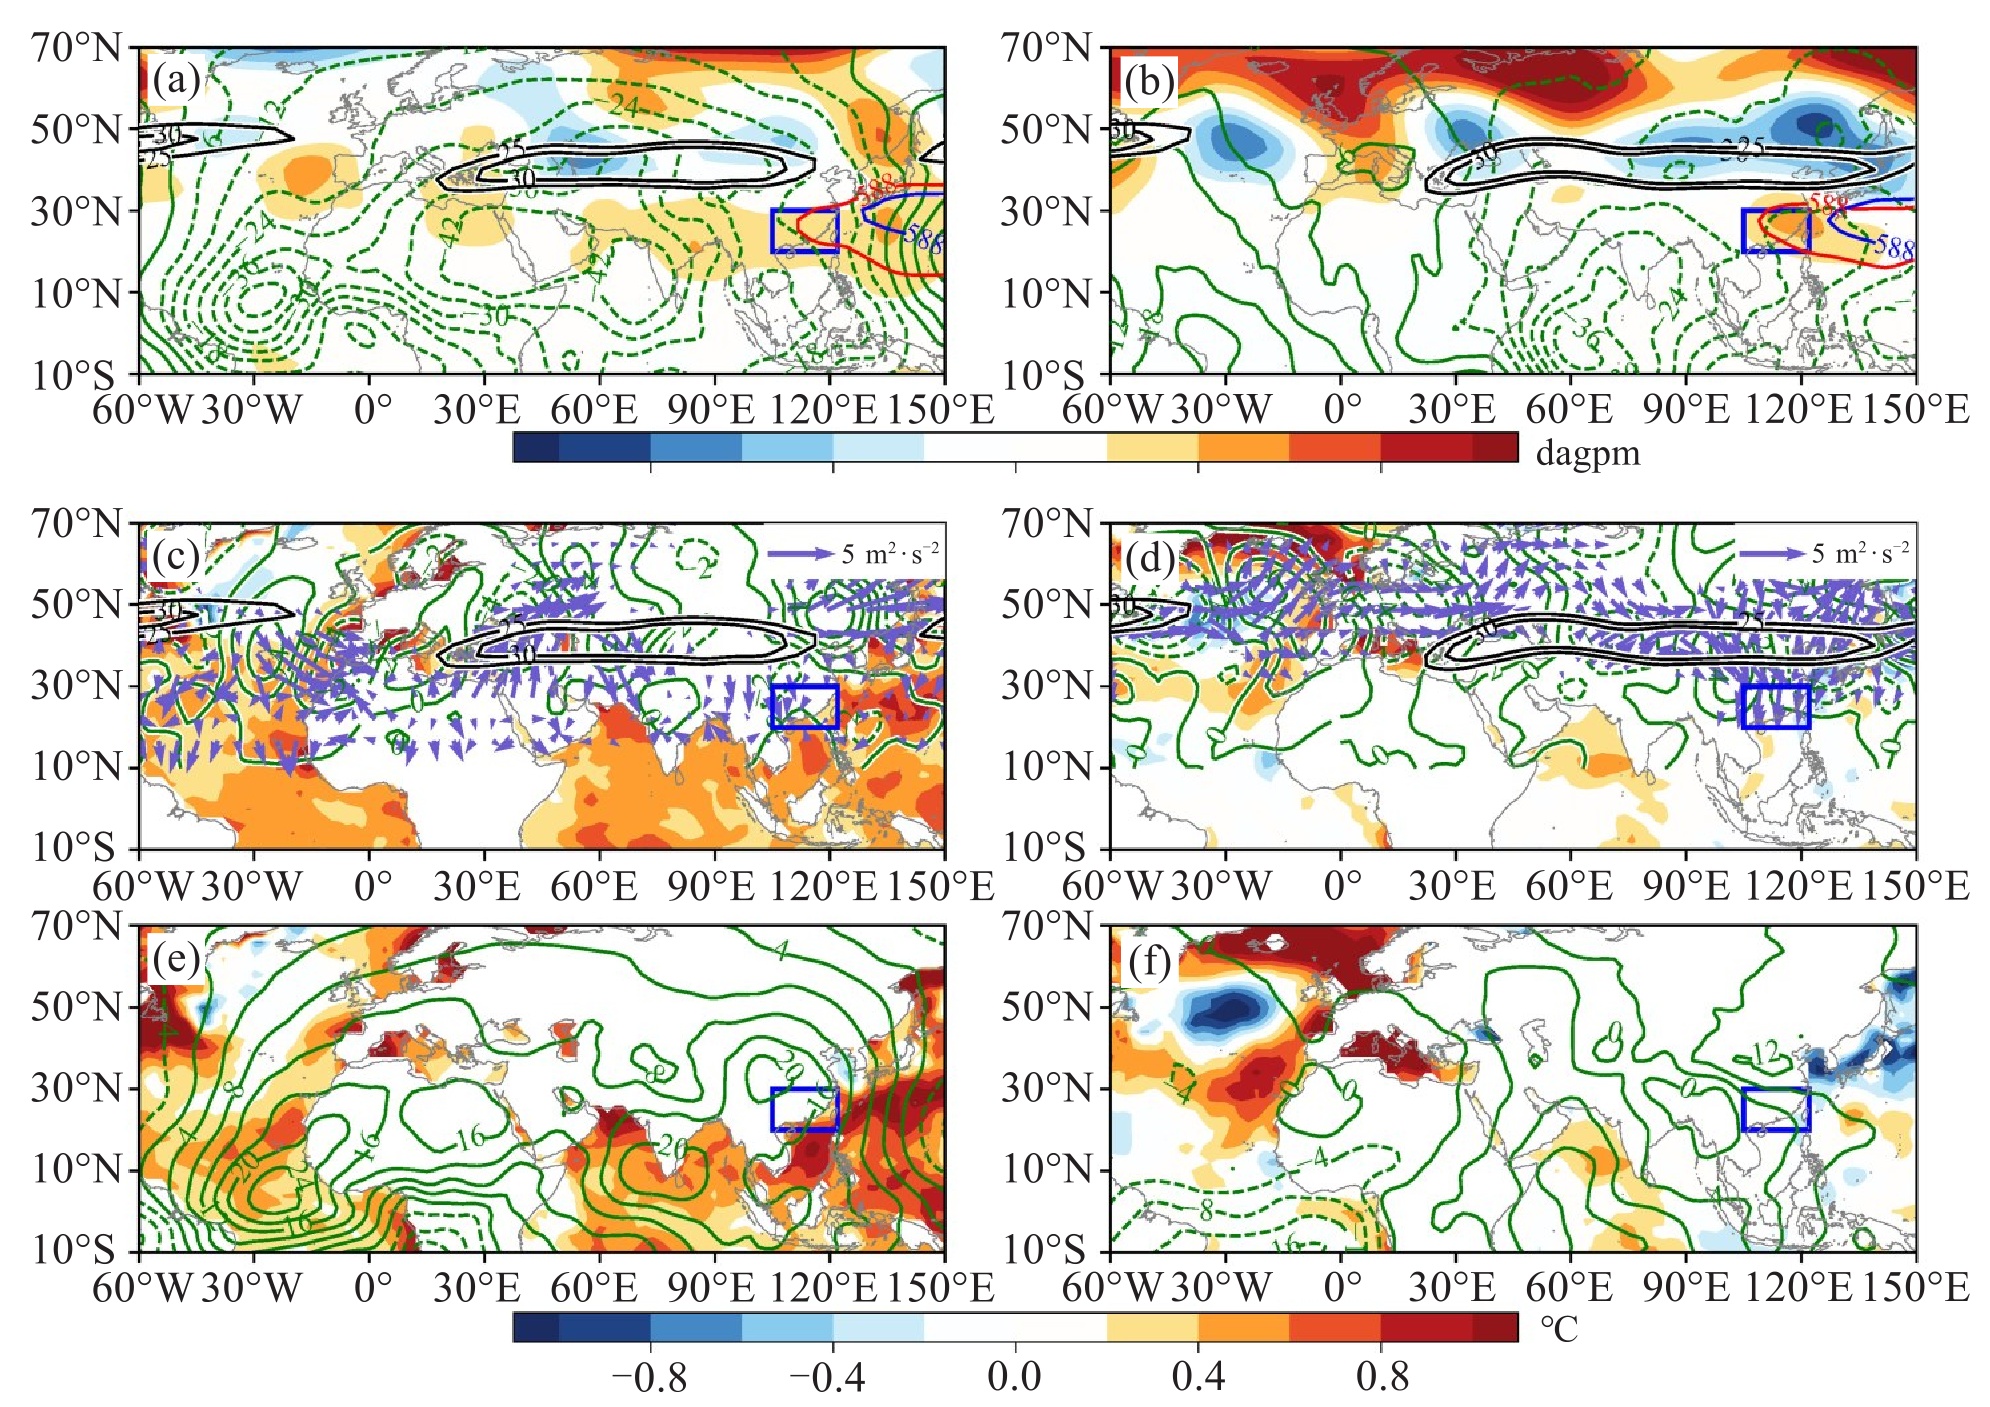
图 11 相对于气候态(1991—2020年),2020年夏季高温期500 hPa位势高度差值(阴影,单位: dagpm)和200 hPa势函数差值(绿色等值线,单位: 105 m2·s-2)(a),春—夏季海温差值(阴影,单位: ℃)、200 hPa经向风差值(绿色等值线,单位: m·s-1)和波活动通量(紫色矢量,单位: m2·s-2)(c),夏季海温差值(阴影,单位: ℃)和850 hPa势函数差值(绿色等值线,单位: 105 m2·s-1)(e) 的空间分布;2003年(右)同2020年(左)
实(虚)线绿色等值线表示差值大于等于(小于)零。红(蓝)色粗实线为2020年(a)和2003年(b)(气候态)副高588 dagpm等值线。黑粗实线为200 hPa风速25和30 m·s-1等值线。蓝框表示华南地区。
表 1 高温热浪指数
指数 含义 高温日数 单站研究时段期达到高温标准的总日数 高温台站数 研究区域某天达到高温标准的台站数 平均极端高温 研究时段期日最高气温高于35℃的平均值 区域平均极端高温 夏季某天日最高气温高于35℃的区域平均值 台站高温日数最大值 夏季研究区域台站高温日数的最大值 高温突破历史极值的台站数 夏季区域内日最高气温突破历史95%阈值的台站数  下载: 导出CSV
表 2 2020年、气候态和2003年夏季华南地区台站持续性高温日的起讫和持续时间
序号 2020年 气候态 2003年 开始日期(月.日) 结束日期(月.日) 持续时间(天) 开始日期(月.日) 结束日期(月.日) 持续时间(天) 开始日期(月.日) 结束日期(月.日) 持续时间(天) 1 6.12 6.13 2 7.11 8.13 34 7.1 8.11 42 2 6.16 6.17 2 8.20 8.22 3 8.23 8.31 9 3 7.12 7.19 8 4 7.21 8.10 21 5 8.13 8.25 13 6 8.28 9.3 7 合计 53 37 51
下载: 导出CSV
-
[1] Intergovernmental Panel on Climate Change. Change 2013-the physical science basis: Working group I contribution to the fifth assessment report of the intergovernmental panel on climate change[M]. Cambridge: Cambridge University Press, 2014. [2] 梁潇云, 郭艳君. 2007年全球重大天气气候事件概述[J]. 气象, 2008, 34(4): 113-117. [3] 孙劭, 李多, 刘绿柳, 等. 2016年全球重大天气气候事件及其成因[J]. 气象, 2017, 43(4): 477-485. [4] 孙劭, 李多, 王遵娅, 等. 2018年全球重大天气气候事件及其成因[J]. 气象, 2019, 45(4): 533-542. [5] 王亚伟, 翟盘茂, 田华. 近40年南方高温变化特征与2003年的高温事件[J]. 气象, 2006, 32(10): 27-33. [6] 叶殿秀, 尹继福, 陈正洪, 等. 1961—2010年我国夏季高温热浪的时空变化特征[J]. 气候变化研究进展, 2013, 9(1): 15-20. [7] 贾佳, 胡泽勇. 中国不同等级高温热浪的时空分布特征及趋势[J]. 地球科学进展, 2017, 32(5): 546-559. [8] 沈皓俊, 游庆龙, 王朋岭, 等. 1961—2014年中国高温热浪变化特征分析[J]. 气象科学, 2018, 38(1): 28-36. [9] 方宇凌, 简茂球. 2003年夏季华南持续高温天气过程及热力诊断[J]. 热带海洋学报, 2011, 30(3): 30-37. [10] 杜尧东, 段海来, 刘畅, 等. 气候变化对大湾区人群健康影响研究进展[J]. 气象科技进展, 2019, 9(3): 185-189, 194. [11] 袁媛, 丁婷, 高辉, 等. 我国南方盛夏气温主模态特征及其与海温异常的联系[J]. 大气科学, 2018, 42(6): 1245-1262. [12] 贾子康, 郑志海, 封国林. 中国南方地区盛夏高温类型及其对应的大尺度环流和海温异常[J]. 气象学报, 2020, 78(6): 928-944. [13] 马双梅, 祝从文, 刘伯奇. 2019年4~6月云南持续性高温天气的大气环流异常成因[J]. 大气科学, 2021, 45(1): 165-180. [14] 杨义文, 许力, 龚振淞. 2003年北半球大气环流及中国气候异常特征[J]. 气象, 2004, 30(4): 20-25. [15] 彭京备, 刘舸, 孙淑清. 2013年我国南方持续性高温天气及副热带高压异常维持的成因分析[J]. 大气科学, 2016, 40(5): 897-906. [16] 张芳华, 陶亦为, 高辉, 等. 2018年春末南方极端持续高温及MJO影响[J]. 大气科学学报, 2019, 42(1): 100-108. [17] Beniston M. The 2003 heat wave in Europe: a shape of things to come [J]. Geophysical Research Letters, 2004, 31: 2022-2026. [18] Beniston M, Diaz H F. The 2003 heat wave as an example of summers in a greenhouse climate? Observations and climate model simulations for Basel, Switzerland[J]. Global and Planetary Change, 2004, 44(1-4): 73-81. [19] 罗连升, 段春锋, 毕云, 等. 春季青藏高原大气热源与长江中下游盛夏高温的关系[J]. 气象科学, 2016, 36(5): 614-621. [20] Kalnay E, Kanamitsu M, Kistler R, et al. The NCEP/NCAR 40-year reanalysis project[J]. Bulletin of the American Meteorological Society, 1996, 77(3): 437-471. [21] Li Z, Cao L J, Zhu Y N, et al. Comparison of two homogenized datasets of daily maximum/mean/minimum temperature in China during 1960-2013[J]. Journal of Meteorological Research, 2016, 30(1): 53-66. [22] Takaya K, Nakamura H. A formulation of a phase-independent wave-activity flux for stationary and migratory quasigeostrophic eddies on a zonally varying basic flow[J]. Journal of the Atmospheric Sciences, 2001, 58(6): 608-627. [23] 魏凤英. 现代气候统计诊断与预测技术[M]. 2版. 北京: 气象出版社, 2007. [24] 陶诗言, 朱福康. 夏季亚洲南部100毫巴流型的变化及其与西太平洋副热带高压进退的关系[J]. 气象学报, 1964, 22(4): 385-396. [25] 谭晶, 杨辉, 孙淑清, 等. 夏季南亚高压东西振荡特征研究[J]. 南京气象学院学报, 2005, 28(4): 452-460. [26] Dai A G, Trenberth K E, Karl T R. Effects of clouds, soil moisture, precipitation, and water vapor on diurnal temperature range[J]. Journal of Climate, 1999, 12(8): 2451-2473. [27] Black E, Blackburn M, Harrison G, et al. Factors contributing to the summer 2003 European heatwave[J]. Weather, 2004, 59(8): 217-223. [28] 马浩, 刘昌杰, 钱奇峰, 等. 2017年盛夏7—8月浙江省高温热浪特征及环流背景分析[J]. 自然灾害学报, 2021, 30(5): 85-99. [29] Gill A E. Some simple solutions for heat-induced tropical circulation[J]. Quarterly Journal of the Royal Meteorological Society, 1980, 106 (449): 447-462. [30] Chang C P, Zhang Y S, Li T. Interannual and interdecadal variations of the East Asian summer monsoon and tropical Pacific SSTs. part Ⅰ: roles of the subtropical ridge[J]. Journal of Climate, 2000, 13(24): 4310-4325. [31] Wang B, Wu R G, Fu X. Pacific-East Asian teleconnection: how does ENSO affect East Asian climate?[J]. Journal of Climate, 2000, 13(9): 1517-1536. [32] Du Y, Xie S P, Huang G, et al. Role of air-sea interaction in the long persistence of El Niño-induced north Indian Ocean warming[J]. Journal of Climate, 2009, 22(8): 2023-2038. [33] Xie S P, Hu K M, Hafner J, et al. Indian ocean capacitor effect on indo-western Pacific climate during the summer following El Niño[J]. Journal of Climate, 2009, 22(3): 730-747. -

 点击查看大图
计量
- 文章访问数: 9
- HTML全文浏览量: 4
- PDF下载量: 2
- 被引次数: 0
 粤公网安备 4401069904700003号