



Quality Analysis of Horizontal Wind Products from Wind Profilers in Guangdong
-
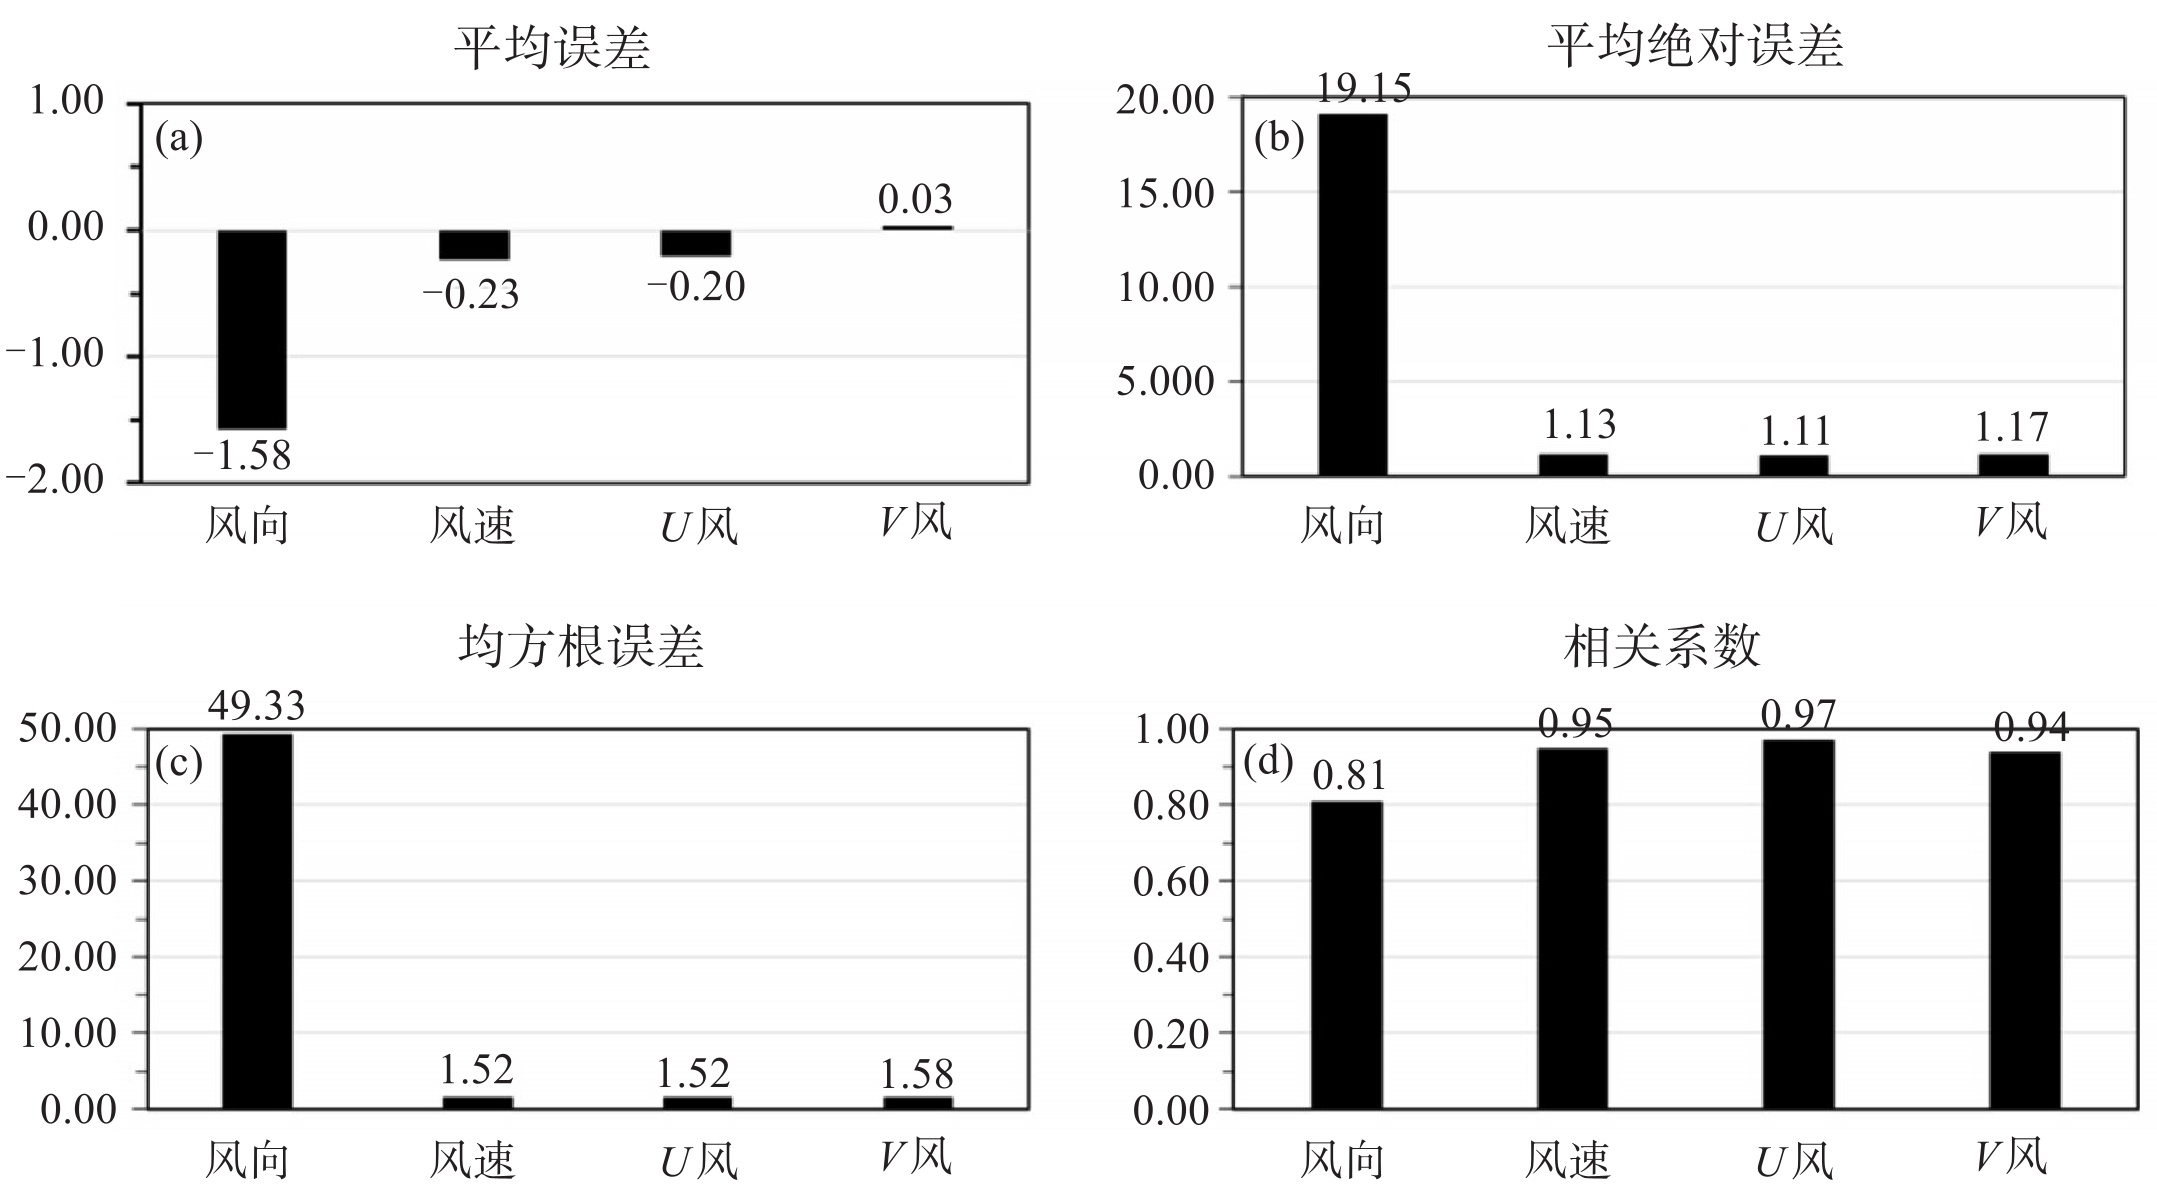
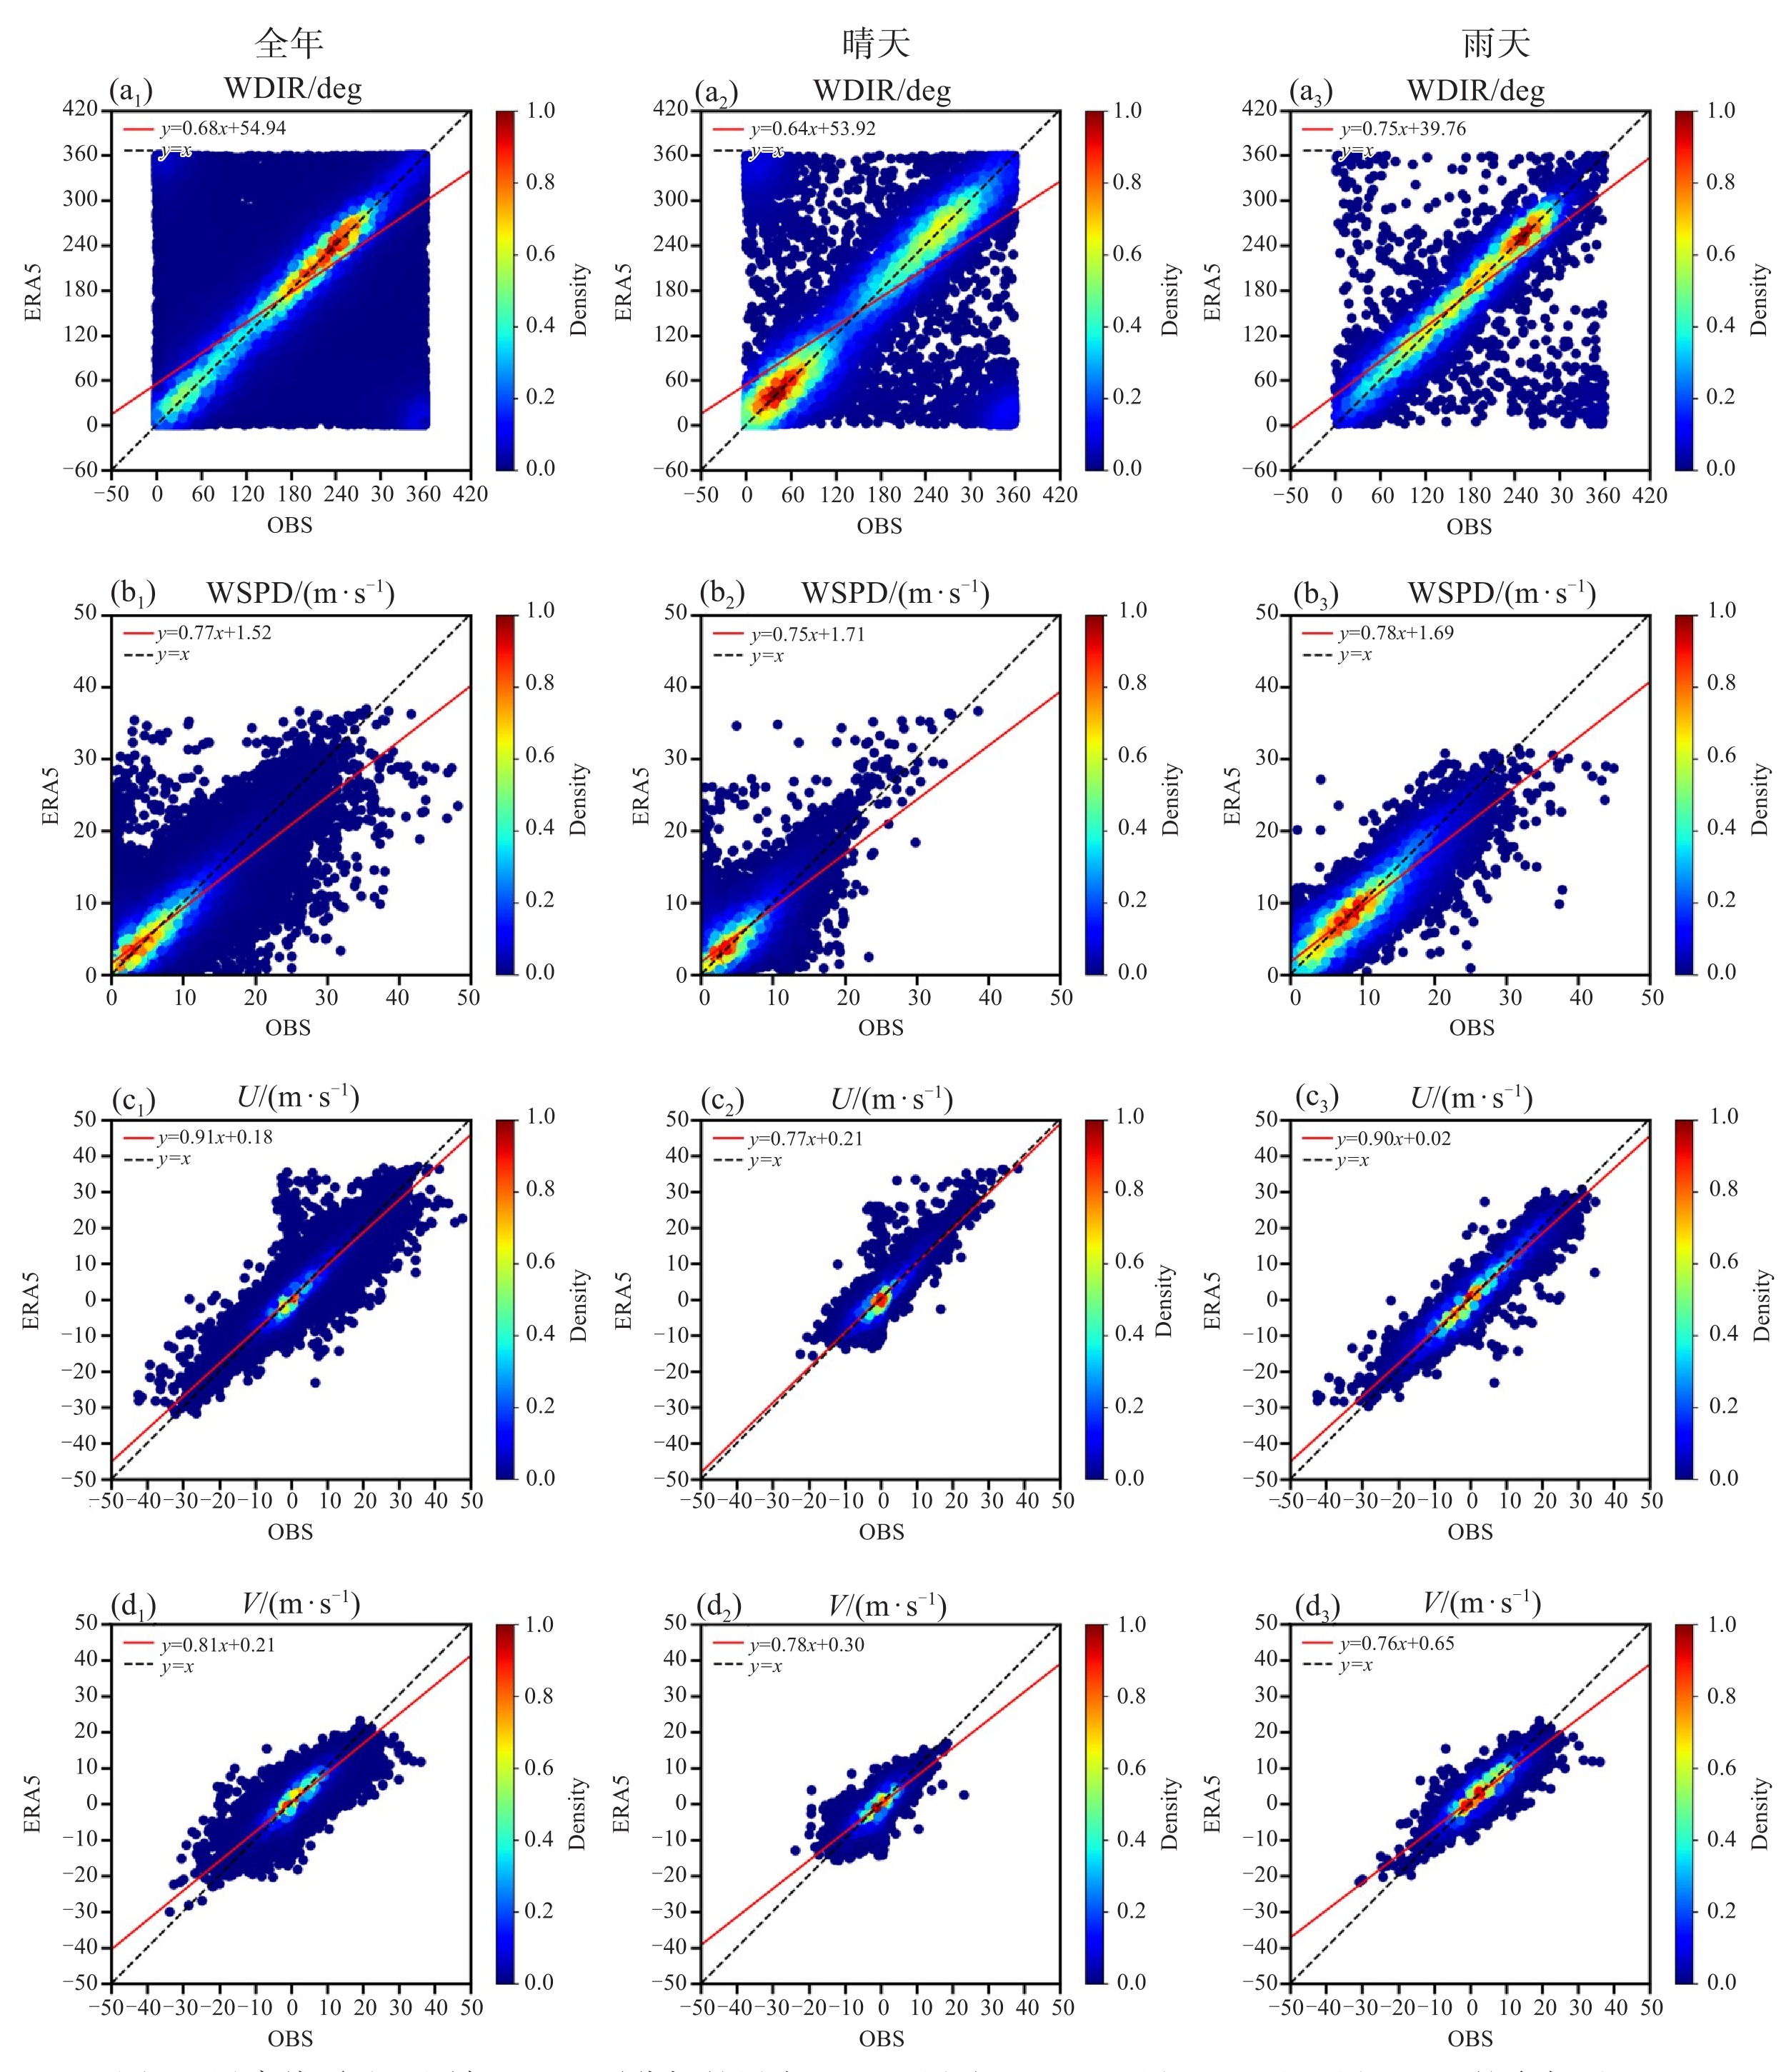
摘要: 为检验风廓线雷达质控产品的质量,本文利用ERA5再分析数据和同址探空数据,分别从误差和相关性统计、晴/雨天的表现、时间演变、误差垂直分布等几方面对2023年广东省风廓线雷达的小时水平风产品开展了对比评估。结果表明,与验证了合理性的ERA5再分析数据相比,风廓线雷达的风向误差较大,但风速、U风和V风和ERA5结果接近,并且无论是晴天还是雨天,其平均误差都在±0.5 m·s-1内、平均绝对误差和均方根误差在1.7~3.3 m·s-1之间、相关性超出0.7,雨天误差略大于晴天,但雨天相关性也更大,表明降雨时期的风廓线雷达数据也具有较强的合理性;和同址探空数据对比,汕头风廓线雷达的风速、U风、V风在2 000 m以上的平均绝对误差和均方根误差垂直分布比较平滑稳定,基本分布在1~5 m·s-1之间,以U风误差最大;多部风廓线雷达的垂直误差分布还表明在垂直探测模式切变高度容易出现误差峰值与突变。总体而言,广东风廓线雷达质控后的水平风产品具有较高的可用性。Abstract: To examine the quality of horizontal wind products from wind profilers, this study uses ERA5 reanalysis data and sounding data from the same site to evaluate the hourly horizontal wind products from wind profilers in Guangdong Province in 2023, by using error and correlation statistics, evaluating the performance on sunny/rainy days, and evaluating time evolution and vertical distribution of errors. Compared with ERA5 reanalysis data that have been verified by the sounding measurements, the errors of wind direction in wind profiler products are large, whereas the errors of wind speed, U and V are small. Whether it is sunny or rainy, the average errors of wind speed, U and V in wind profiler products are within ± 0.5 m·s-1, the average absolute errors and root mean square errors are 1.7-3.3 m·s-1, and the correlation coefficients exceed 0.7. The errors on rainy days are slightly larger than those on sunny days, but the correlation between wind profiler products and ERA5 reanalysis on rainy days is also greater, indicating that the wind profiler products during rainy periods are also reasonable. Compared with sounding data at the same site, Shantou, the vertical distribution of the average absolute errors and root mean square errors of wind speed, U and V above 2 000 m is relatively smooth and stable, basically distributed between 1-5 m·s-1, with U having the largest errors. The vertical error distributions of several wind profiler radars also indicate that error peaks and abrupt changes are prone to occur at the shear heights of vertical detection mode. In general, the horizontal wind products of wind profilers have relatively high quality.
-

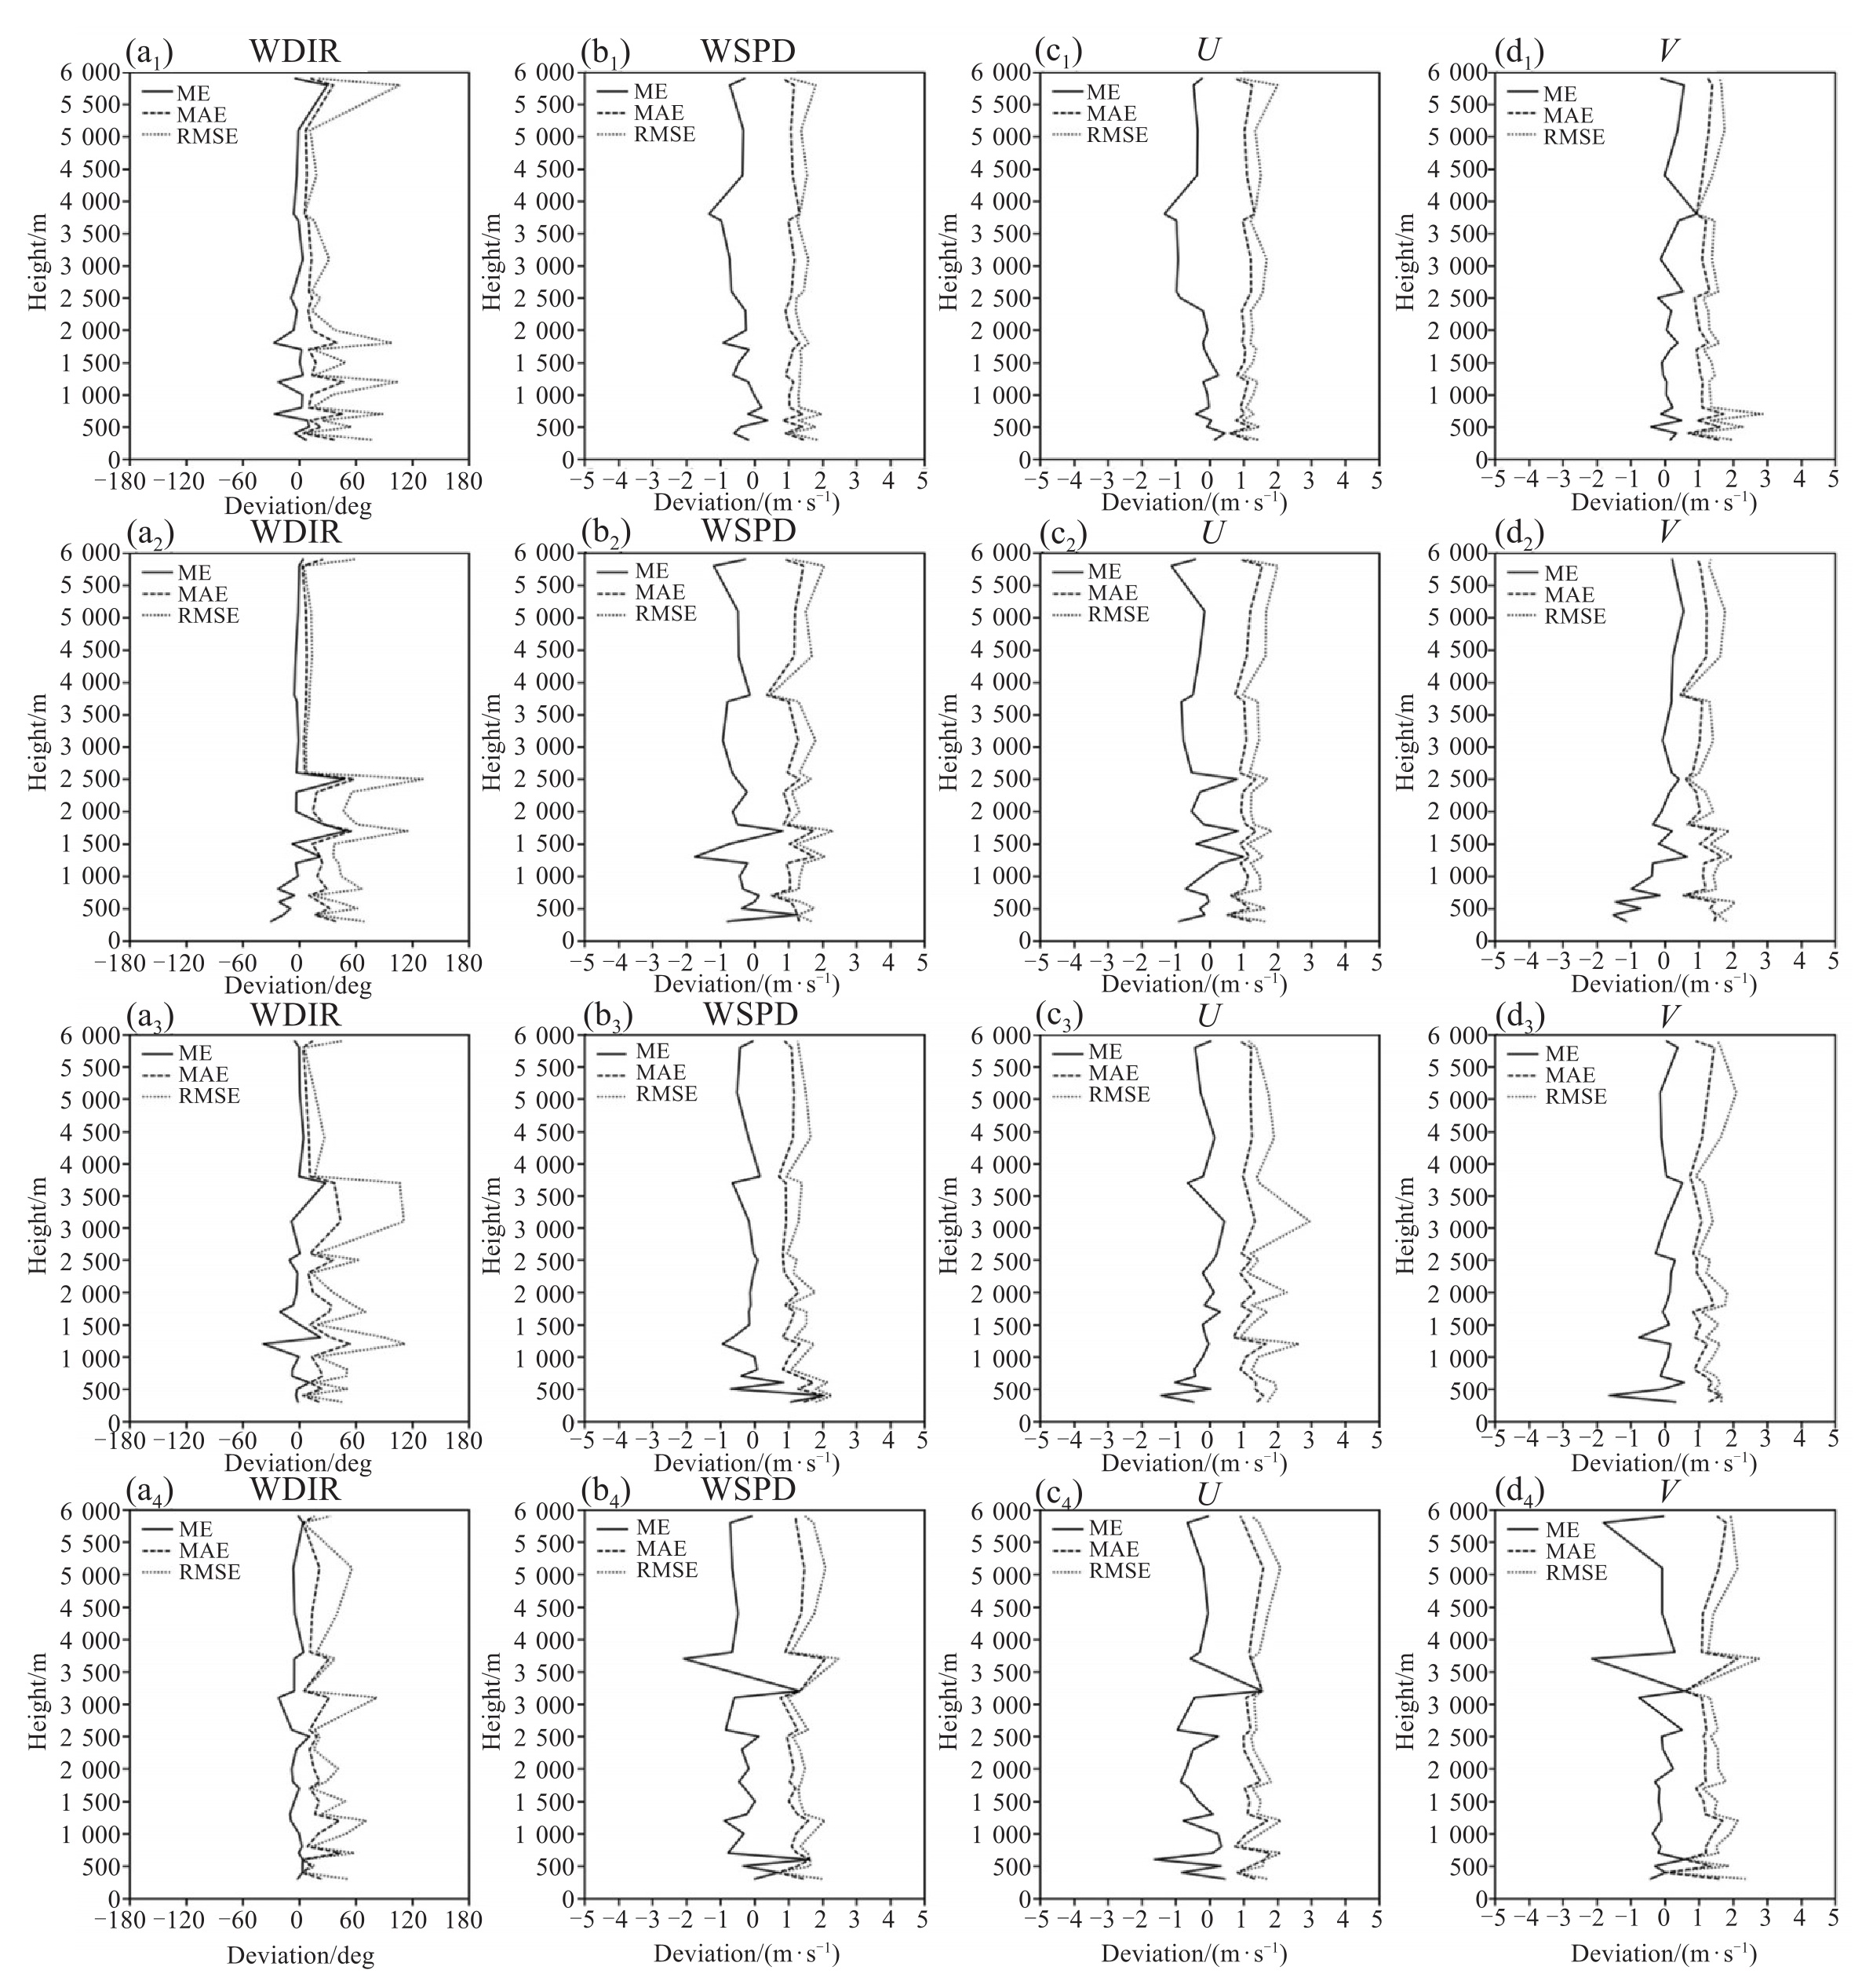
图 3 清远(a1~d1)、河源(a2~d2)、汕头(a3~d3) 和阳江(a4~d4) 的ERA5风向(a1~a4)、风速(b1~b4)、U风(c1~c4) 和V风(d1~d4) 与探空观测的平均误差(实线)、平均绝对误差(虚线)和均方根误差(点线)的垂直分布

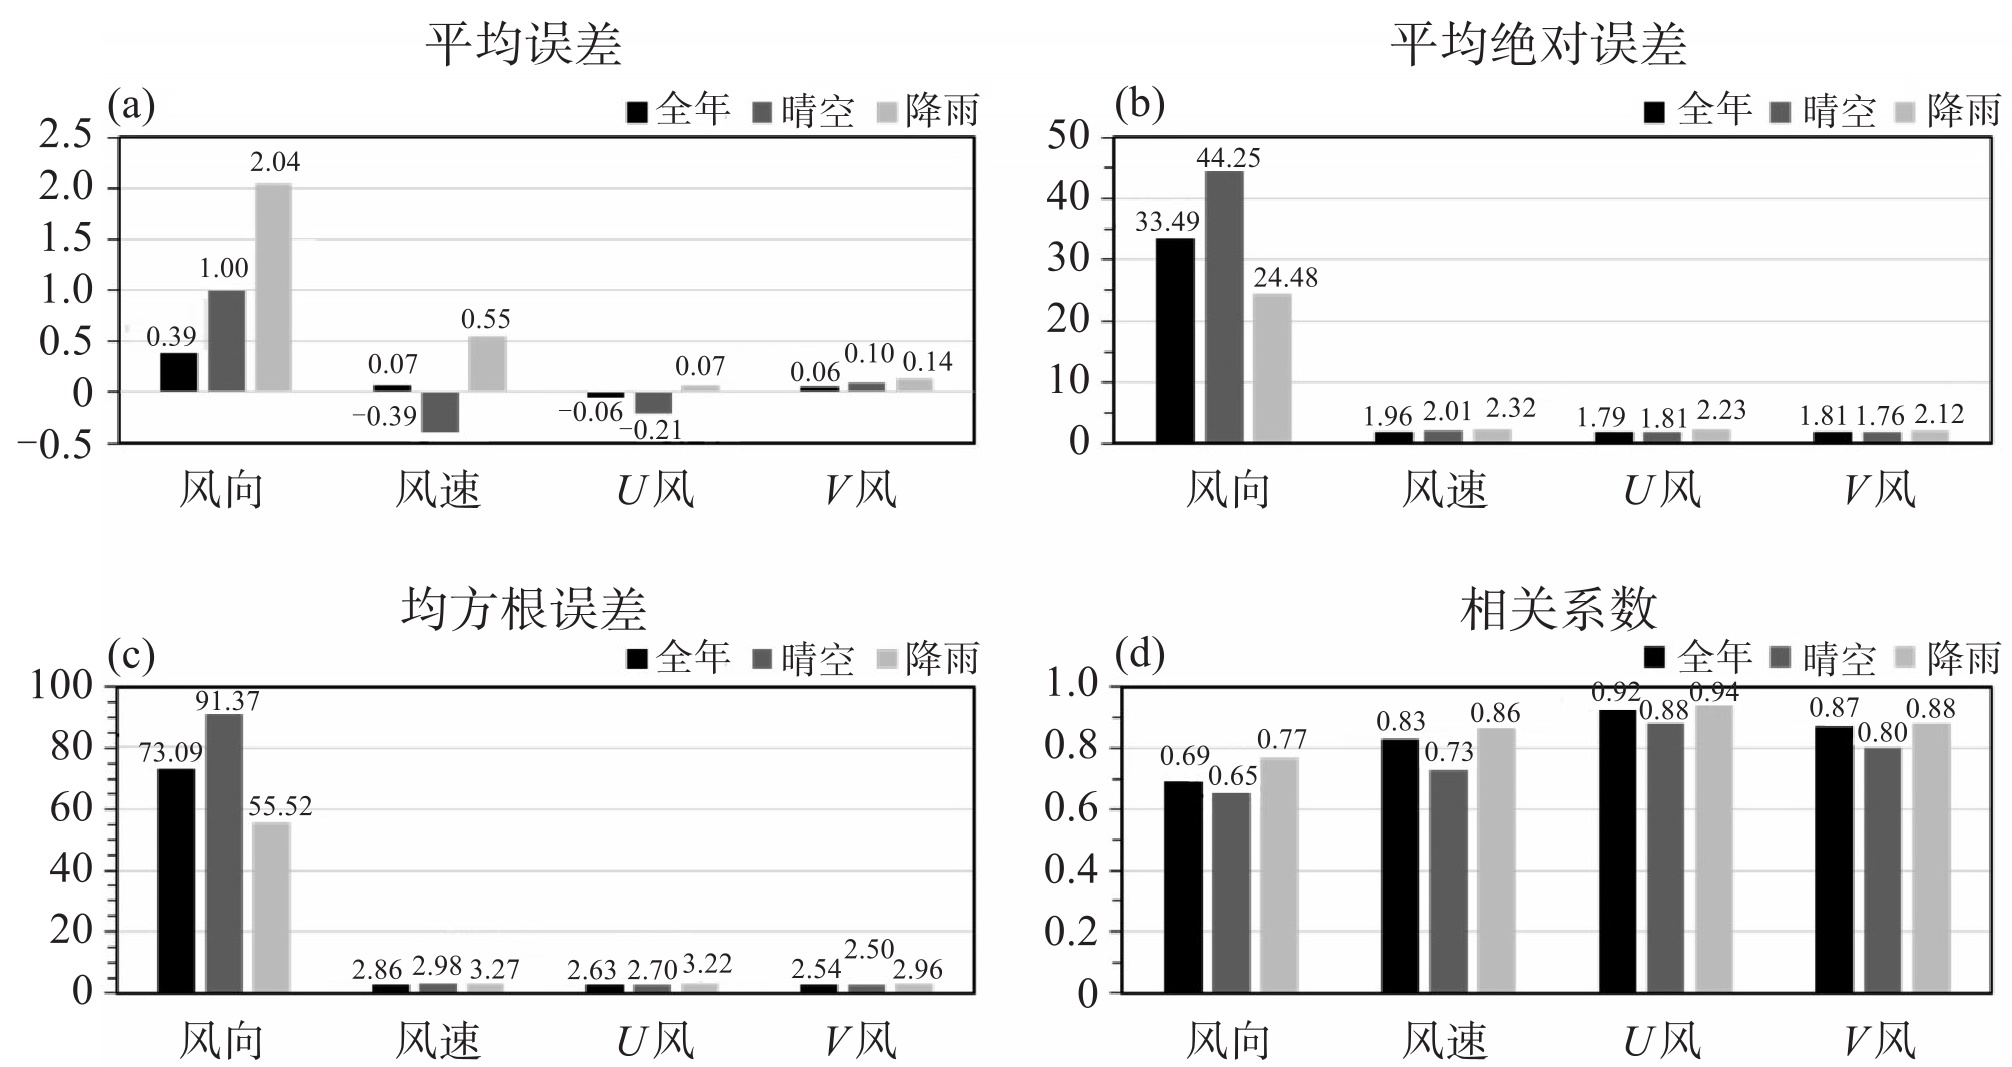
图 4 风廓线雷达与ERA5的风向、风速、U风和V风的平均误差(a)、平均绝对误差(b)、均方根误差(c)和相关系数(d)的全年(黑色)、晴天(深灰色)和雨天(浅灰色)统计结果

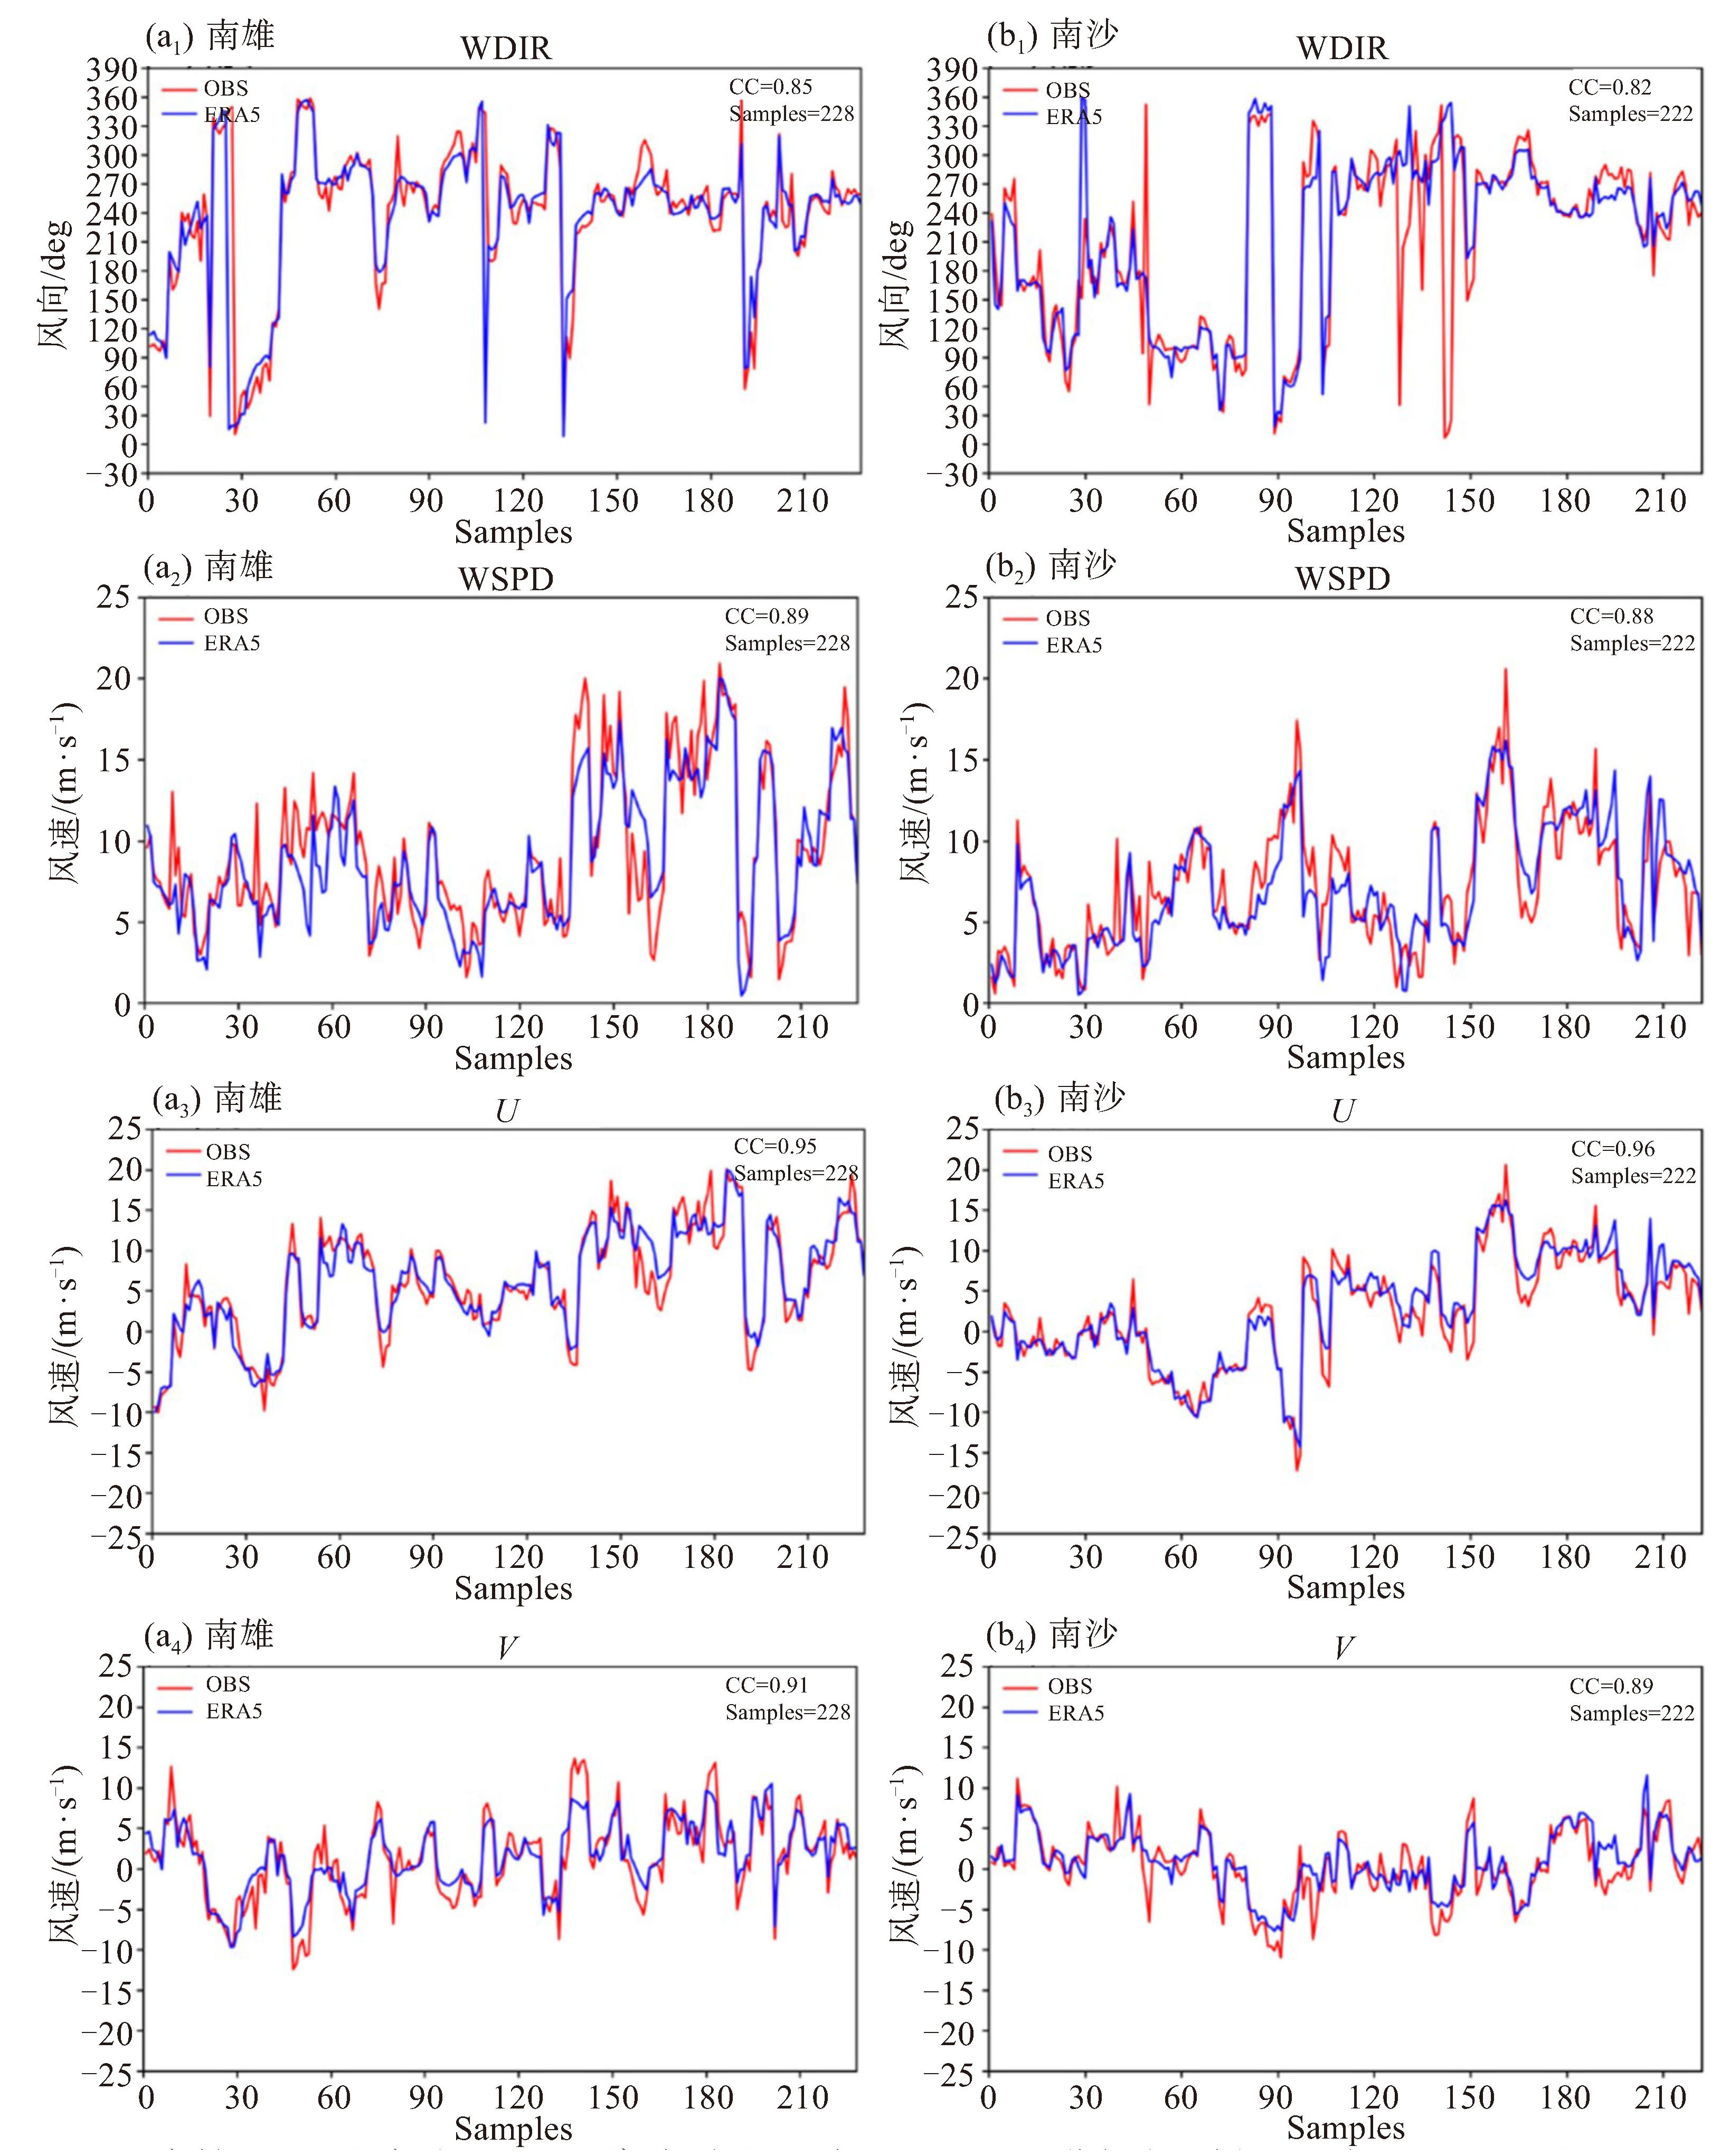
图 6 南雄(a1~a4) 和南沙(b1~b4)风廓线雷达(红线)和ERA5再分析(蓝线)的风向(a1、b1)、风速(a2、b2)、U风(a3、b3) 和V风(a4、b4) 在3 150 m高度上的演变曲线

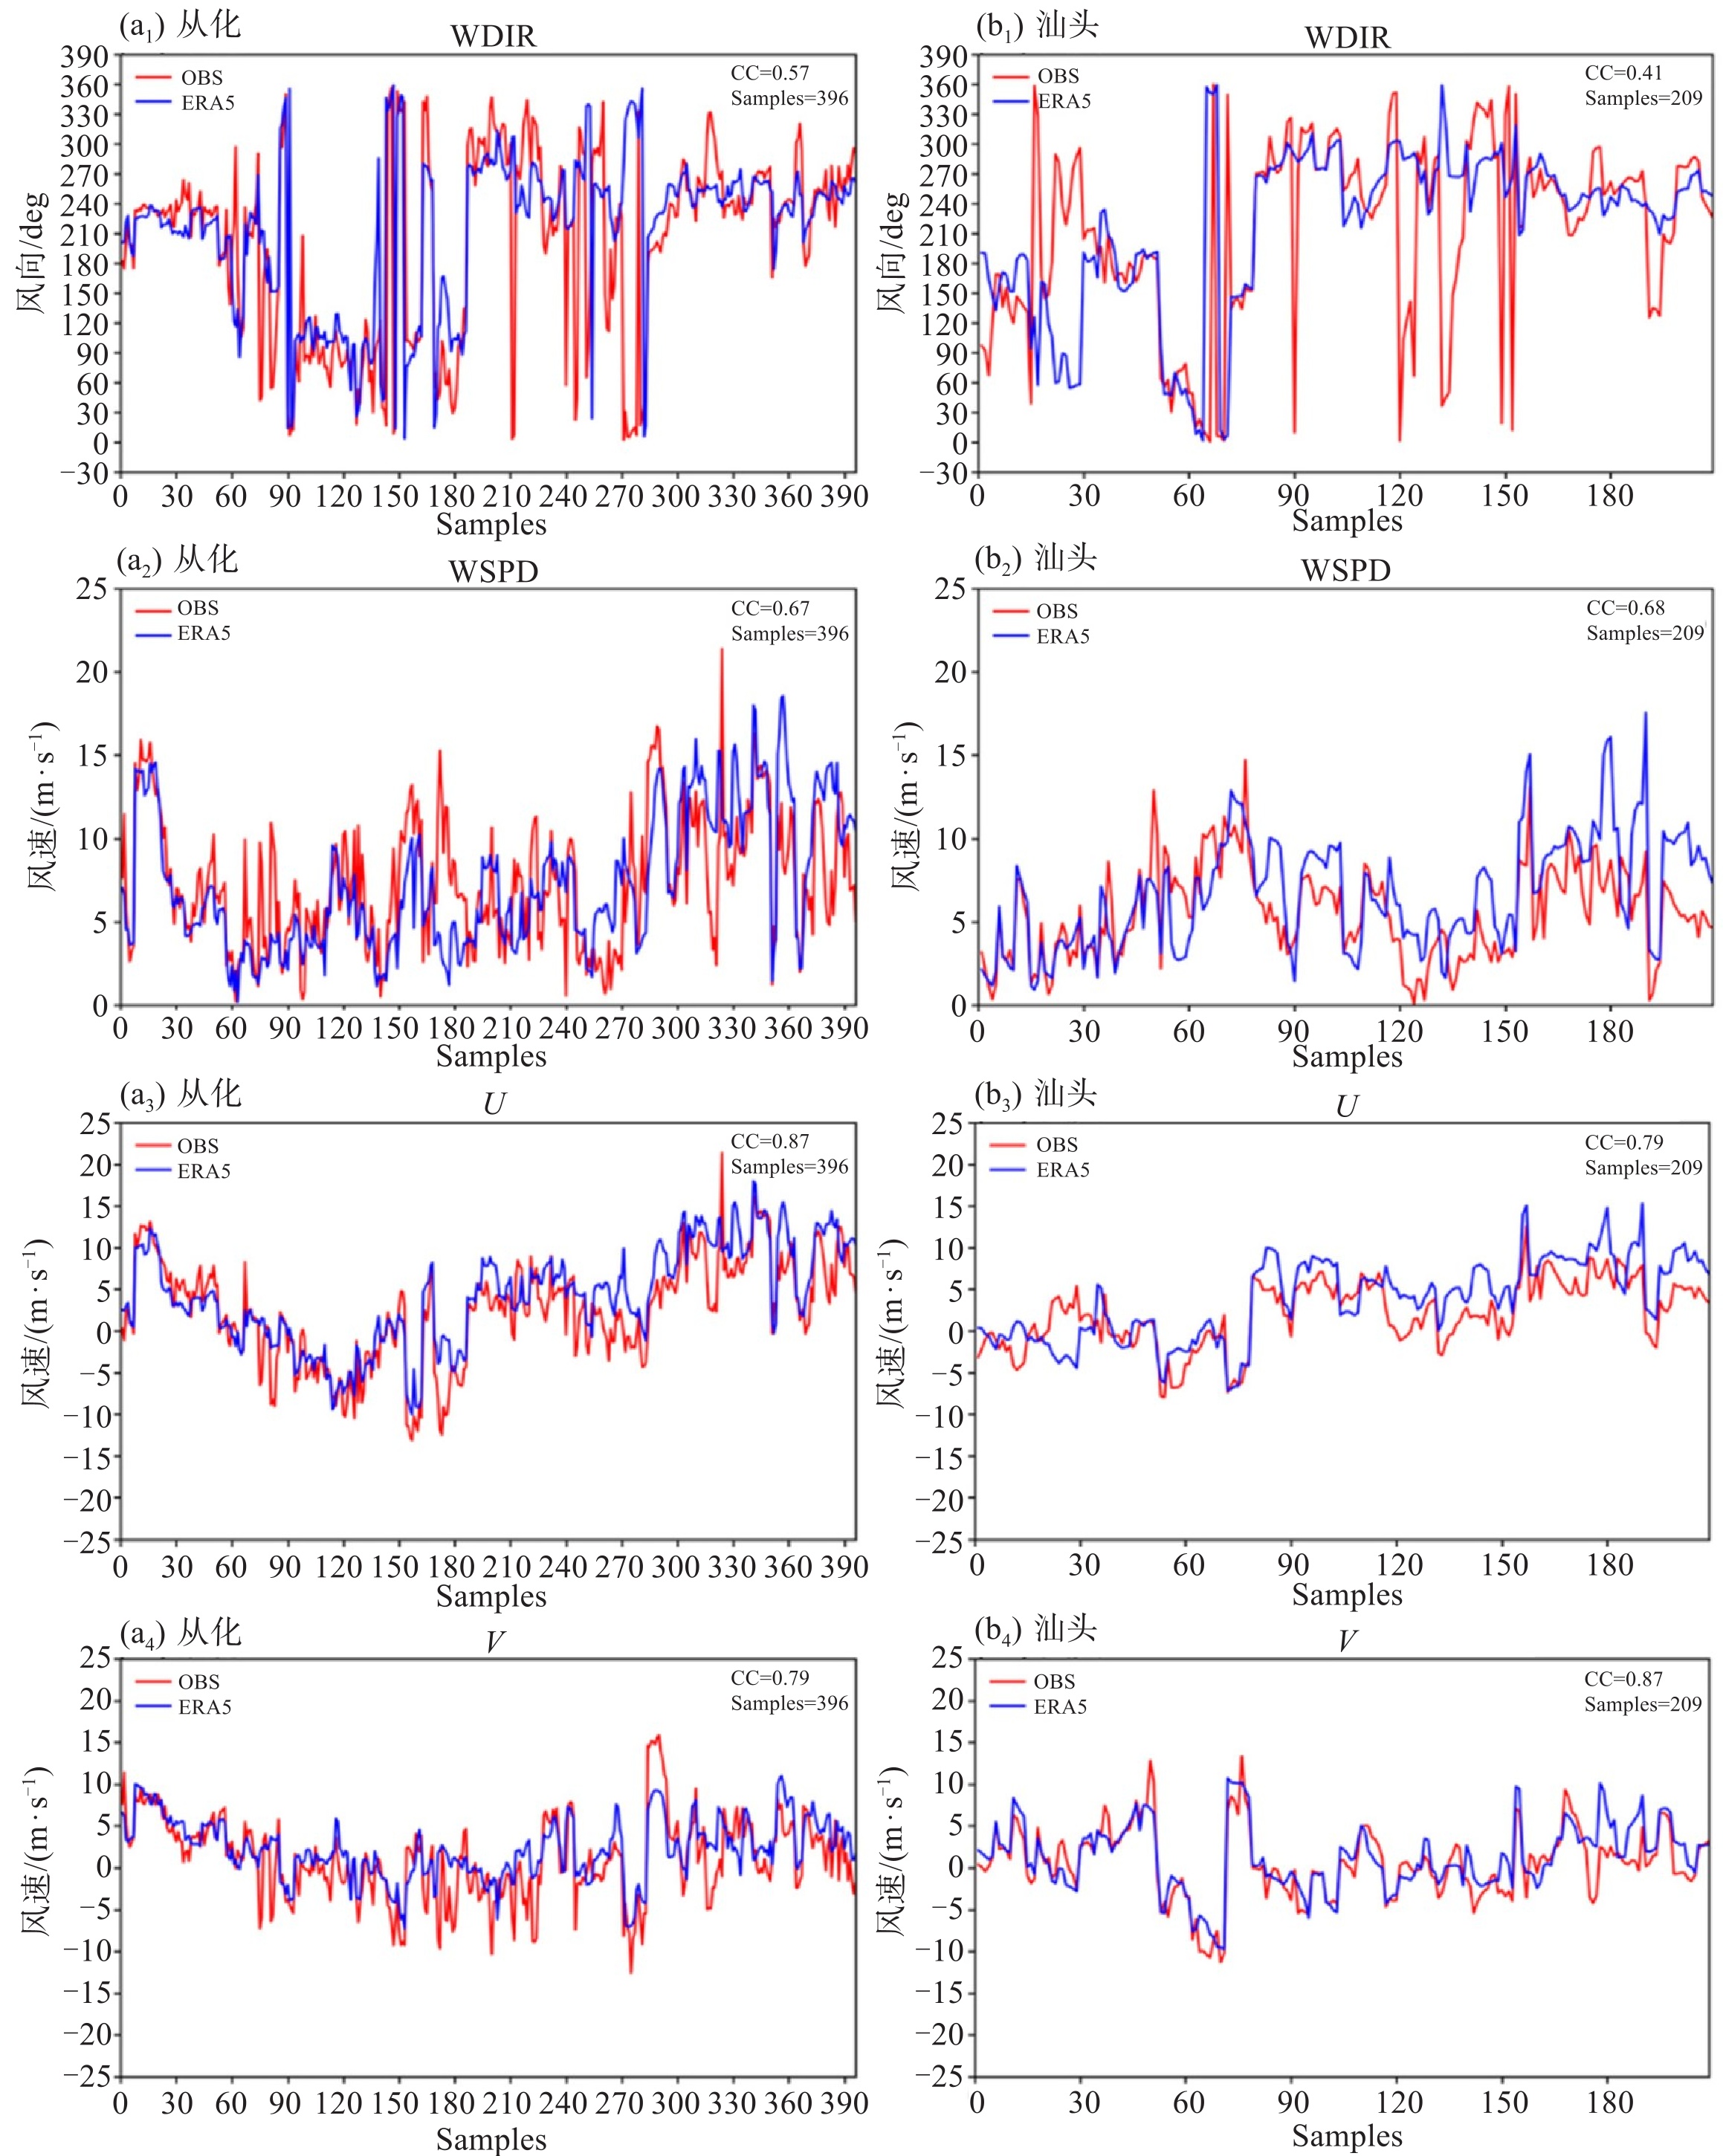
图 7 从化(a1~a4) 和汕头(b1~b4)的风廓线雷达(红线)和ERA5再分析(蓝线)的风向(a1、b1)、风速(a2、b2)、U风(a3、b3) 和V风(a4、b4) 在3 150 m高度上的演变曲线

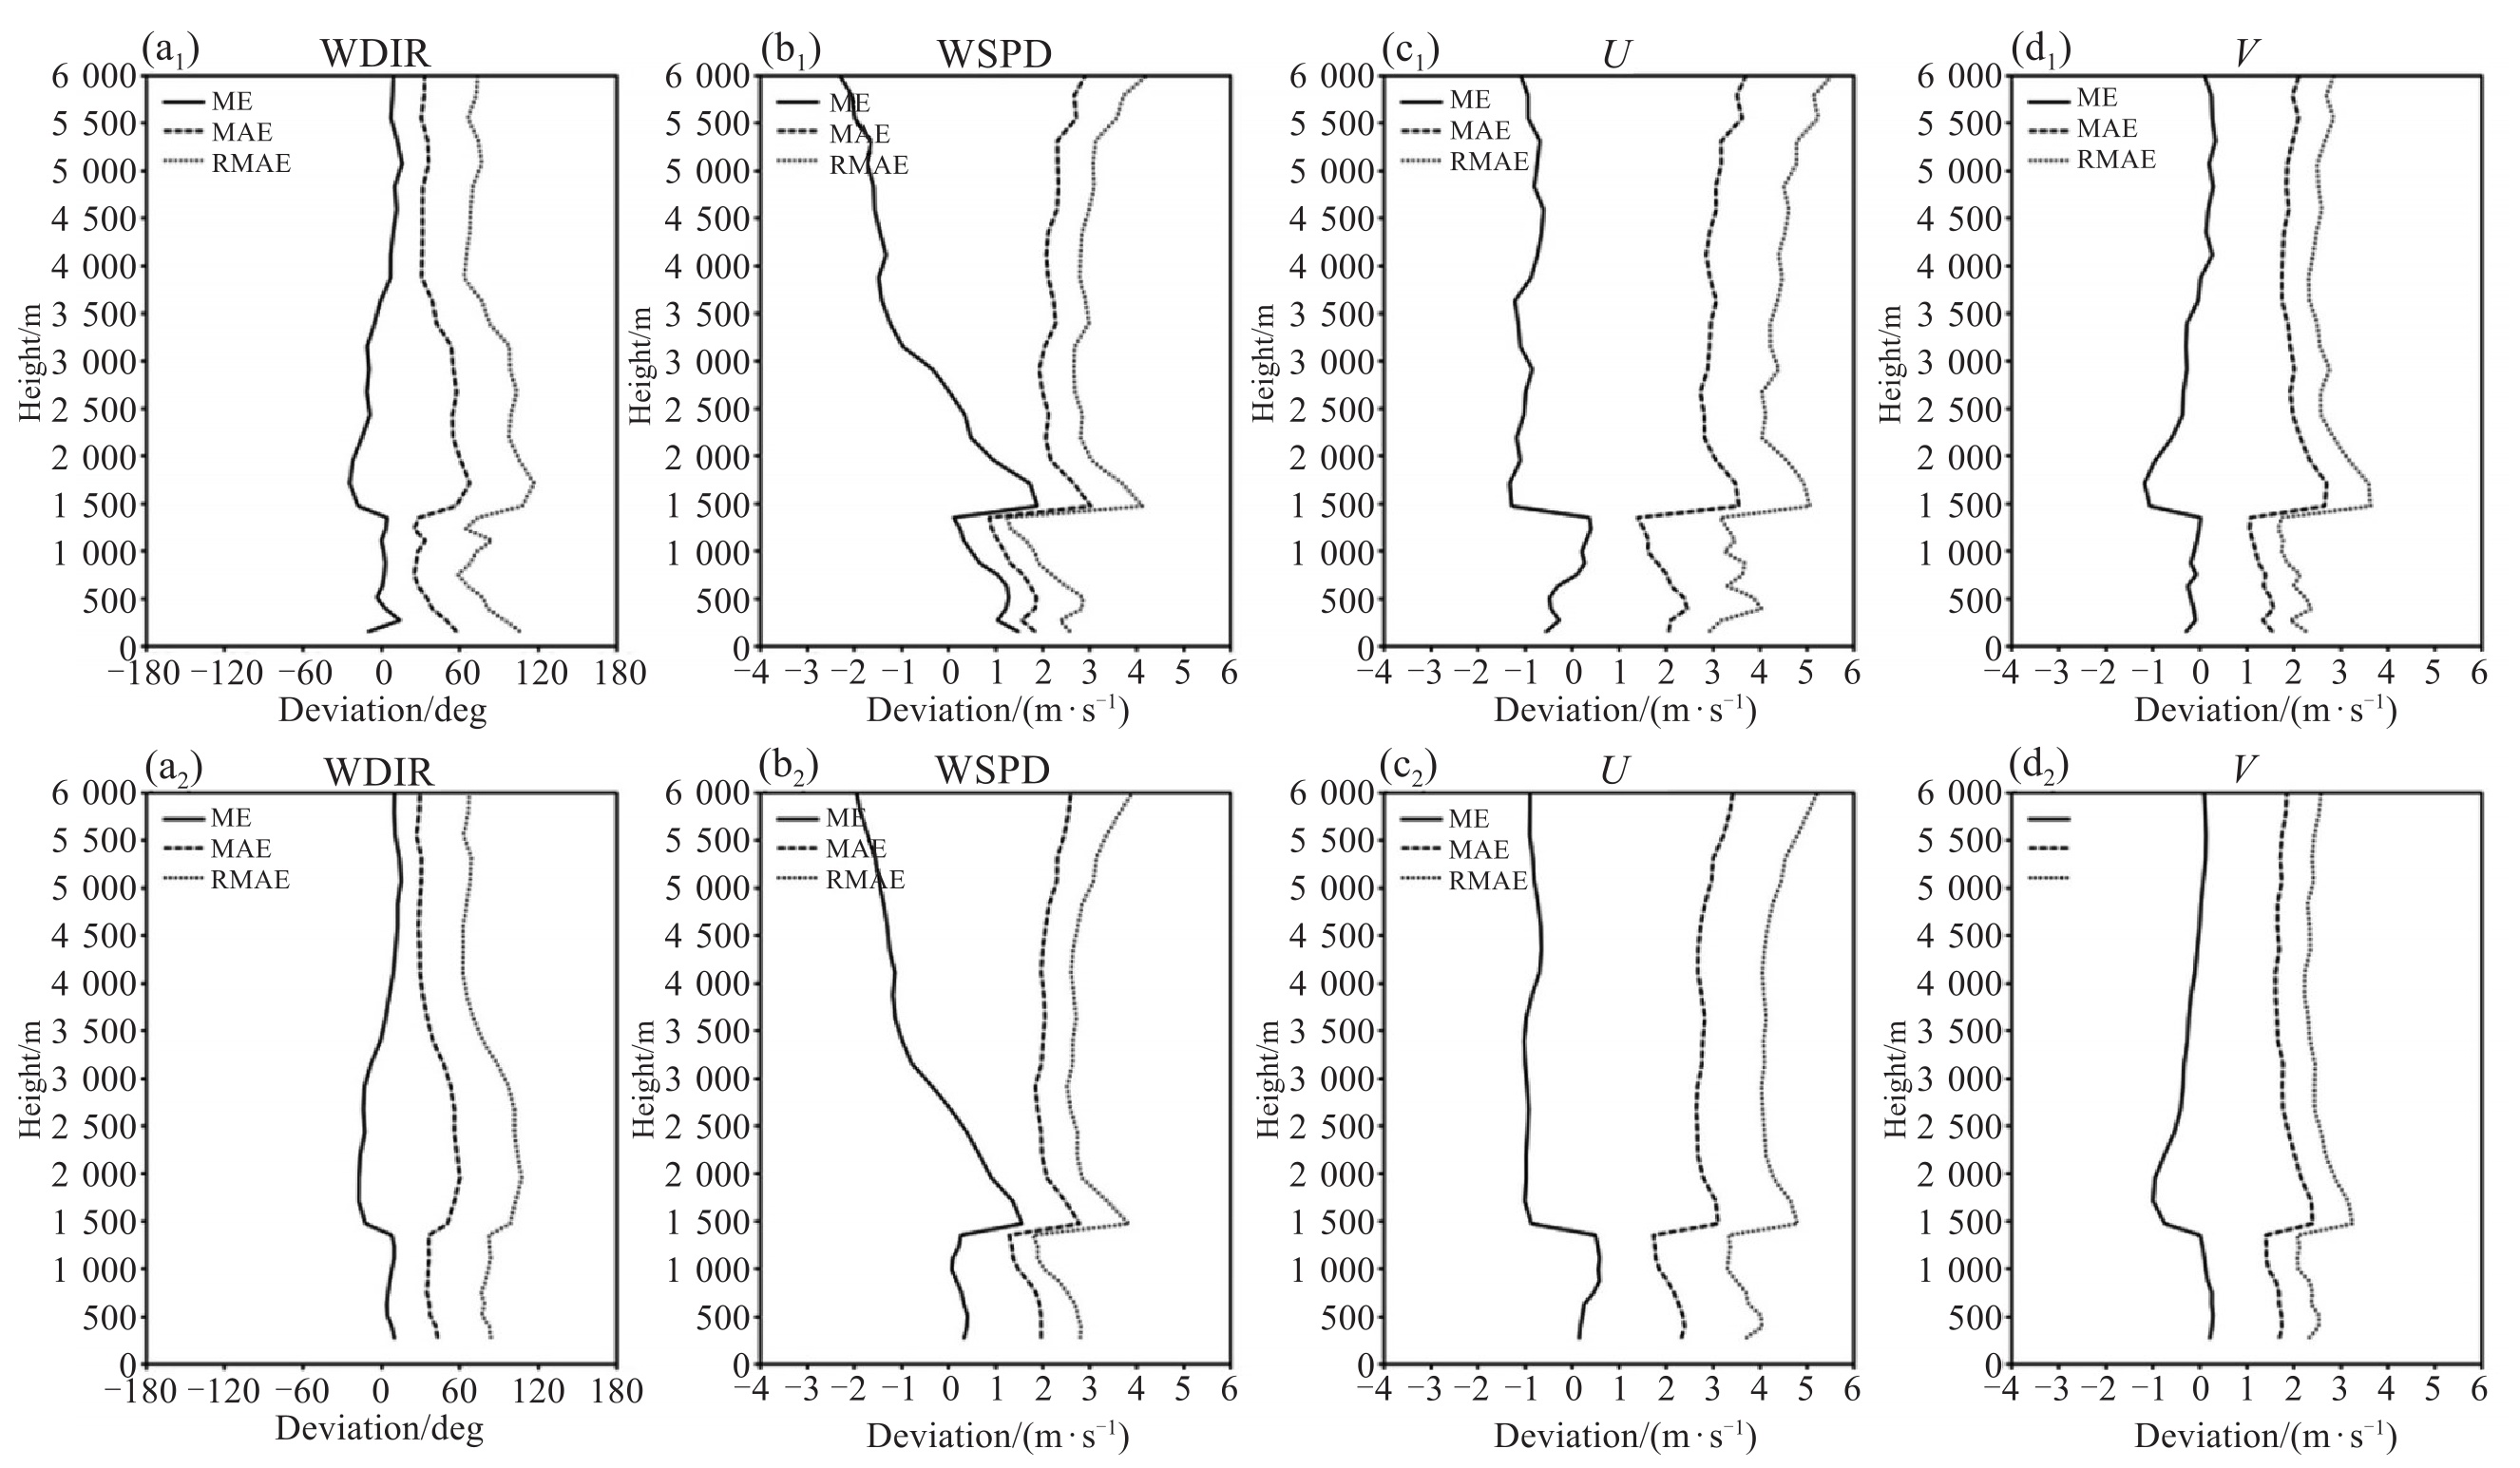
图 8 汕头风廓线雷达分别与探空(a1~d1)、ERA5再分析(a2~d2) 的水平风向(a1~a2)、风速(b1~b2)、U风(c1~c2)和V风(d1~d2)的平均误差(实线)、平均绝对误差(虚线)和均方根误差(点线)
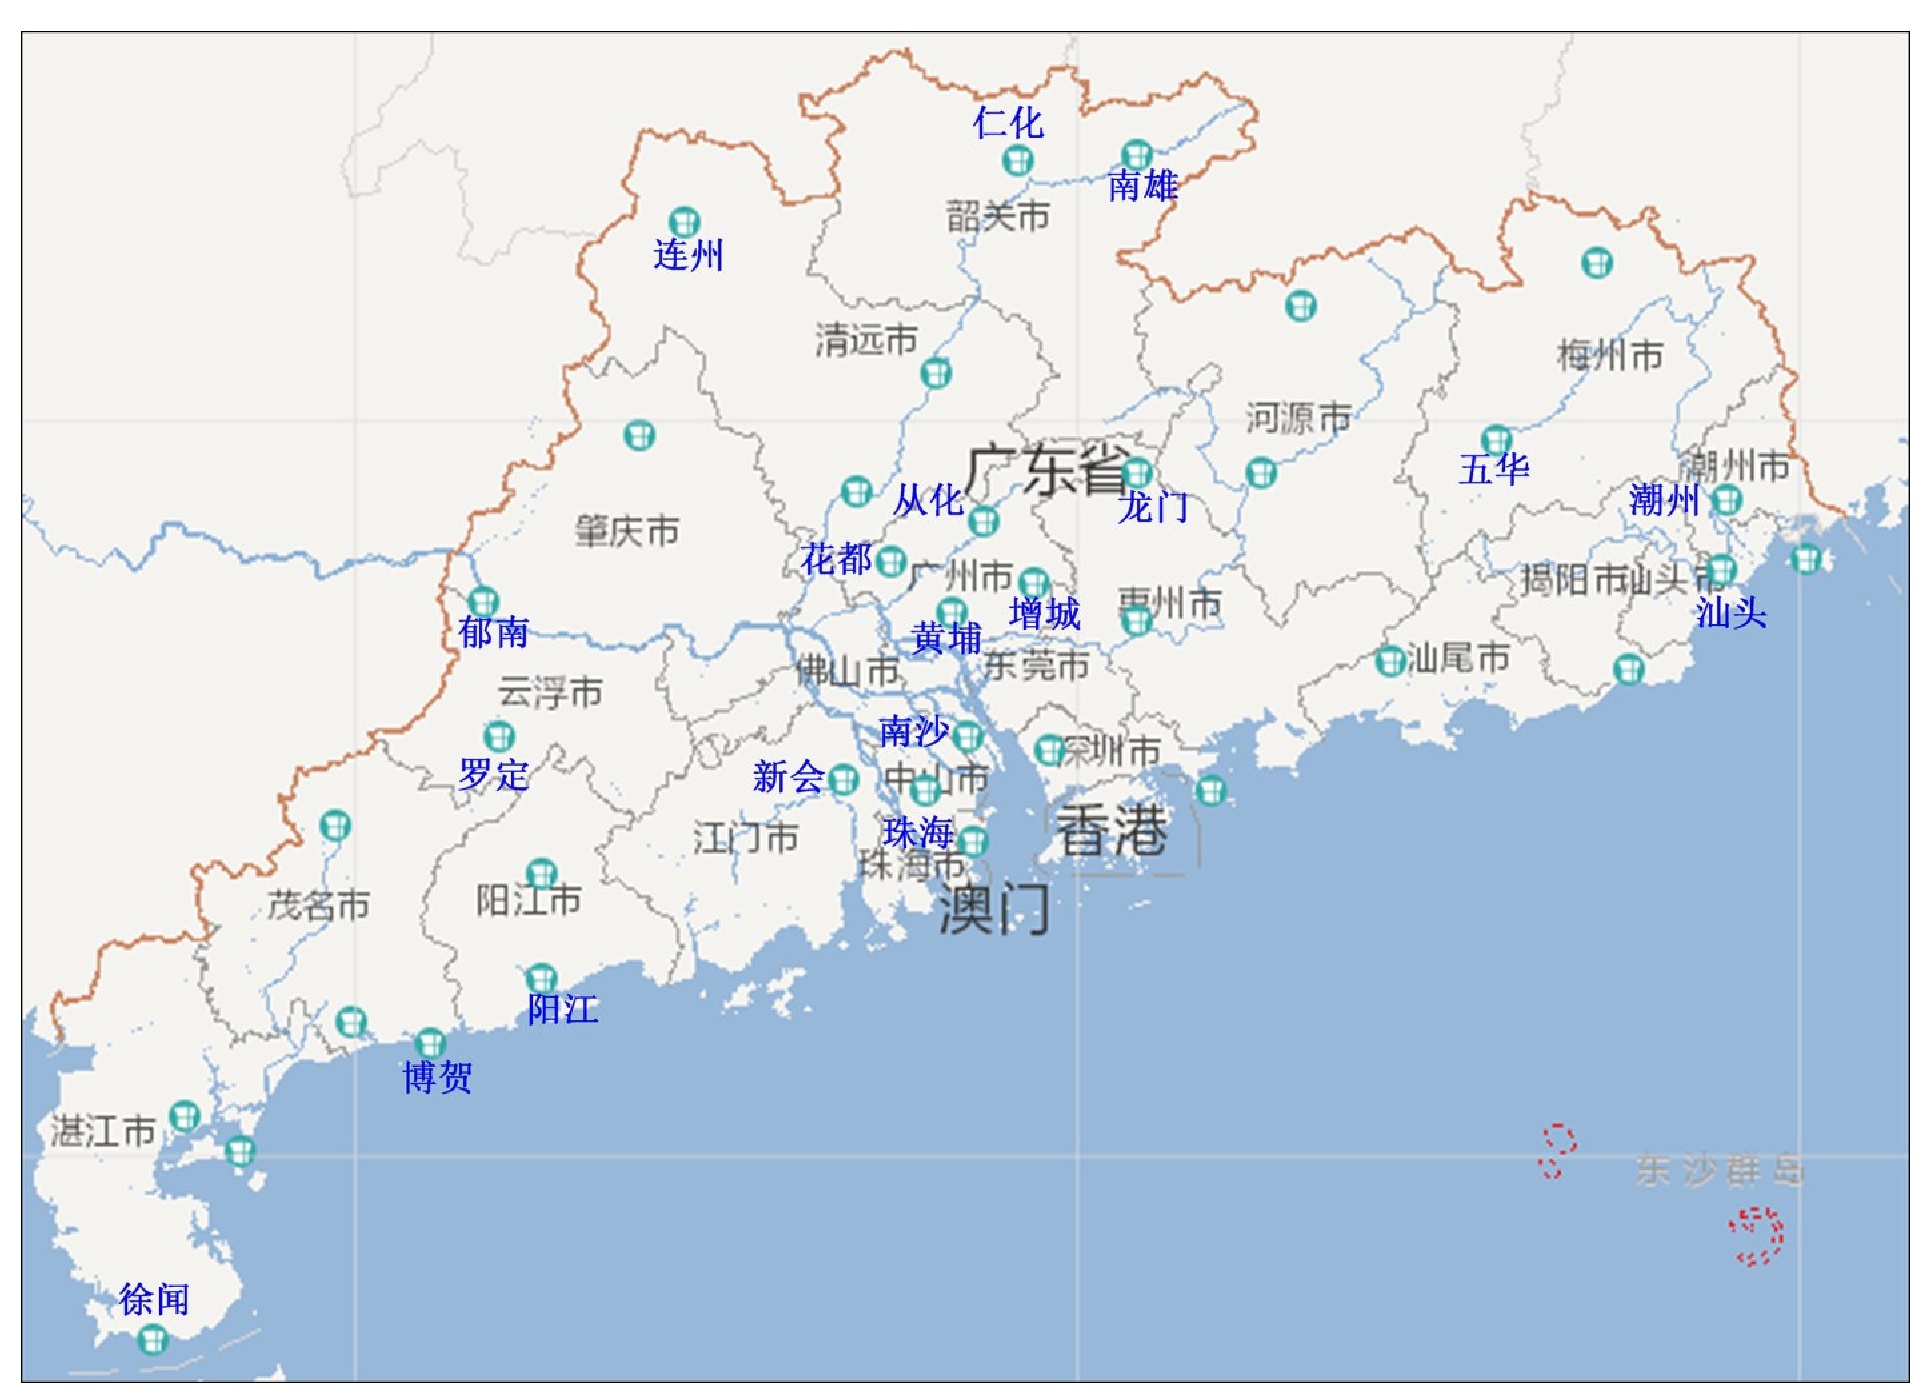
表 1 广东省2023年上传到中国气象局并完成质控回算业务流程的站点信息
序号 站名 城市 型号 垂直分辨率 探测高度范围 1 从化 广州 TWP3 60 m 100~5 920 m 2 增城 广州 TWP3 60 m 100~5 920 m 3 连州 清远 TWP3 60 m 100~5 920 m 4 南雄 韶关 TWP3 60 m 100~5 920 m 5 潮州 潮州 TWP3 60 m 100~5 920 m 6 罗定 云浮 TWP3 60 m 100~5 920 m 7 新会 江门 TWP3 60 m 100~5 920 m 8 珠海 珠海 TWP3 60 m 100~5 920 m 9 徐闻 湛江 TWP16 240 m 150~15 870 m 10 花都 广州 TWP3 1 000 m以下60 m, 1 000 m以上120 m 100~5 670 m 11 南沙 广州 TWP3 1 000 m以下60 m, 1 000 m以上120 m 100~5 430 m 12 龙门 惠州 TWP3 1 000 m以下60 m, 1 000 m以上120 m 100~5 430 m 13 海陵 阳江 TWP3 1 000 m以下60 m, 1 000 m以上120 m 100~5 670 m 14 五华 梅州 TWP3 1 500 m以下120 m, 1 500 m以上240 m 150~8 910 m 15 汕头 汕头 TWP8 1 500 m以下120 m, 1 500 m以上240 m 150~8 910 m 16 博贺 茂名 TWP8 1 500 m以下120 m, 1 500 m以上240 m 150~8 910 m 17 黄埔 广州 TWP16 2 000 m以下120 m, 2 000 m以上240 m 150~15 870 m 18 仁化 韶关 TWP16 2 000 m以下120 m, 2 000 m以上240 m 150~15 630 m 19 郁南 云浮 TWP16 2 000 m以下120 m, 2 000 m以上240 m 150~15 630 m  下载: 导出CSV
-
[1] 黄书荣, 吴蕾, 马舒庆, 等. 结合毫米波雷达提取降水条件下风廓线雷达大气垂直速度的研究[J]. 气象学报, 2017, 75(5): 823-834. [2] 王志诚, 张雪芬, 茆佳佳, 等. 地基遥感大气温湿风垂直廓线观测方法综述[J]. 气象水文海洋仪器, 2018, 35(2): 109-116. [3] 万蓉. 我国暴雨研究中新型探测资料反演技术及其应用[J]. 气象科技进展, 2014, 4(2): 24-35. [4] 张小雯, 郑永光, 吴蕾, 等. 风廓线雷达资料在天气业务中的应用现状与展望[J]. 气象科技, 2017, 45(2): 285-297. [5] 刘瑞婷, 阮征, 魏鸣, 等. 风的空间不均匀分布对风廓线雷达数据质量影响研究[J]. 热带气象学报, 2016, 32(2): 229-236. [6] 高祝宇, 阮征, 魏鸣, 等. 风廓线雷达数据质量影响因子及处理算法[J]. 应用气象学报, 2016, 27(2): 148-159. [7] Dolman B K, Reid I M, Tingwell C. Stratospheric tropospheric wind profiling radars in the Australian network[J]. Earth, Planets and Space, 2018, 70(1): 170. [8] 吴志根, 沈利峰. 边界层风廓线仪应用中存在的若干问题[J]. 高原气象, 2010, 29(3): 801-809. [9] 黄治勇, 周志敏, 徐桂荣, 等. 风廓线雷达和地基微波辐射计在冰雹天气监测中的应用[J]. 高原气象, 2015, 34(1): 269-278. [10] Saïd F, Campistron B, Delbarre H, et al. Offshore winds obtained from a network of wind-profiler radars during HyMeX[J]. Quarterly Journal of the Royal Meteorological Society, 2016, 142(S1): 23-42. [11] 傅新姝, 顾问, 彭杰, 等. 2020年梅雨期上海一次强降水过程垂直结构的综合观测分析[J]. 暴雨灾害, 2020, 39(6): 658-665. [12] Pan C J, Lai H C, Yang S S, et al. Wind profiler radar investigation on typhoon-orography interaction[J]. Geophysical Research Letters, 2008, 35(24): L24812. [13] 陈楠, 胡明宝, 张柽柽, 等. 利用风廓线雷达资料对南京地区低空急流的统计分析[J]. 热带气象学报, 2014, 30(3): 511-517. [14] Shu Z R, Li Q S, He Y C, et al. Investigation of low-level jet characteristics based on wind profiler observations[J]. Journal of Wind Engineering and Industrial Aerodynamics, 2018, 174: 369-381. [15] 李健, 栗敬仁, 田军. 利用风廓线雷达研究郑州机场低空急流特征及其对飞行的影响[J]. 热带气象学报, 2019, 35(3): 343-352. [16] 黄兴友, 何雨芩, 刘俊. 风廓线雷达资料反演雨滴谱和水汽通量的研究[J]. 气象科学, 2015, 35(6): 751-759. [17] 周芯玉, 廖菲, 胡东明. 利用风廓线雷达对广东前汛期短时强降水类暴雨过程低空风场特征的研究[J]. 热带气象学报, 2019, 35(3): 332-342. [18] 张旭斌, 万齐林, 薛纪善, 等. 风廓线雷达资料质量控制及其同化应用[J]. 气象学报, 2015, 73(1): 159-176. [19] 王丹, 阮征, 王改利, 等. 风廓线雷达资料在GRAPES-Meso模式中的同化应用研究[J]. 大气科学, 2019, 43(3): 634-654. [20] 胡明宝. 风廓线雷达探测与应用[M]. 北京: 气象出版社, 2015. [21] 周芯玉, 廖菲. 利用中位数方法对风廓线雷达数据质量控制的研究[J]. 热带气象学报, 2015, 31(6): 804-810. [22] 林晓萌, 尉英华, 陈宏, 等. 降水时风廓线雷达风场反演效果评估[J]. 应用气象学报, 2020, 31(3): 361-372. [23] 施红蓉, 李峰, 吴蕾, 等. 风廓线雷达对降水相态变化的观测分析[J]. 气象, 2014(10): 1259-1265. [24] Hooper D A, McDonald A J, Pavelin E, et al. The signature of mid-latitude convection observed by VHF wind-profiling radar[J]. Geophysical Research Letters, 2005, 32(4): L04808. [25] 张福贵, 范潇, 何建新. 自适应阈值方法去除风廓线雷达地物杂波[J]. 应用气象学报, 2015, 26(4): 472-481. [26] Strauch R G, Weber B L, Frisch A S, et al. The precision and relative accuracy of profiler wind measurements[J]. Journal of Atmospheric and Oceanic Technology, 1987, 4(4): 563-571. [27] 邓闯, 阮征, 魏鸣, 等. 风廓线雷达测风精度评估[J]. 应用气象学报, 2012, 23(5): 523-533. [28] May P T. Comparison of wind-profiler and radiosonde measurements in the tropics[J]. Journal of Atmospheric and Oceanic Technology, 1993, 10(1): 122. [29] 顾问, 岳彩军, 陈浩君, 等. 上海移动式风廓线雷达的探测性能评估与分析[J]. 暴雨灾害, 2021, 40(6): 637-645. [30] 刘梦娟, 刘舜. 上海组网风廓线雷达数据质量评估[J]. 气象, 2016, 42(8): 962-970. [31] 赵美艳, 朱君, 余君, 等. 重庆风廓线雷达资料的适用性评估[J]. 气象与环境学报, 2024, 40(3): 115-123. [32] 黄晴, 梁维亮, 黄荣. 风廓线雷达产品与ERA5再分析资料的对比分析[J]. 气象研究与应用, 2021, 42(4): 83-88. [33] 李晓波, 王颖, 庄庭, 等. 京津冀风廓线雷达组网资料评估及应用研究[J]. 气象与环境科学, 2024, 47(2): 94-102. [34] 赵新宇, 闵锦忠, 朱利剑, 等. 风廓线雷达资料的应用: 质量评估[J]. 大气科学学报, 2023, 46(3): 453-465. [35] 吴蕾, 李瑞义, 杨馨蕊, 等. 风廓线雷达网国家级数据质量控制及评估系统(V1.0)[R]. 中国气象局气象探测中心, 2017. [36] Armstrong J S. Principles of Forecasting: A Handbook for Researchers and Practitioners[M]. Springer, 2001. [37] Willmott C J, Matsuura K. Advantages of the mean absolute error (MAE) over the root mean square error (RMSE) in assessing average model performance[J]. Climate Research, 2005, 30: 79-82. [38] Hyndman R J, Koehler A B. Another look at measures of forecast accuracy[J]. International Journal of Forecasting, 2006, 22(4): 679-688. [39] Pearson K. X. Contributions to the mathematical theory of evolution. Ⅱ. Skew variation in homogeneous material[J]. Philosophical Transactions of the Royal Society of London (A), 1895(186): 343-414. -

 点击查看大图
计量
- 文章访问数: 7
- HTML全文浏览量: 1
- PDF下载量: 1
- 被引次数: 0
 粤公网安备 4401069904700003号