



Differential Analysis of Sea-land Boundary Layer Structure of Typhoon Moranti
-
摘要: 在超强台风莫兰蒂(1614)系统影响下,主要利用福建沿海风廓线雷达观测资料对“海洋”和陆地下垫面的台风边界层结构差异性进行了详细分析,结果表明,气球探空资料反演的热力学边界层高度和动力学边界层高度存在明显的分离,风廓线雷达风场资料反演最大切向风速高度(Hvtmax)和入流层高度(Hinflow)在晴空天气下具有较高的可靠性,在降雨条件下只能定性反映台风边界层特征。在台风莫兰蒂外雨带(距台风中心200~100 km),“海洋”下垫面的Hvtmax位于Hinflow下方,在外围晴空(距台风中心600~400 km),“海洋”下垫面的Hvtmax和Hinflow处于同一高度水平,而陆地下垫面受摩擦效应影响Hvtmax始终位于Hinflow之上,陆地下垫面的切向风速比“海洋”下垫面的偏小,陆地下垫面的Hvtmax比“海洋”下垫面的偏高。此外,在台风莫兰蒂外围晴空,“海洋”下垫面的湍流活动主要分布在Hinflow上或其下方;而陆地下垫面的湍流活动更强,主要分布在Hvtmax和Hinflow之间,表明在台风边界层高度上下有着复杂的湍流活动。可见,不同下垫面形成不同的台风边界层结构分布特征,这些结果希望能够为评估和改进台风模型中的边界层方案提供有用的信息。Abstract: Under the influence of the super typhoon Moranti (1614) system, a detailed analysis was conducted on the differences in typhoon boundary layer structures between the "ocean" and the land underlying surface using observation data from Fujian coastal wind profile radar. The results showed that there was a significant separation between the thermodynamic boundary layer height and the dynamic boundary layer height inverted by sounding radar data, and the maximum tangential wind speed height (Hvtmax) and inflow layer height (Hinflow) inverted by wind profile radar wind field data has high reliability in clear sky weather, and can only qualitatively reflect the characteristics of the typhoon boundary layer under rainfall conditions. In the outer rain belt of Typhoon Meranti (200-100 km from the center of the typhoon), the Hvtmax of the "ocean" surface is located below the Hinflow, in the outer clear sky (600-400 km from the center of the typhoon), the Hvtmax and Hinflow of the "ocean" surface is at the same height level, while the Hvtmax of the land surface is always located above the Hinflow affected by the frictional effect, the tangential wind speed of the land underground surface is smaller than that of the "ocean" underlying surface, and the Hvtmax of the land underground surface is higher than the Hvtmax of the "ocean" underground surface. In addition, on the periphery of Typhoon Meranti, turbulent activity on the underlying surface of the "ocean" is mainly distributed in or below the Hinflow; And the turbulent activity on the underlying surface of the land is stronger, mainly distributed between Hvtmax and Hinflow, there are more complex turbulent activities near the top of typhoon boundary layer. So, It can be seen that different underlying surfaces form different structural distribution characteristics of the typhoon boundary layer, these results hope to provide useful information for evaluating and improving the boundary layer scheme in the typhoon model.
-

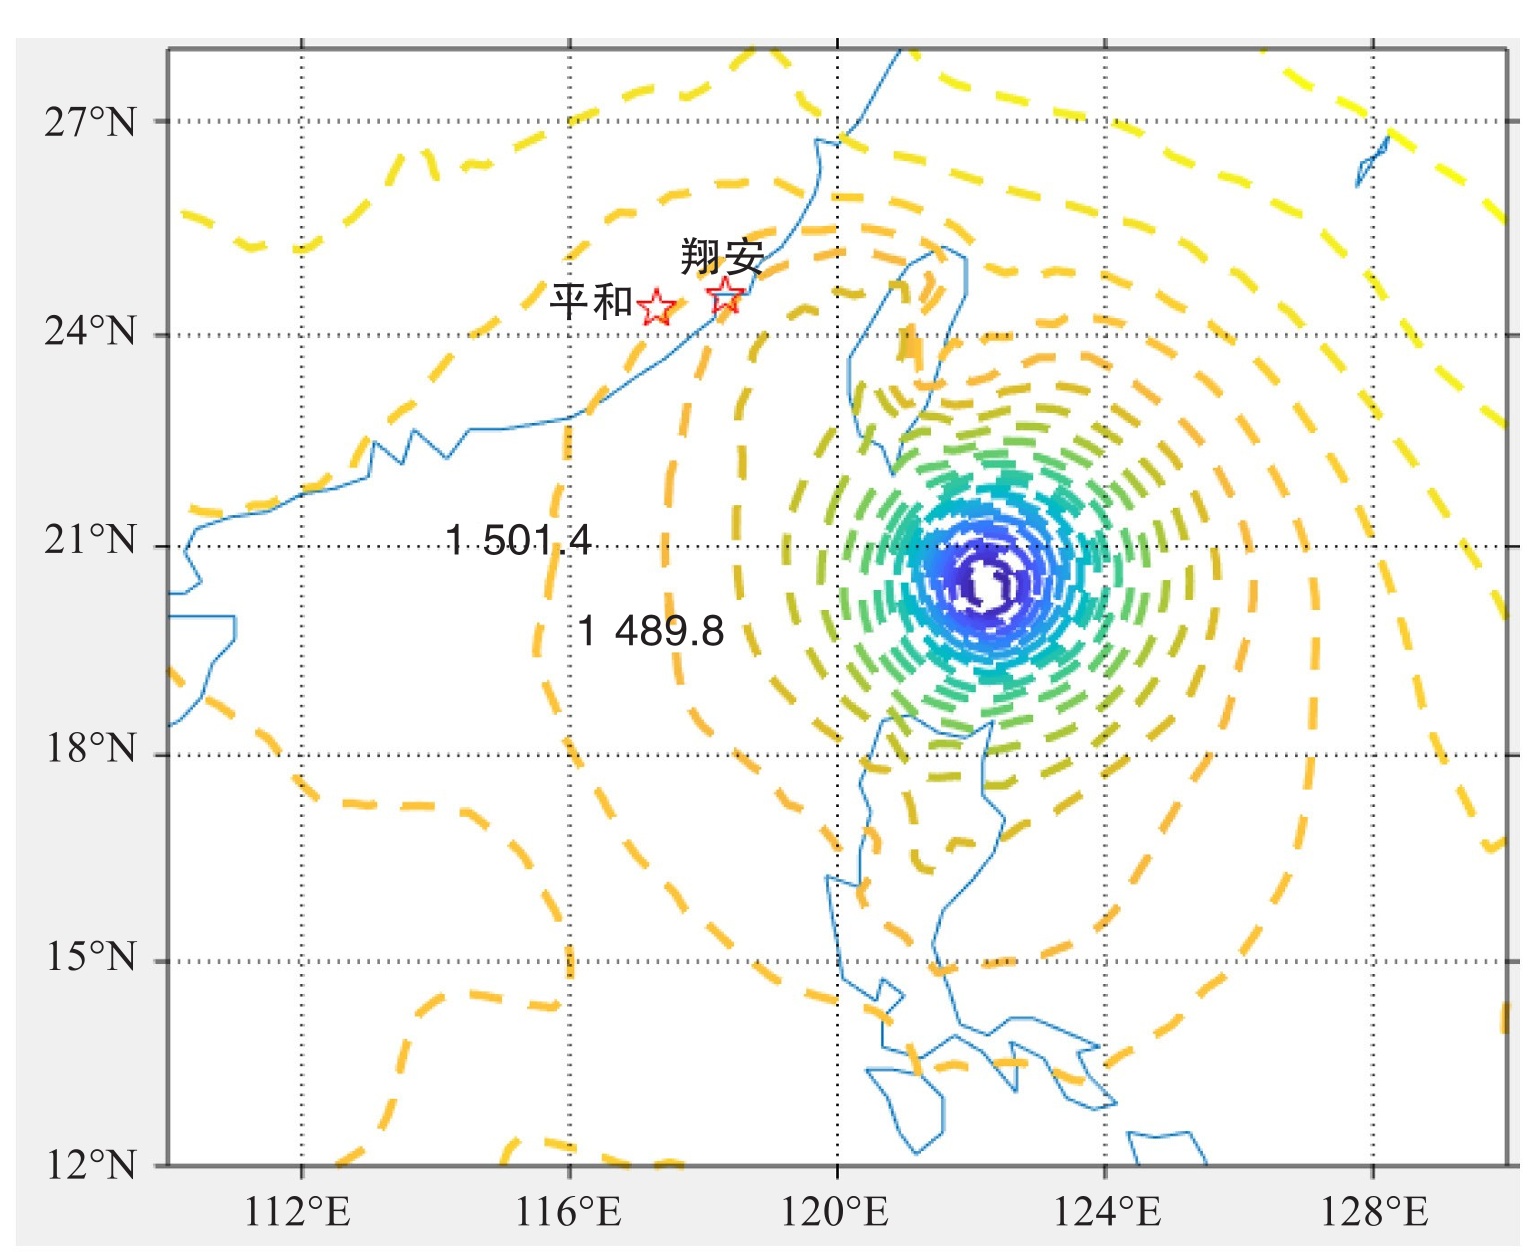
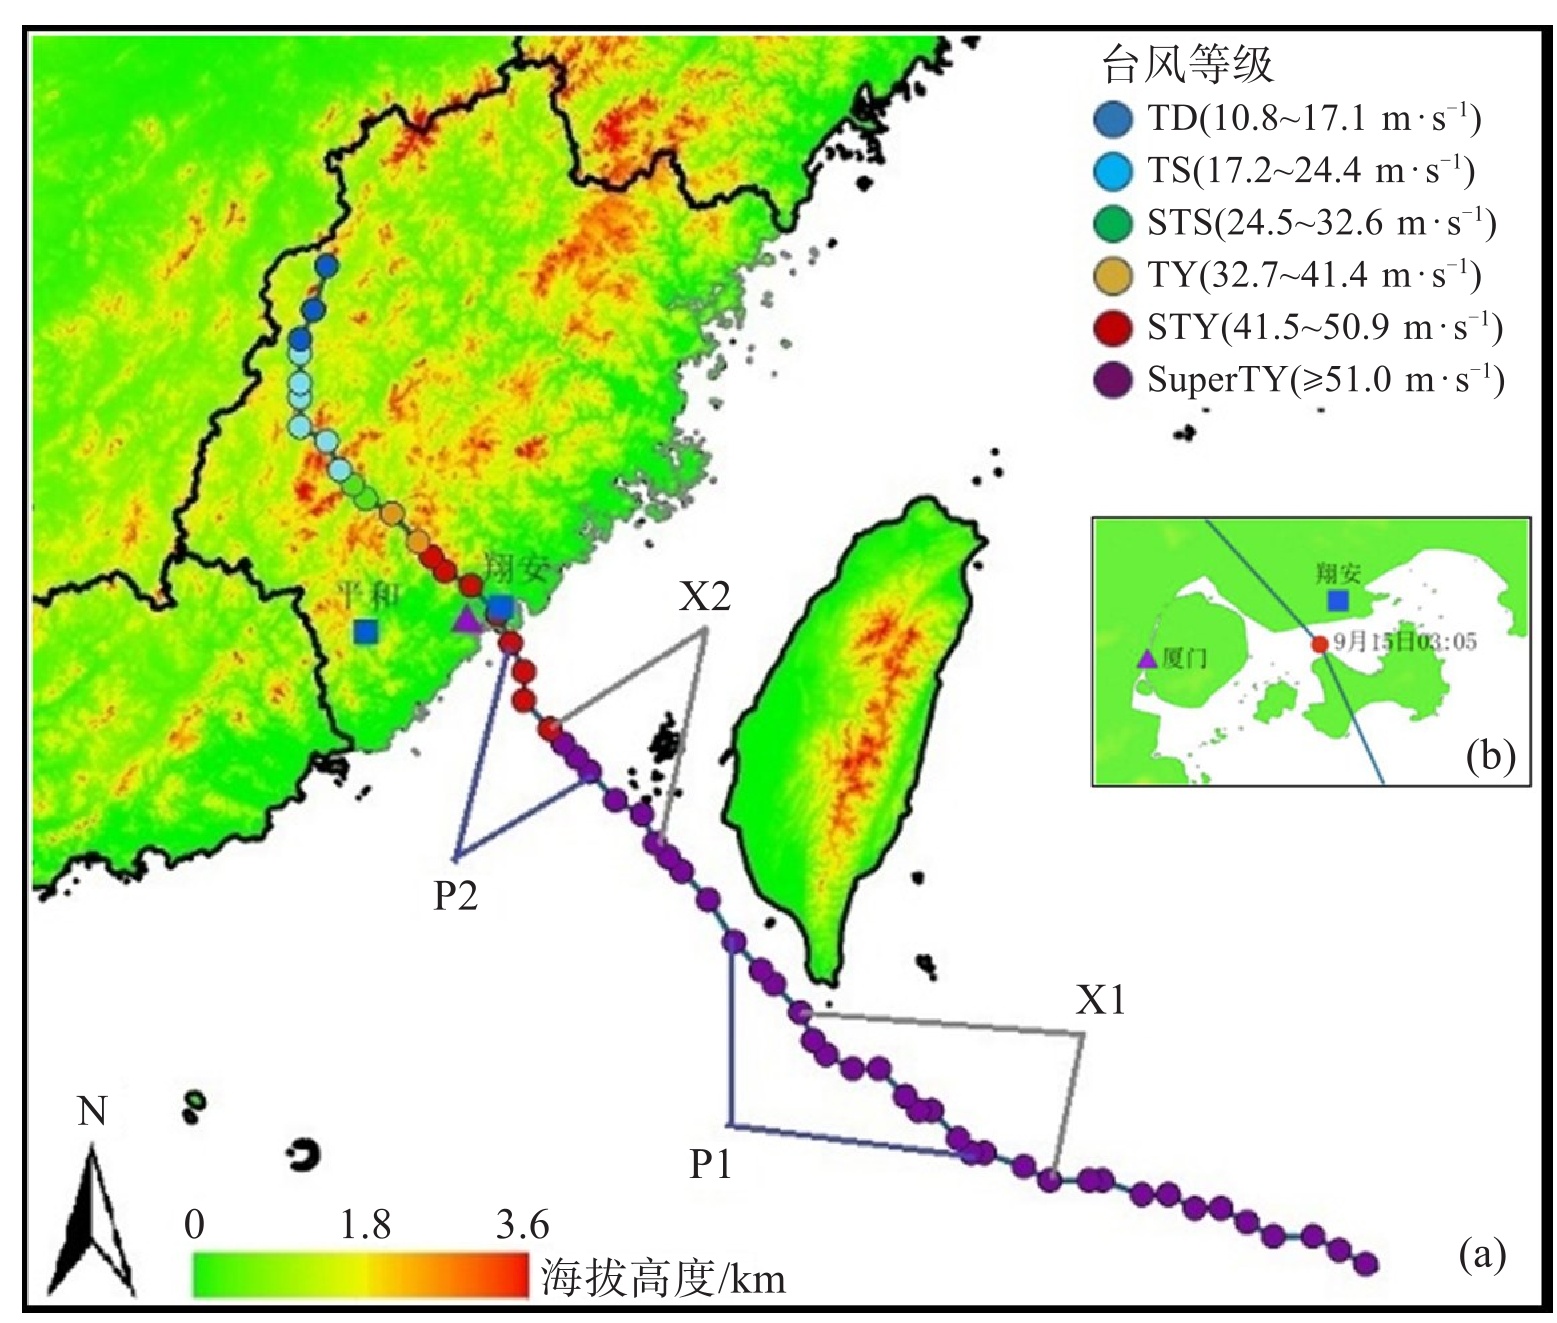
图 1 超强台风莫兰蒂移动路径和站点分布
蓝色方形表示风廓线雷达所在位置,紫色三角形表示气球探空雷达和天气雷达所在位置,地形地图用红绿填色(单位:km),台风等级划分采用国家标准(GB/T 19201-2006),X1和X2分别为翔安站选取的台风外围晴空和外雨带时段,P1和P2分别为平和站选取的台风外围晴空和外雨带时段,b是a中台风登陆点的局部放大区域子图。

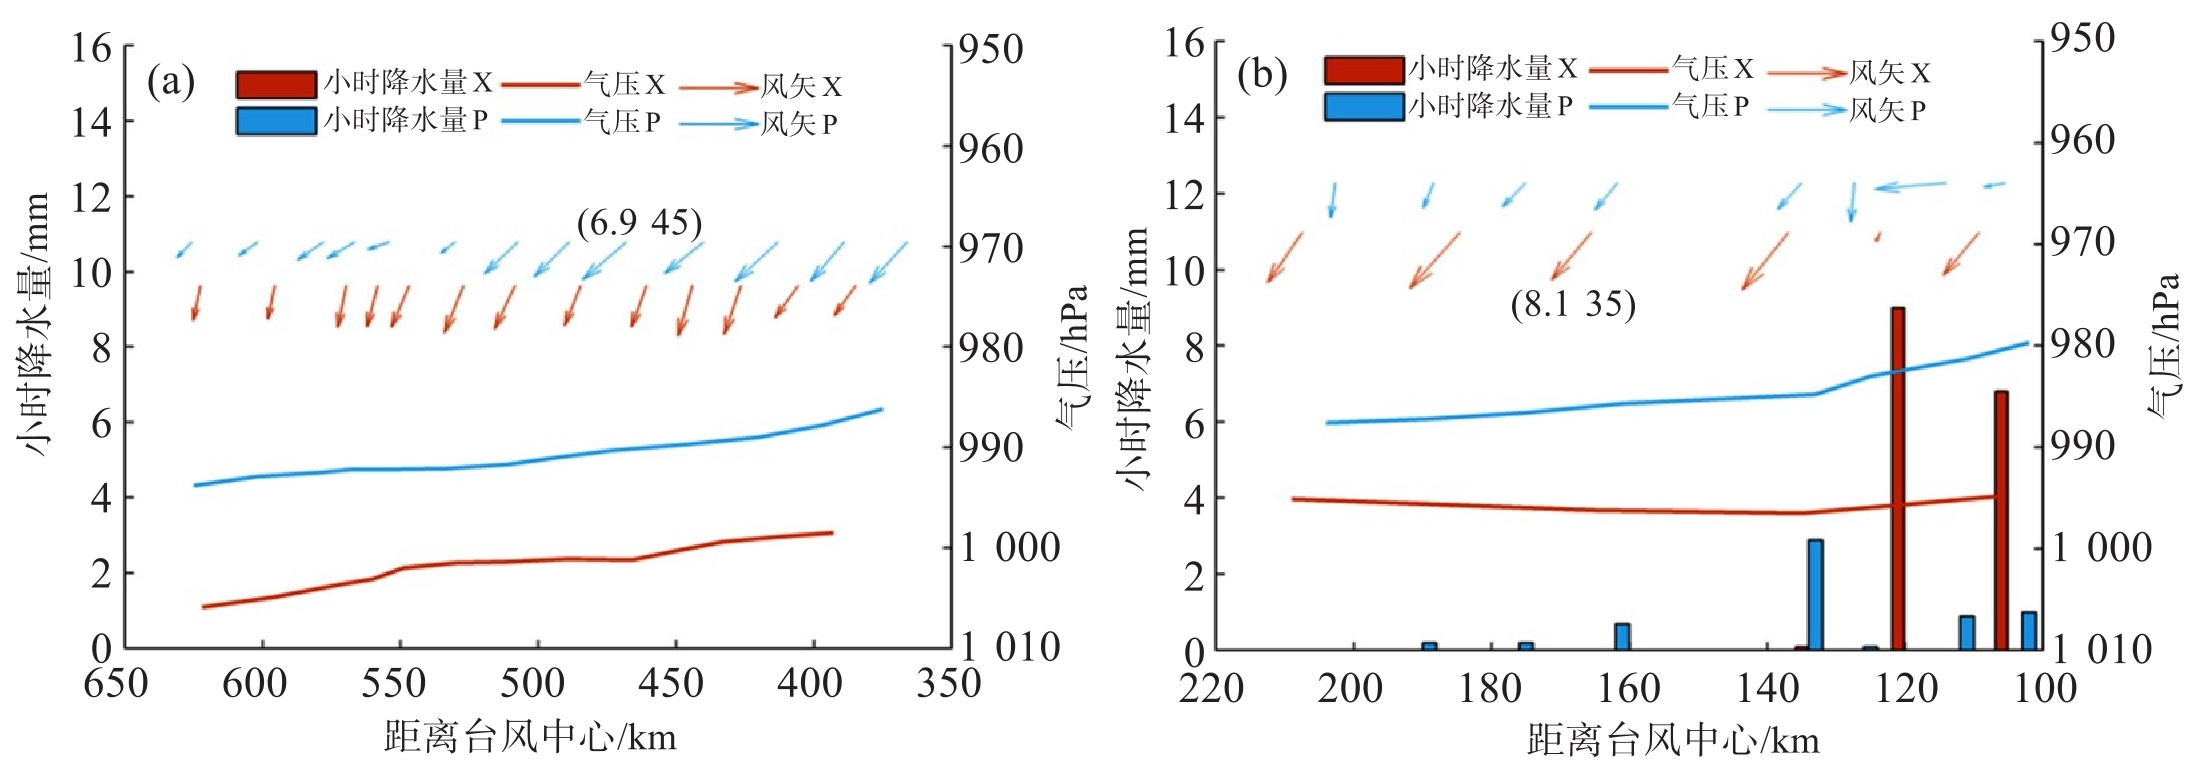
图 2 X1时段翔安(红色)和P1时段平和(蓝色)地面自动站观测水平风(风矢)、小时降水量和气压(a);X2时段翔安(红色)和P2时段平和(蓝色)地面自动站观测水平风(风矢)、小时降水量和气压(b)
图例中“X”表示翔安站,“P”表示平和站。

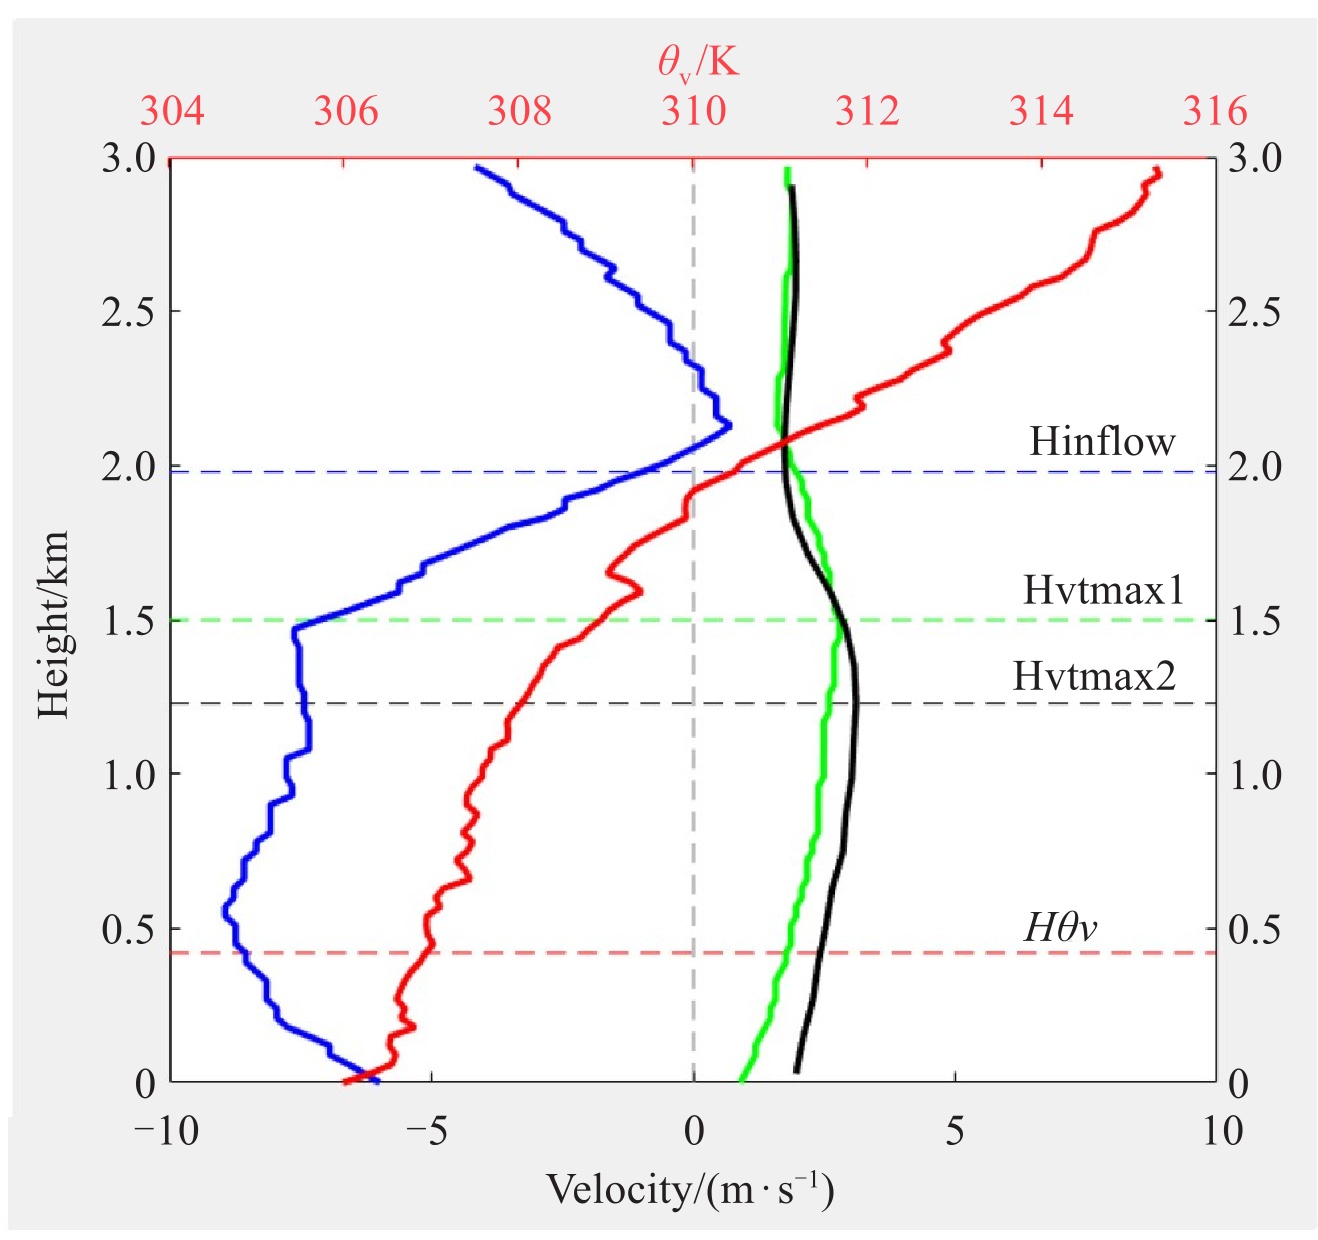
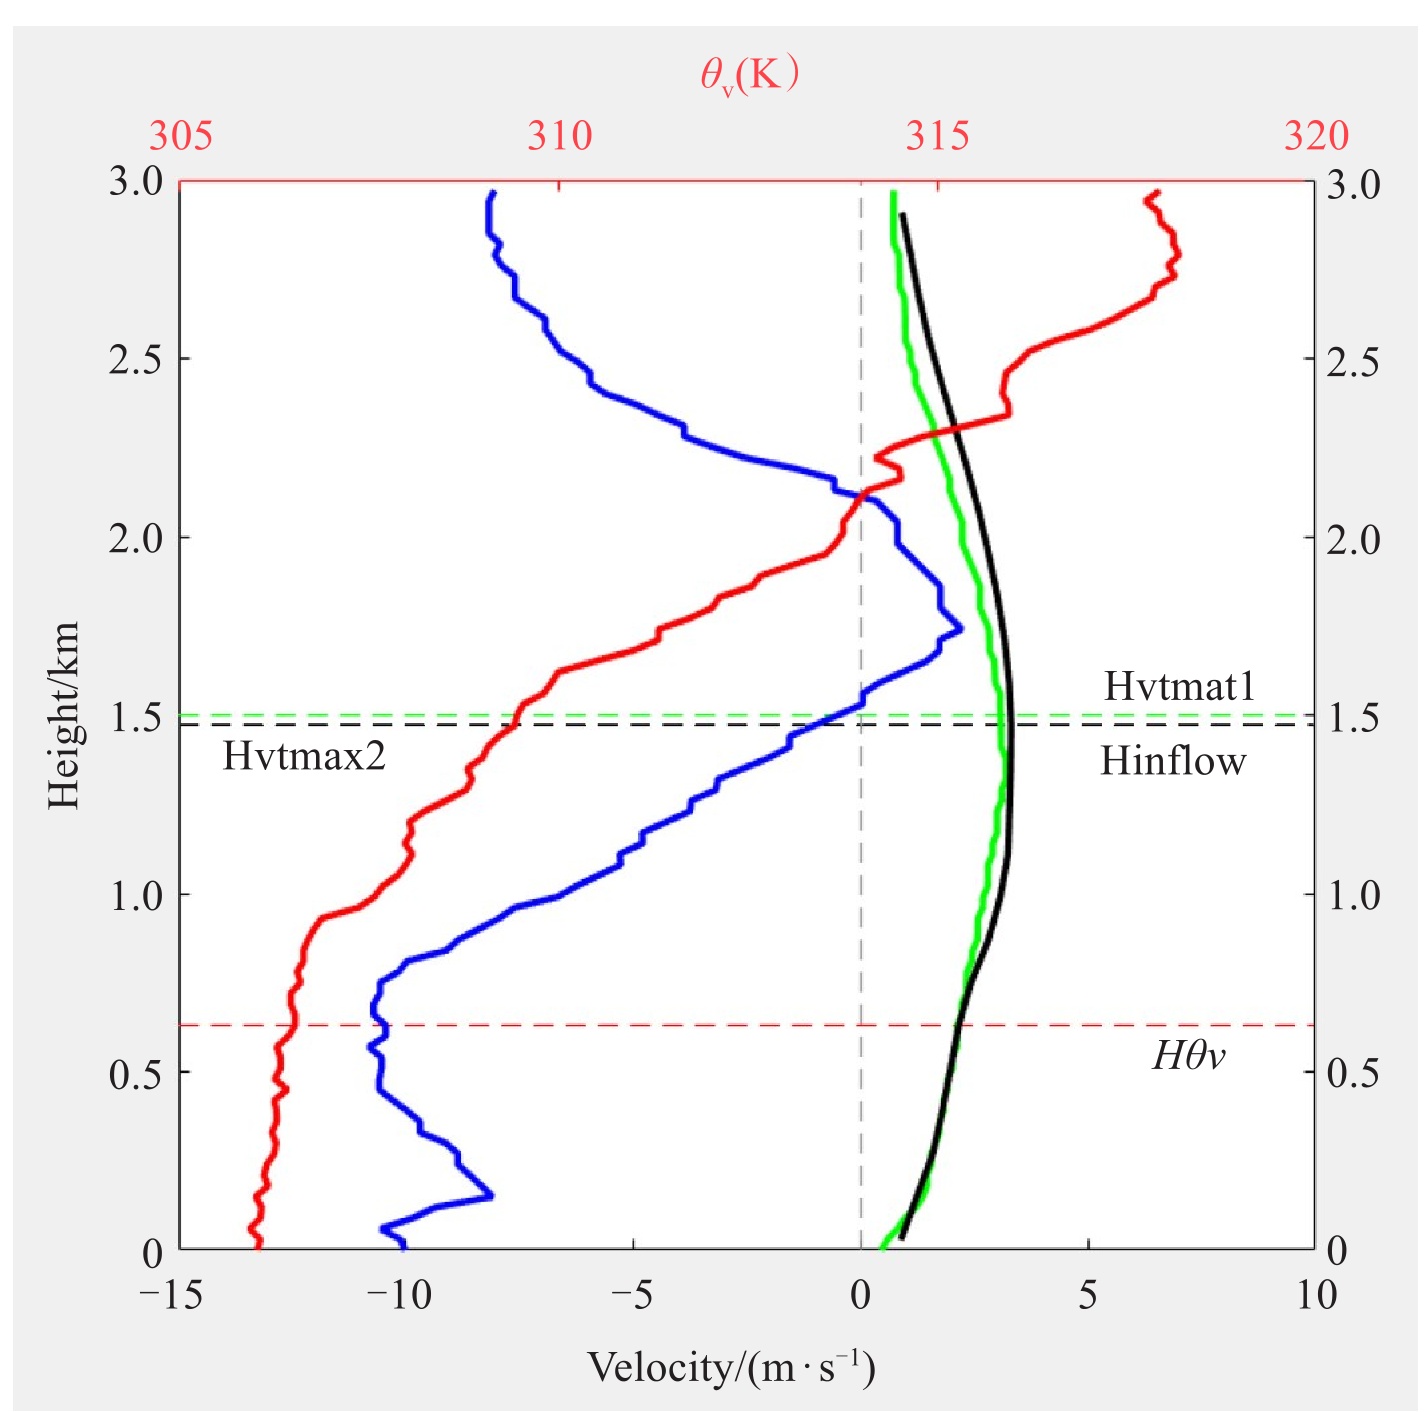
图 5 9月14日19:15气球探空径向风、切向风和虚位温曲线
其中径向风为蓝色实线、气球探空和风廓线雷达切向风风速放大了0.1倍显示为绿色和黑色实线、虚位温为红色实线,对应的蓝色虚线Hinflow为入流层高度、绿色和黑色虚线Hvtmax1、Hvtmax2分别为气球探空和风廓线雷达最大切向风速高度、红色虚线Hθv为混合层高度。

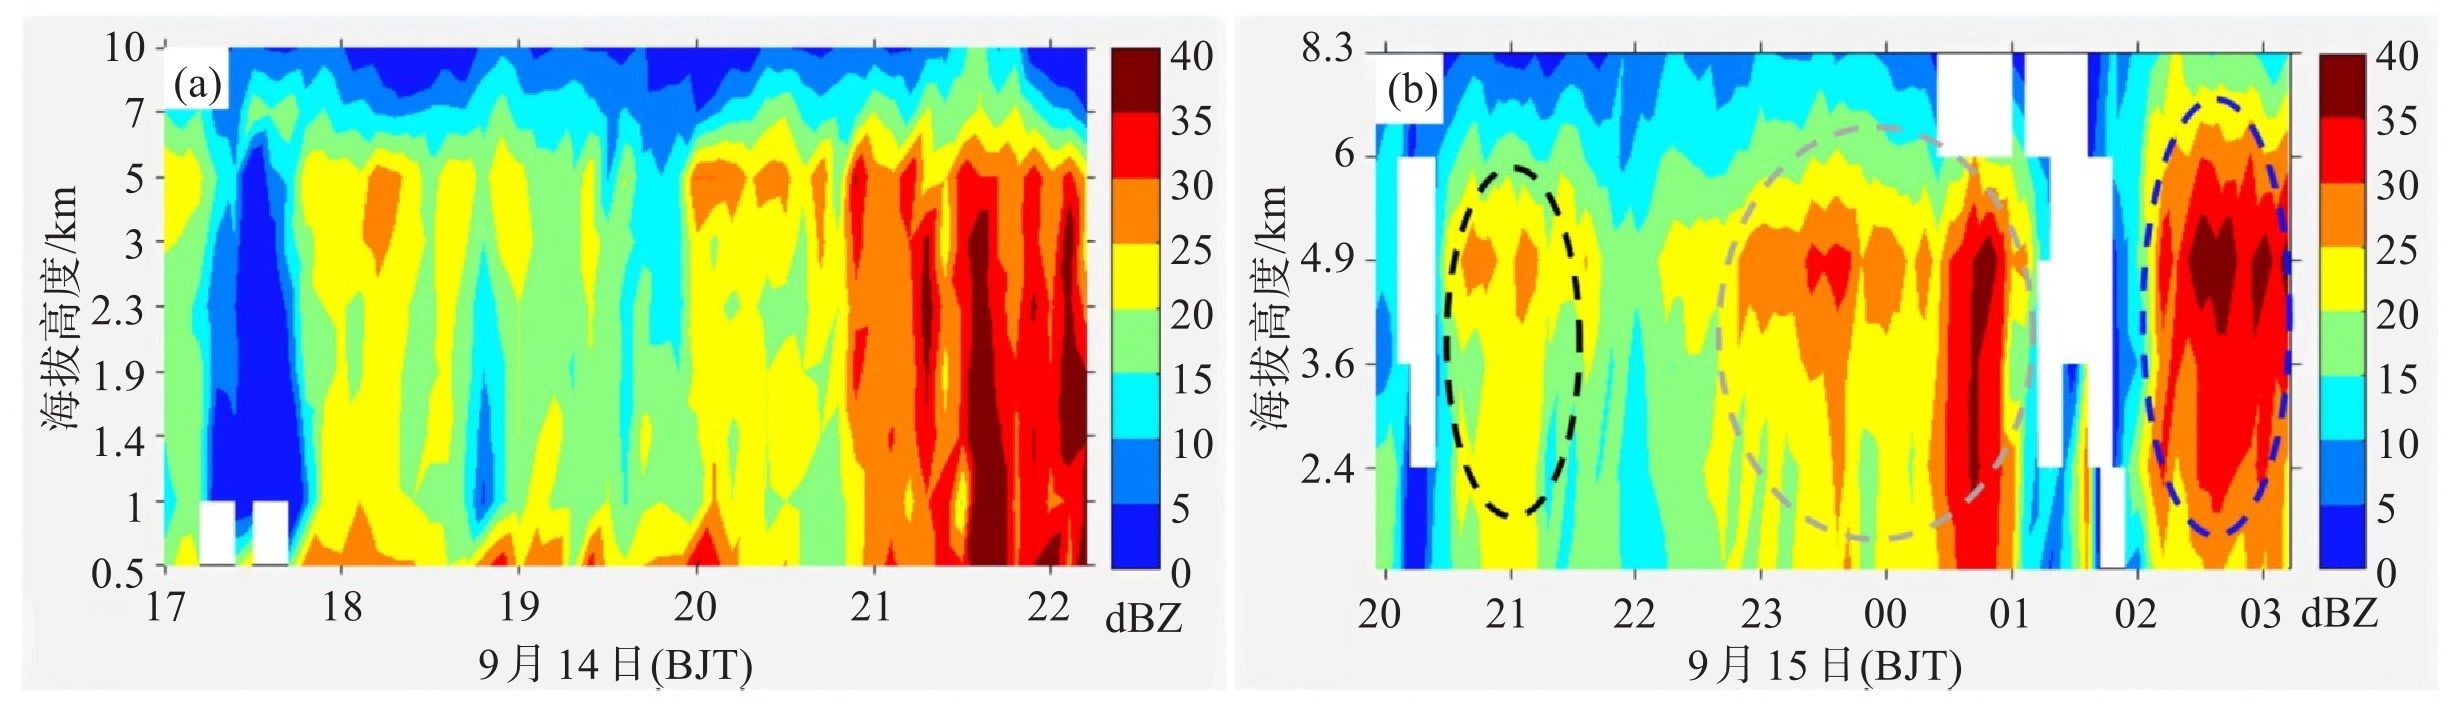
图 6 X2时段翔安站上空雷达反射率(a)和P2时段平和站上空天气雷达反射率(b)的垂直分布
横坐标表示整点时刻,纵坐标表示海拔高度,色标表示天气雷达反射率,单位:dBZ,黑、灰、蓝色椭圆表示三个雨带过程。
表 1 CFL-06型风廓线雷达主要探测性能参数
CFL-06型风廓线雷达主要探测性能参数 发射频率/MHz 1 280 探测波束 5波束 发射峰值功率/kw ≥6 水平风速测量误差/(m·s-1) ≤1.0(RMS) 起始探测高度/m 150 水平风向测量误差/° ≤10(RMS) 最大探测高度/km ≥6 风速分辨率/(m·s-1) 0.2 低模高度分辨率/m 120(≤4 km) 风向分辨率/° 0.5 高模高度分辨率/m 240(≥4 km) 产品时间分辨率/min 6  下载: 导出CSV
表 2 台风莫兰蒂四个时段UW-UE和VS-VN统计结果
时段 dU=Uw-UE dV=Vs-VN 样本数 平均差/(m·s-1) 标准差/(m·s-1) 平均差/(m·s-1) 标准差/(m·s-1) X1 -0.40 1.21 -0.46 1.33 5 302 P1 -0.16 1.05 -0.15 1.25 5 276 X2 3.35 2.23 3.37 2.11 2 218 P2 3.18 2.31 3.23 2.28 3 076
下载: 导出CSV
-
[1] Wurman J, Winslow J. Intense sub-kilometer-scale boundary layer rolls observed in Hurricane Fran[J]. Science, 1998, 280(5363): 555-557. [2] Alford A A, Biggerstaff M I, Carrie G D, et al. Near-surface maximum winds during the landfall of Hurricane Harvey[J]. Geophysical Research Letters, 2019, 46(2): 973-982. [3] Elliott W P. The growth of the atmospheric internal boundary layer[J]. Eos Transactions American Geophysical Union, 1958, 39(6): 1048-1054. [4] Garratt J R. The internal boundary layer—A review[J]. Boundary-Layer Meteorology, 1990, 50(1): 171-203. [5] Tang X D, Tan Z M. Boundary-layer wind structure in a landfalling tropical cyclone[J]. Advances in Atmospheric Sciences, 2006, 23(5): 737-749. [6] Hirth B D, Schroeder J L, Weiss C C, et al. Research radar analyses of the internal boundary layer over cape canaveral, Florida, during the landfall of Hurricane Frances (2004)[J]. Weather and Forecasting, 2012, 27(6): 1349-1372. [7] Williams G J. Idealized simulations of the inner core boundary layer structure in a landfalling tropical cyclone. Part Ⅰ: Kinematic structure [J]. Tropical Cyclone Research and Review, 2019, 8(2): 47-67. [8] Zhang J A, Rogers R F, Nolan D S, et al. On the characteristic height scales of the hurricane boundary layer[J]. Monthly Weather Review, 2011, 139(8): 2523-2535. [9] Ren Y F, Zhang J A, Guimond S R, et al. Hurricane boundary layer height relative to storm motion from GPS dropsonde composites[J]. Atmosphere, 2019, 10(6): 339. [10] Ming J, Zhang J A, Rogers R F. Typhoon kinematic and thermodynamic boundary layer structure from dropsonde composites[J]. Journal of Geophysical Research: Atmospheres, 2015, 120(8): 3158-3172. [11] 蔡晓冬, 明杰, 王元. 基于下投式探空仪资料的超强台风蔷薇(2008)动力和热力结构特征分析[J]. 地球物理学报, 2019, 62(3): 825-835. [12] Giammanco I M, Schroeder J L, Powell M D. GPS dropwindsonde and WSR-88D observations of tropical cyclone vertical wind profiles and their characteristics[J]. Weather and Forecasting, 2013, 28(1): 77-99. [13] Bryan G H, Rotunno R. The maximum intensity of tropical cyclones in axisymmetric numerical model simulations[J]. Monthly Weather Review, 2009, 137(6): 1770-1789. [14] Nolan D S, Zhang J A, Stern D P. Evaluation of planetary boundary layer parameterizations in tropical cyclones by comparison of in situ observations and high-resolution simulations of Hurricane Isabel (2003). Part Ⅰ: Initialization, maximum winds, and the outer-core boundary layer[J]. Monthly Weather Review, 2009, 137(11): 3651-3674. [15] Nolan D S, Stern D P, Zhang J A. Evaluation of planetary boundary layer parameterizations in tropical cyclones by comparison of in situ observations and high-resolution simulations of Hurricane Isabel (2003). Part Ⅱ: Inner-core boundary layer and eyewall structure[J]. Monthly Weather Review, 2009, 137(11): 3675-3698. [16] 马秀梅. 我国登陆台风边界层风场结构和演变特征的多普勒雷达分析[D]. 南京: 南京大学, 2014. [17] Alford A A, Zhang J A, Biggerstaff M I, et al. Transition of the Hurricane Boundary Layer during the Landfall of Hurricane Irene (2011)[J]. Journal of the Atmospheric Sciences, 2020, 77(10): 3509-3531. [18] 王叶红, 赵玉春, 罗昌荣, 等. 双雷达风场反演拼图在登陆台风"莫兰蒂"(1614)强降水精细预报中的同化应用试验[J]. 气象学报, 2019, 77(4): 617-644. [19] 陈德花, 张玲, 张伟, 等. "莫兰蒂"台风致灾大风的结构特征及成因[J]. 大气科学学报, 2018, 41(5): 692-701. [20] 马孝林, 王举, 黄泓, 等. 台风"莫兰蒂"登陆前后微物理特征研究[J]. 气象科学, 2022, 42(6): 730-741. [21] 吴蕾, 陈洪滨, 康雪. 风廓线雷达与L波段雷达探空测风对比分析[J]. 气象科技, 2014, 42(2): 225-230. [22] 郭运, 汤胜茗, 王旭, 等. 不同台风降水强度下风廓线雷达适用性研究[J]. 热带气象学报, 2021, 37(2): 268-276. [23] 李平, 徐枝芳, 范广洲, 等. 探空温度资料质量控制技术研究[J]. 气象, 2013, 39(12): 1626-1634. [24] 汪学渊, 汪澜, 郑陈婷, 等. 超强台风"莫兰蒂"(1614)边界层结构的风廓线雷达观测分析[J]. 热带气象学报, 2024, 40(3): 352-361. [25] 廖菲, 邓华, 李旭. 基于风廓线雷达的广东登陆台风边界层高度特征研究[J]. 大气科学, 2017, 41(5): 949-959. [26] 张梦佳, 沈学顺, 何平, 等. 基于风廓线仪的华南地区夏季边界层湍流统计特征研究[J]. 热带气象学报, 2018, 34(4): 535-545. [27] Hogan R J, Grant A L M, Illingworth A J, et al. Vertical velocity variance and skewness in clear and cloud-topped boundary layers as revealed by Doppler lidar[J]. Quarterly Journal of the Royal Meteorological Society, 2009, 135(640): 635-643. [28] Huang T, Yim S H, Yang Y J, et al. Observation of Turbulent Mixing Characteristics in the Typical Daytime Cloud-Topped Boundary Layer over Hong Kong in 2019[J]. Remote Sensing, 2020, 12(9): 1533. [29] Ming J, Zhang J A, Rogers R F, et al. Multiplatform observations of boundary layer structure in the outer rainbands of landfalling typhoons [J]. Journal of Geophysical Research: Atmospheres, 2014, 119(13): 7799-7814. [30] Zhang J A, Drennan W M, Black P G, et al. Turbulence structure of the hurricane boundary layer between the outer rainbands[J]. Journal of the Atmospheric Sciences, 2009, 66(8): 2455-2467. -

 点击查看大图
计量
- 文章访问数: 5
- HTML全文浏览量: 1
- PDF下载量: 1
- 被引次数: 0
 粤公网安备 4401069904700003号