



Applicability Analysis of ERA5 Sea Surface Temperature and Pressure Based on Voluntary Observing Ship Data
-
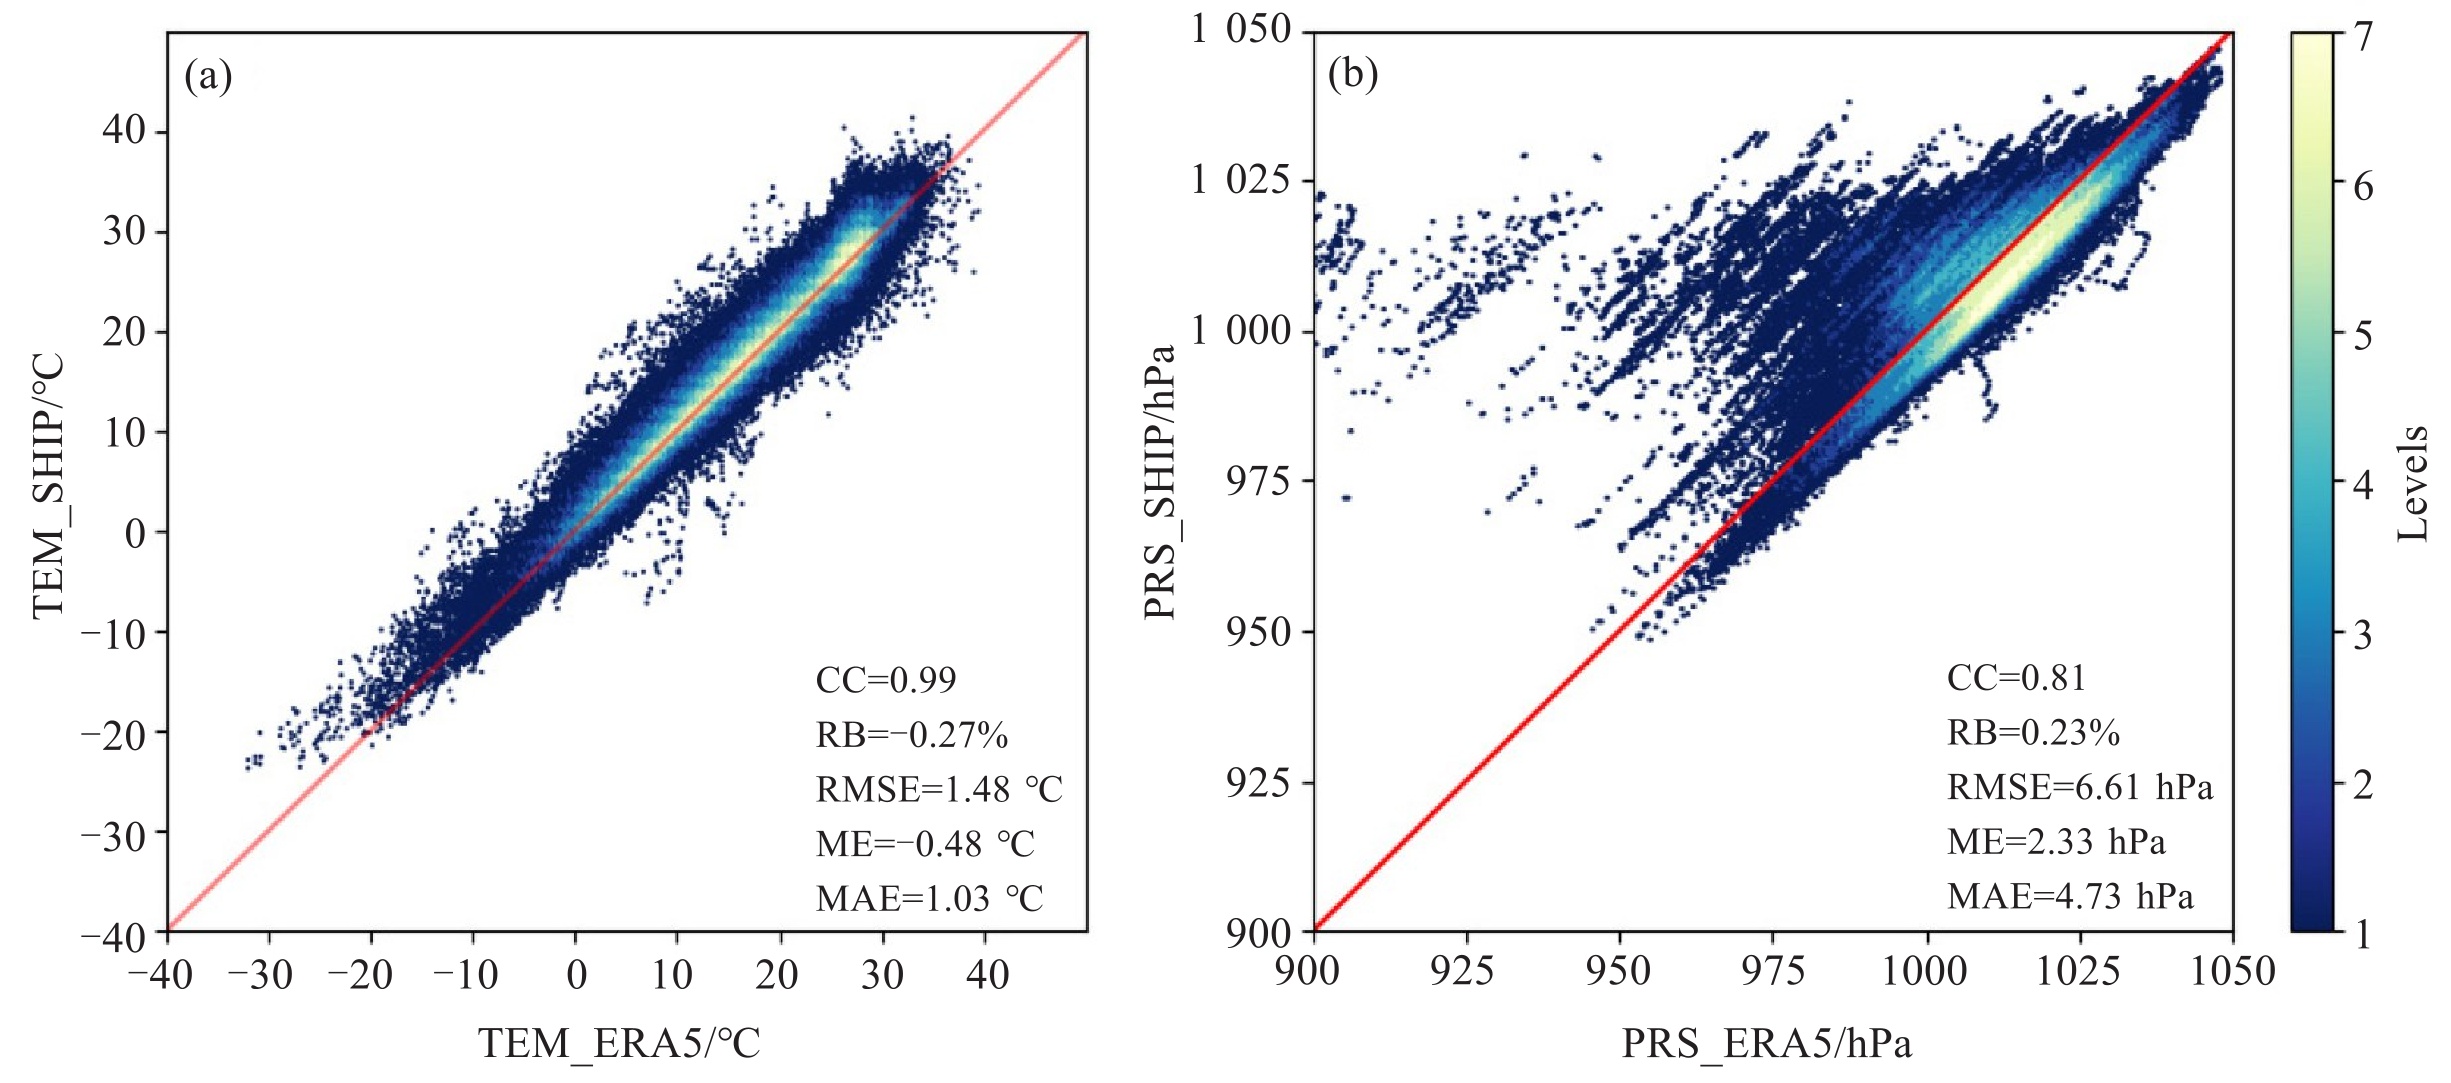
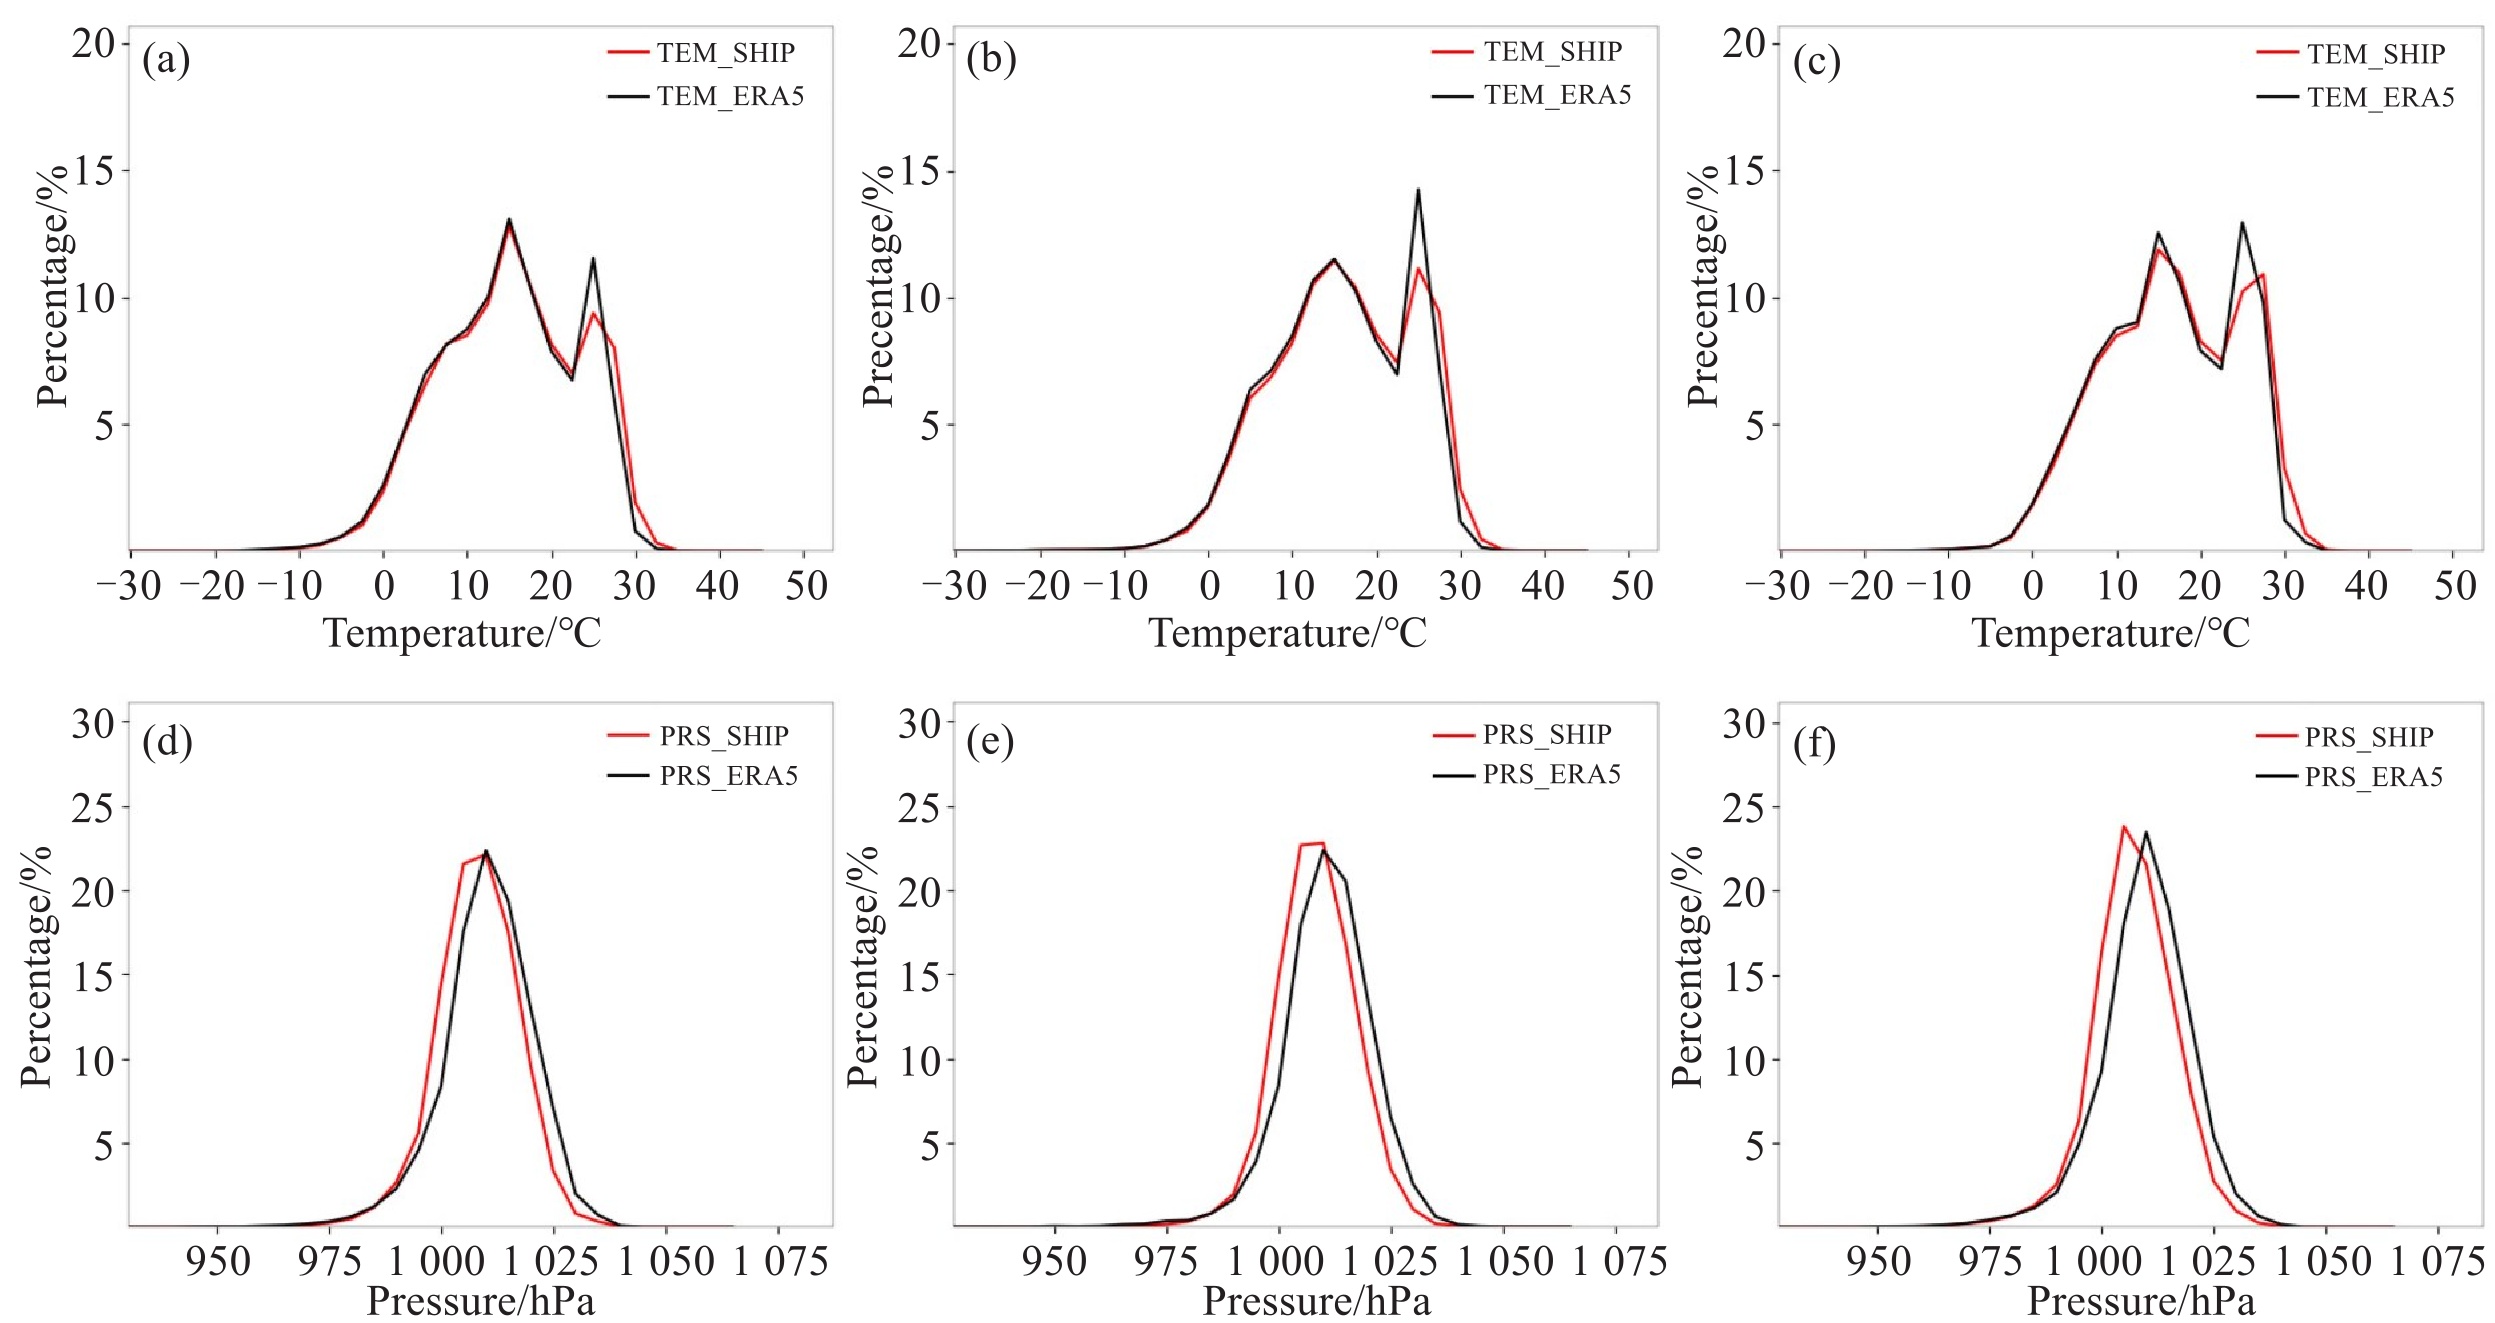
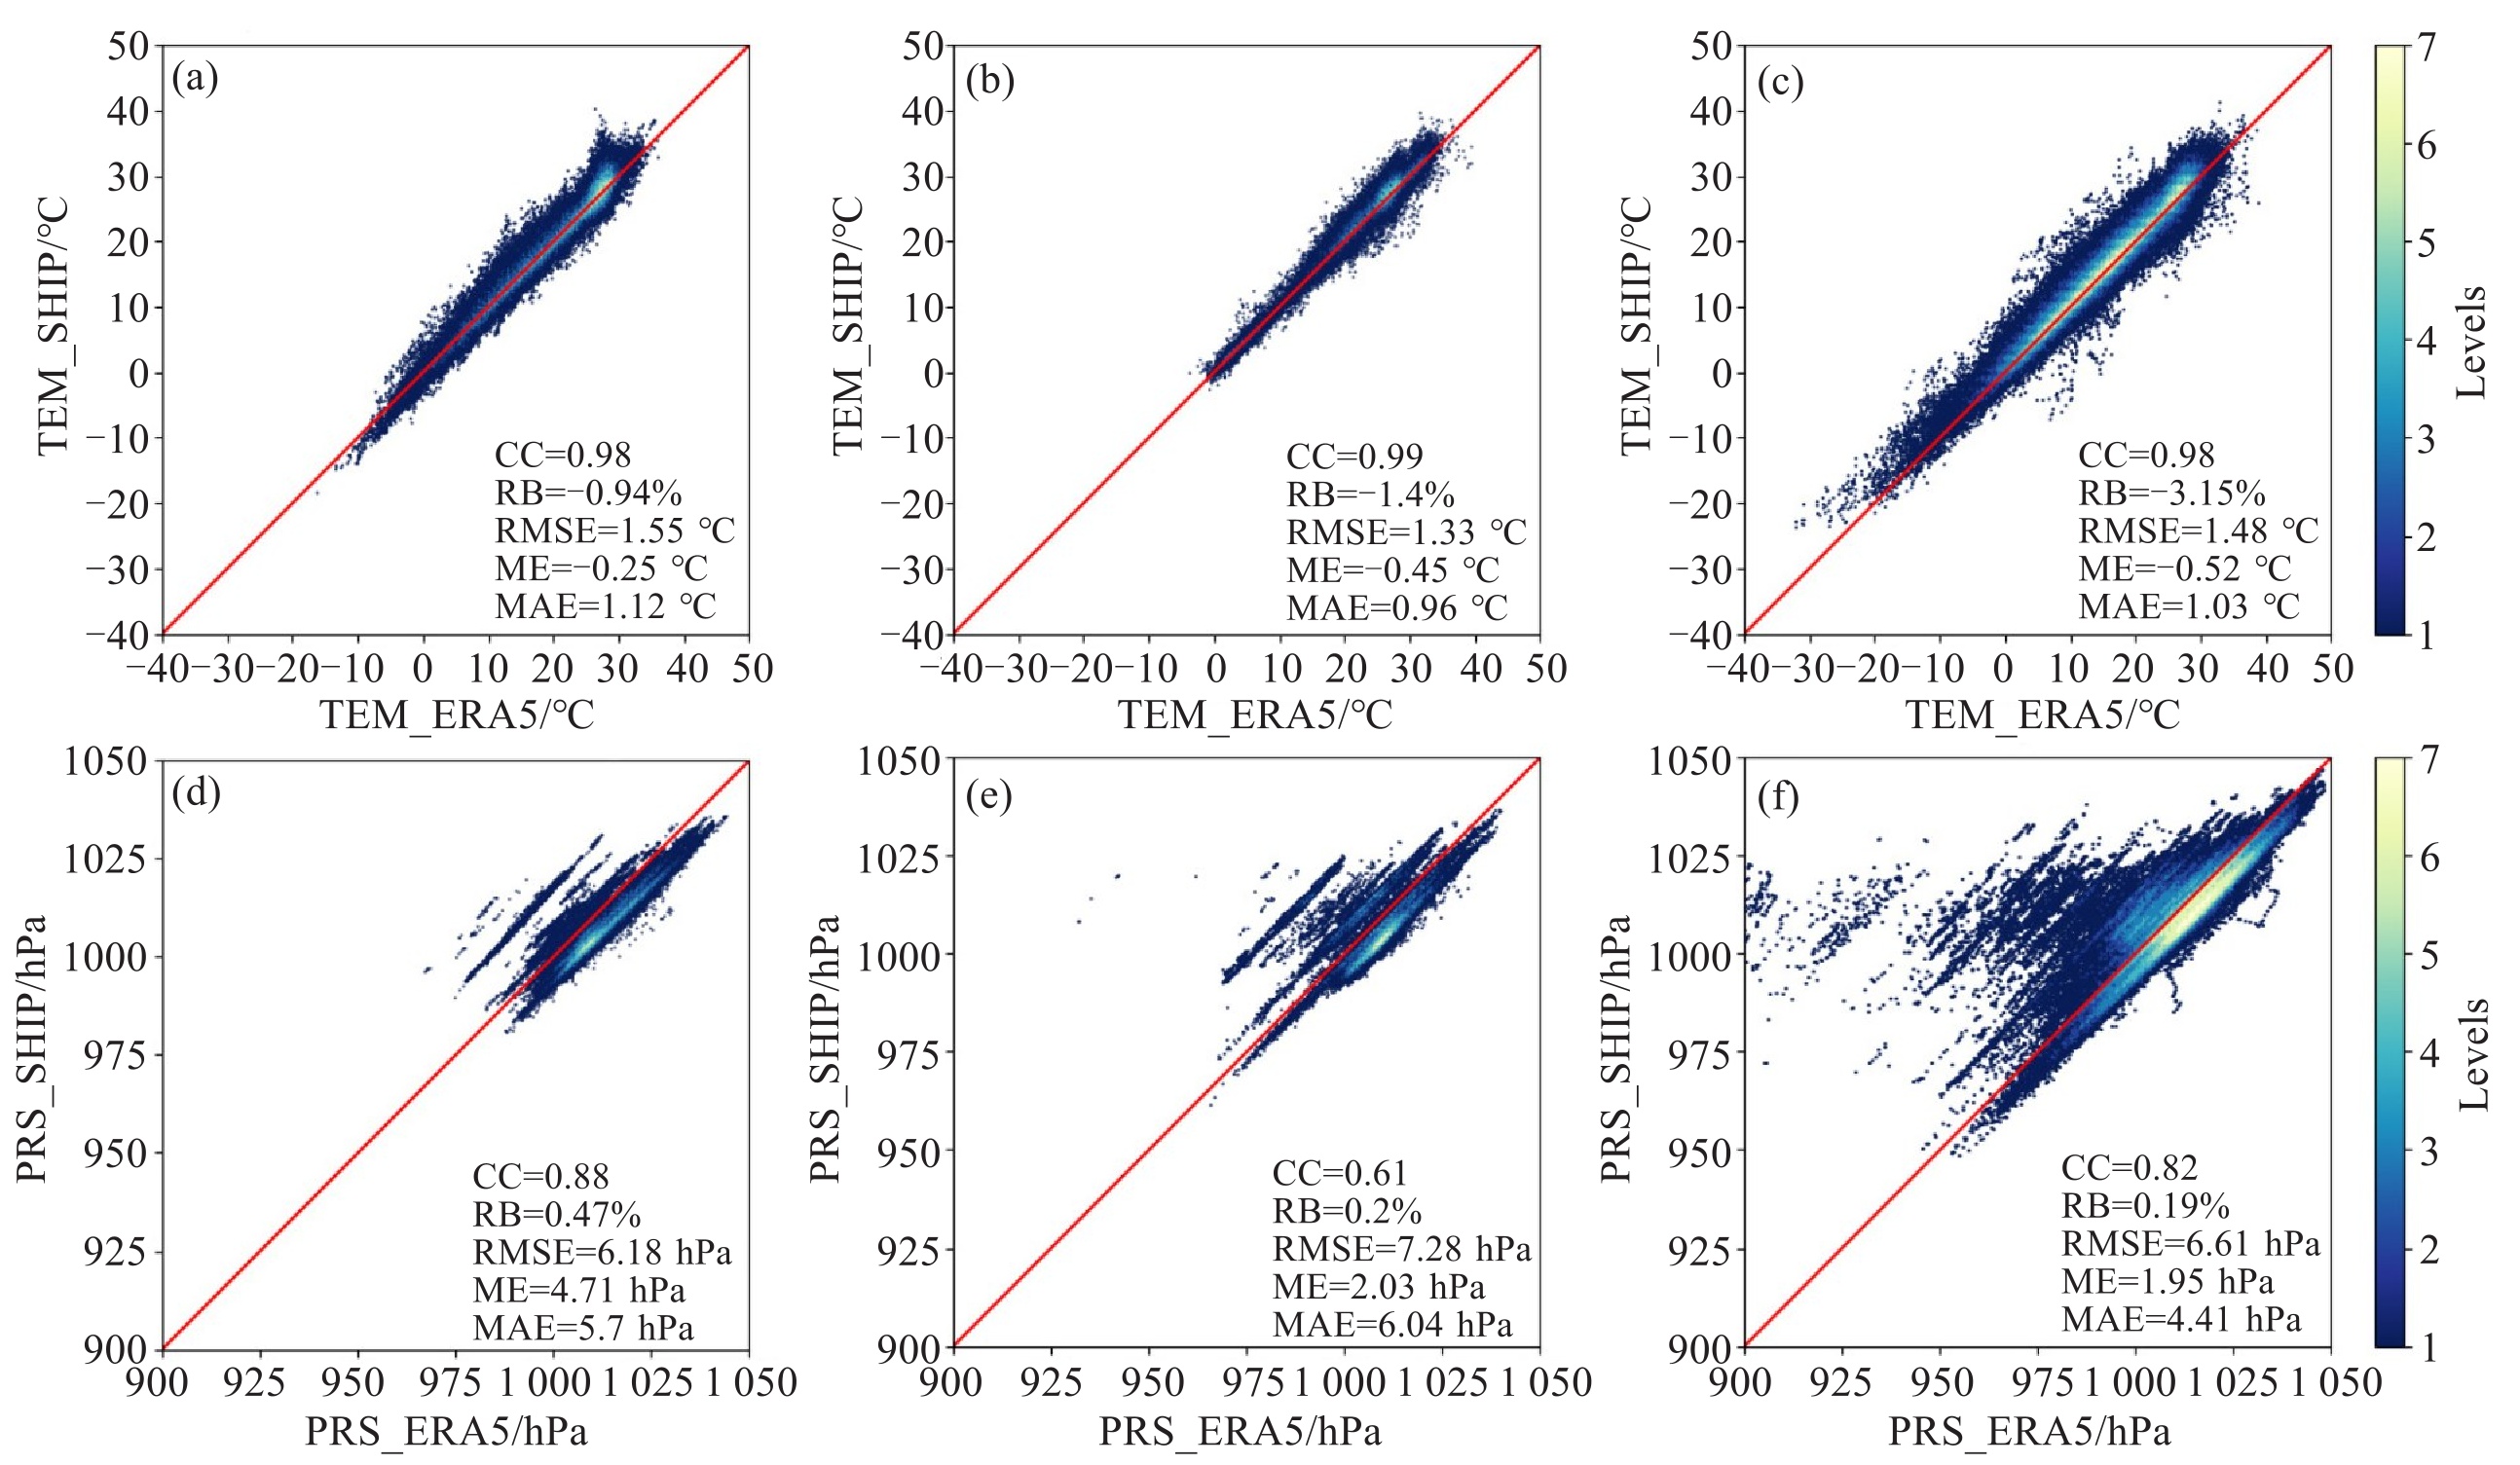
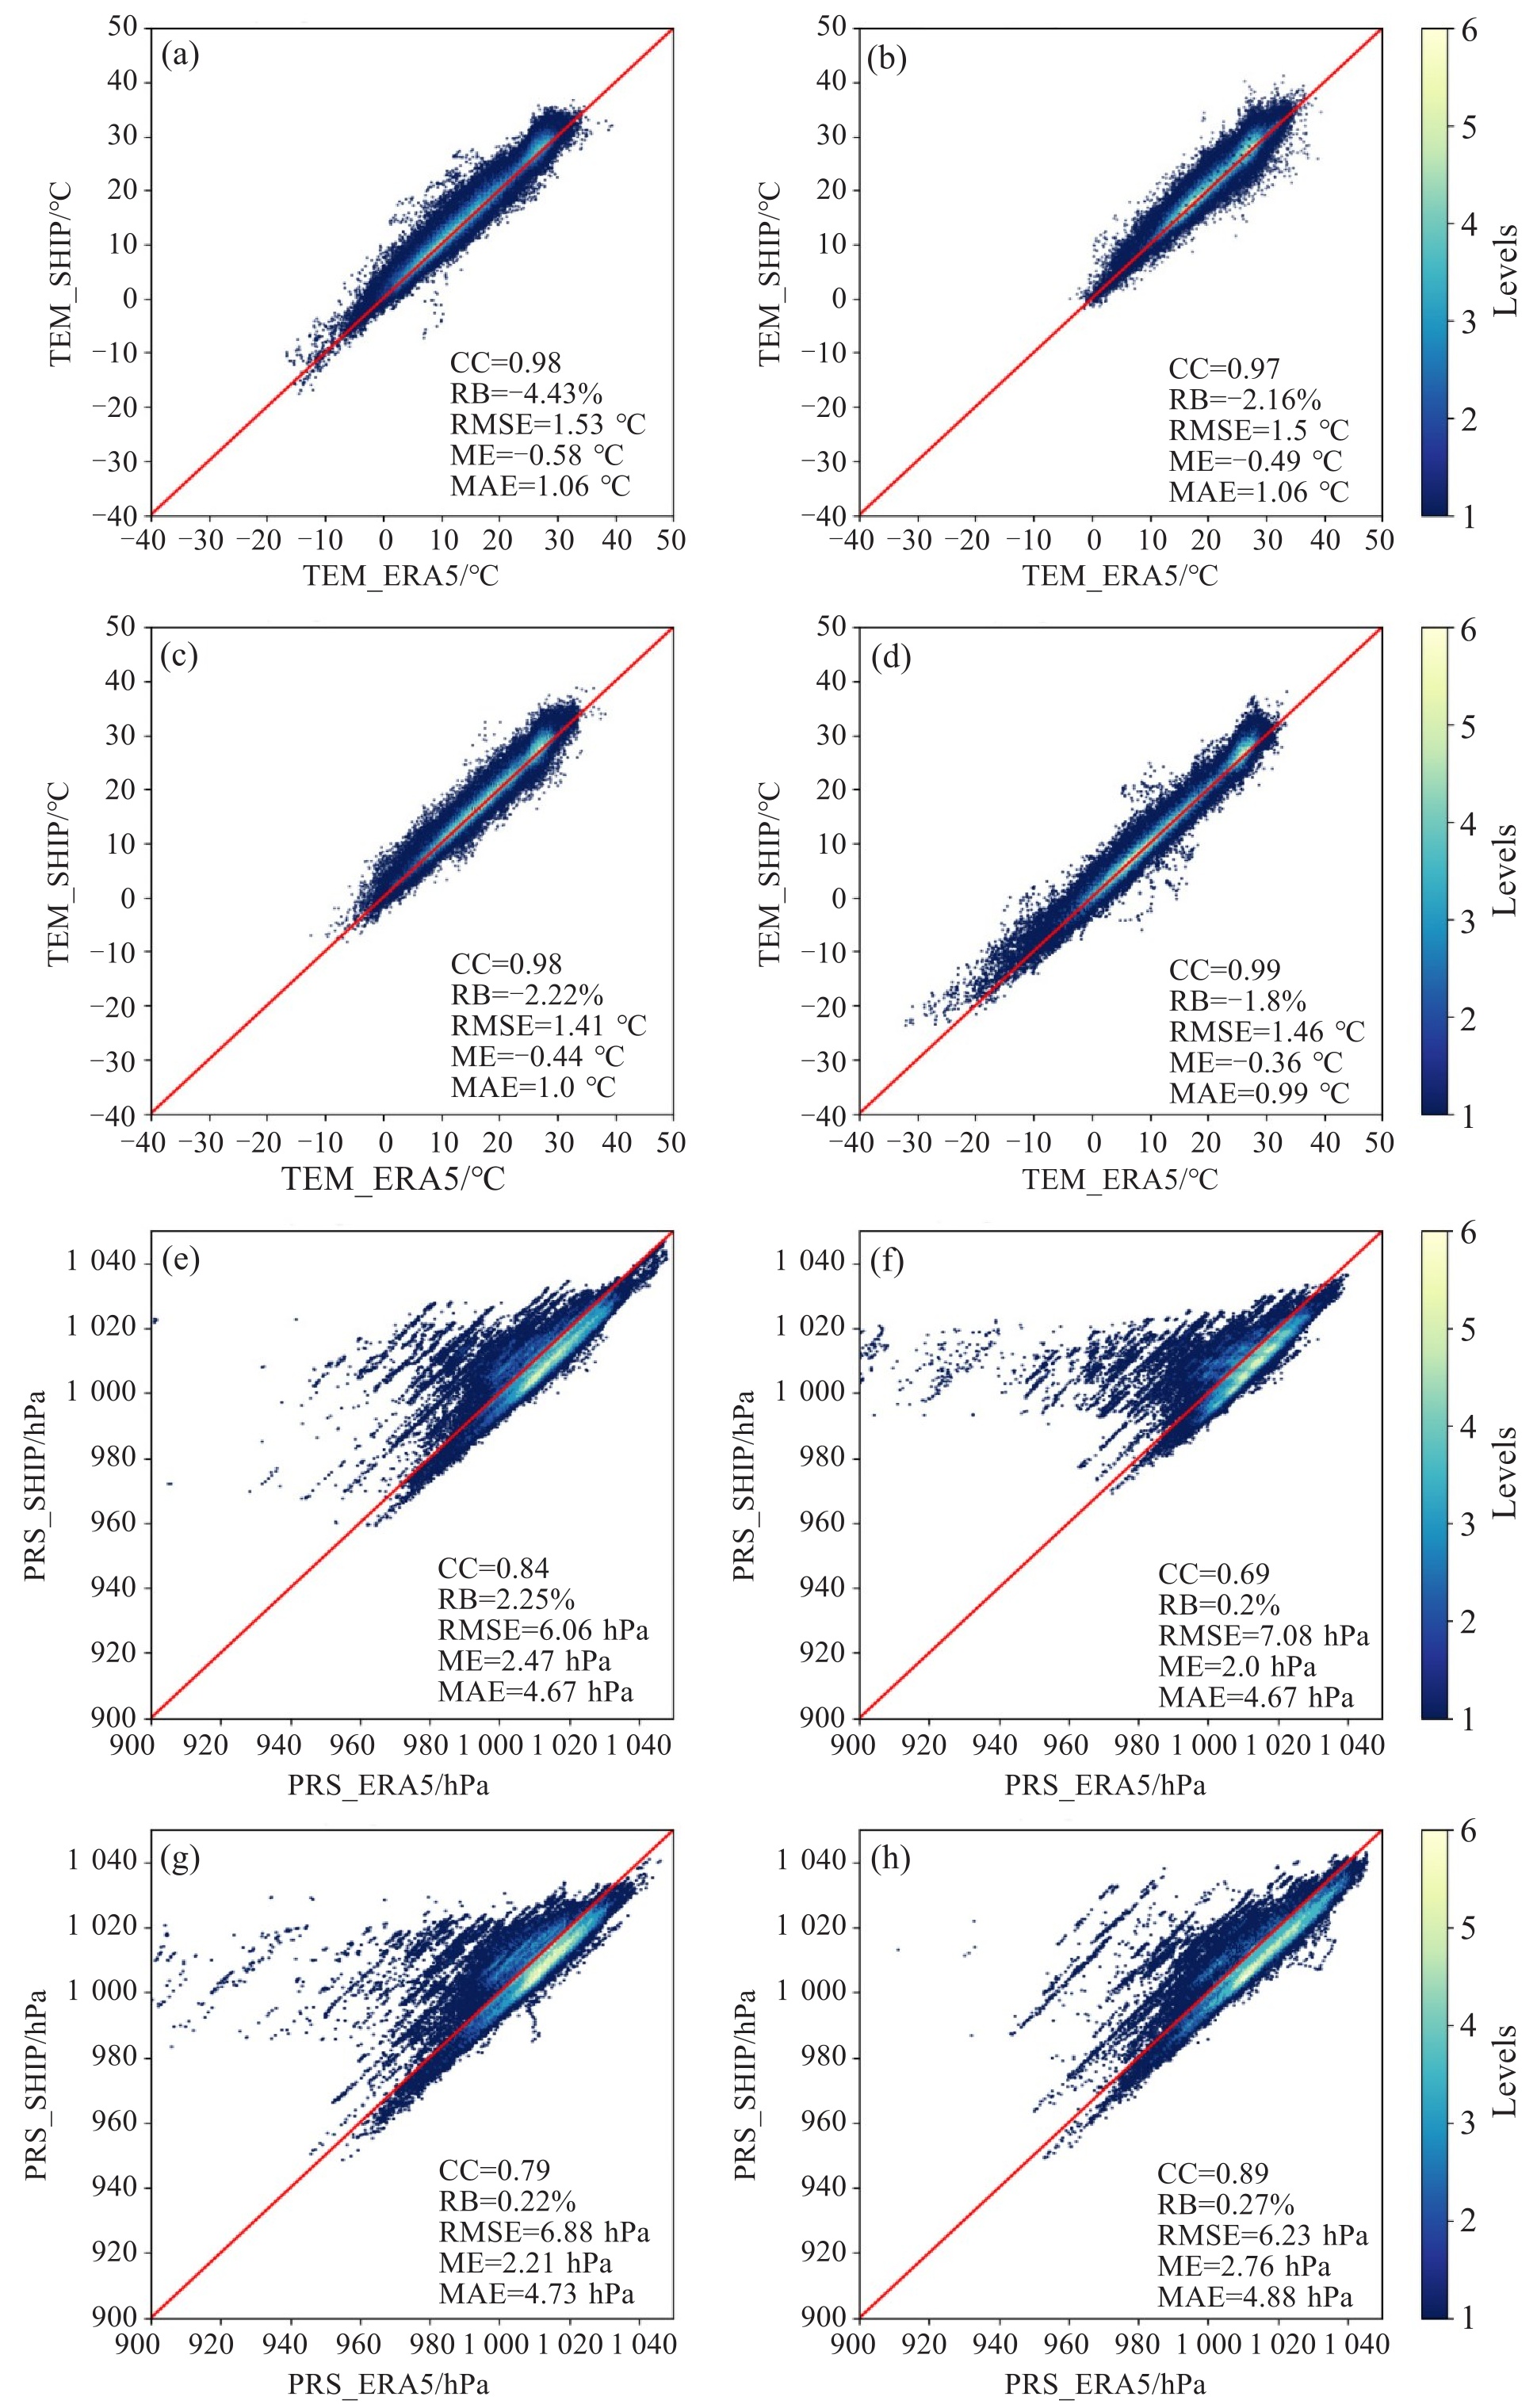
摘要: 本研究基于2021—2023年中国气象局气象大数据云平台提供的志愿观测船(VOS)数据,全面评估了ERA5再分析资料中2 m气温和2 m气压要素在全球海域,特别是西太平洋、北大西洋和印度洋三大洋区的适用性。评估过程中采用了相关系数(CC)、相对偏差(RB)、均方根误差(RMSE)、平均误差(ME)和平均绝对误差(MAE)等定量统计指标,以确保评估结果的准确性和可靠性。结果显示,ERA5气温和气压数据与VOS观测数据在整体上保持一致,但存在显著的误差。ERA5气温数据普遍低于VOS观测数据,且在不同季节表现出不同的误差特征。冬季气温数据质量最佳,CC值高达0.99,但西太平洋地区存在高估现象;夏季气温数据质量稍逊,离散程度较大。对于气压数据,夏季CC值最低,平均仅为0.68,且在印度洋的春、秋和冬季,CC值也相对较低,RMSE和MAE明显偏大。此外,气温数据还表现出明显的日变化特征,而气压数据则呈现出较为明显的区域性特征。虽然ERA5气温和气压数据在全球海域的整体上与VOS观测数据一致,但在具体数值上存在显著误差,且这些误差在不同季节、不同海域以及日变化上表现出不同的特征。因此,在使用ERA5数据进行海洋气象和海洋环流研究时,需要充分考虑其适用性和局限性,并进行必要的验证和校正,以确保研究结果的准确性和可靠性。Abstract: This study comprehensively evaluates the applicability of the 2-meter temperature and 2-meter pressure elements in the ERA5 reanalysis data over global oceans, particularly in the three major oceanic regions of the Western Pacific, North Atlantic, and Indian Ocean, based on Volunteer Observing Ship (VOS) data provided by the China Meteorological Administration's meteorological big data cloud platform from 2021 to 2023. Quantitative statistical indicators such as the correlation coefficient (CC), relative bias (RB), root mean square error (RMSE), mean error (ME), and mean absolute error (MAE) were employed in the evaluation process to ensure the accuracy and reliability of the results. The findings reveal that, while the overall trends of the ERA5 temperature and pressure data align with the VOS observations, significant errors exist. The ERA5 temperature data are generally lower than the VOS observations and exhibit different error characteristics across different seasons. Temperature data quality is best in winter, with a CC value as high as 0.99, but there is an overestimation in the Western Pacific; summer temperature data quality is slightly poorer, with greater dispersion. For pressure data, the CC value is lowest in summer, averaging only 0.68, and in the spring, autumn, and winter in the Indian Ocean, the CC values are also relatively low, with significantly larger RMSE and MAE values. Additionally, the temperature data exhibit clear diurnal variation characteristics, while the pressure data show more pronounced regional characteristics. Although the overall trends of the ERA5 temperature and pressure data align with the VOS observations over global oceans, there are significant errors in specific numerical values, and these errors exhibit different characteristics across different seasons, oceanic regions, and diurnal variations. Therefore, when using ERA5 data for marine meteorology and ocean circulation studies, it is necessary to fully consider its applicability and limitations and conduct necessary validation and correction to ensure the accuracy and reliability of the research results.
-
Key words:
- ERA5 /
- volunteer observing ship(VOS) /
- air temperature /
- pressure /
- North Atlantic /
- Western Pacific /
- Indian Ocean
-

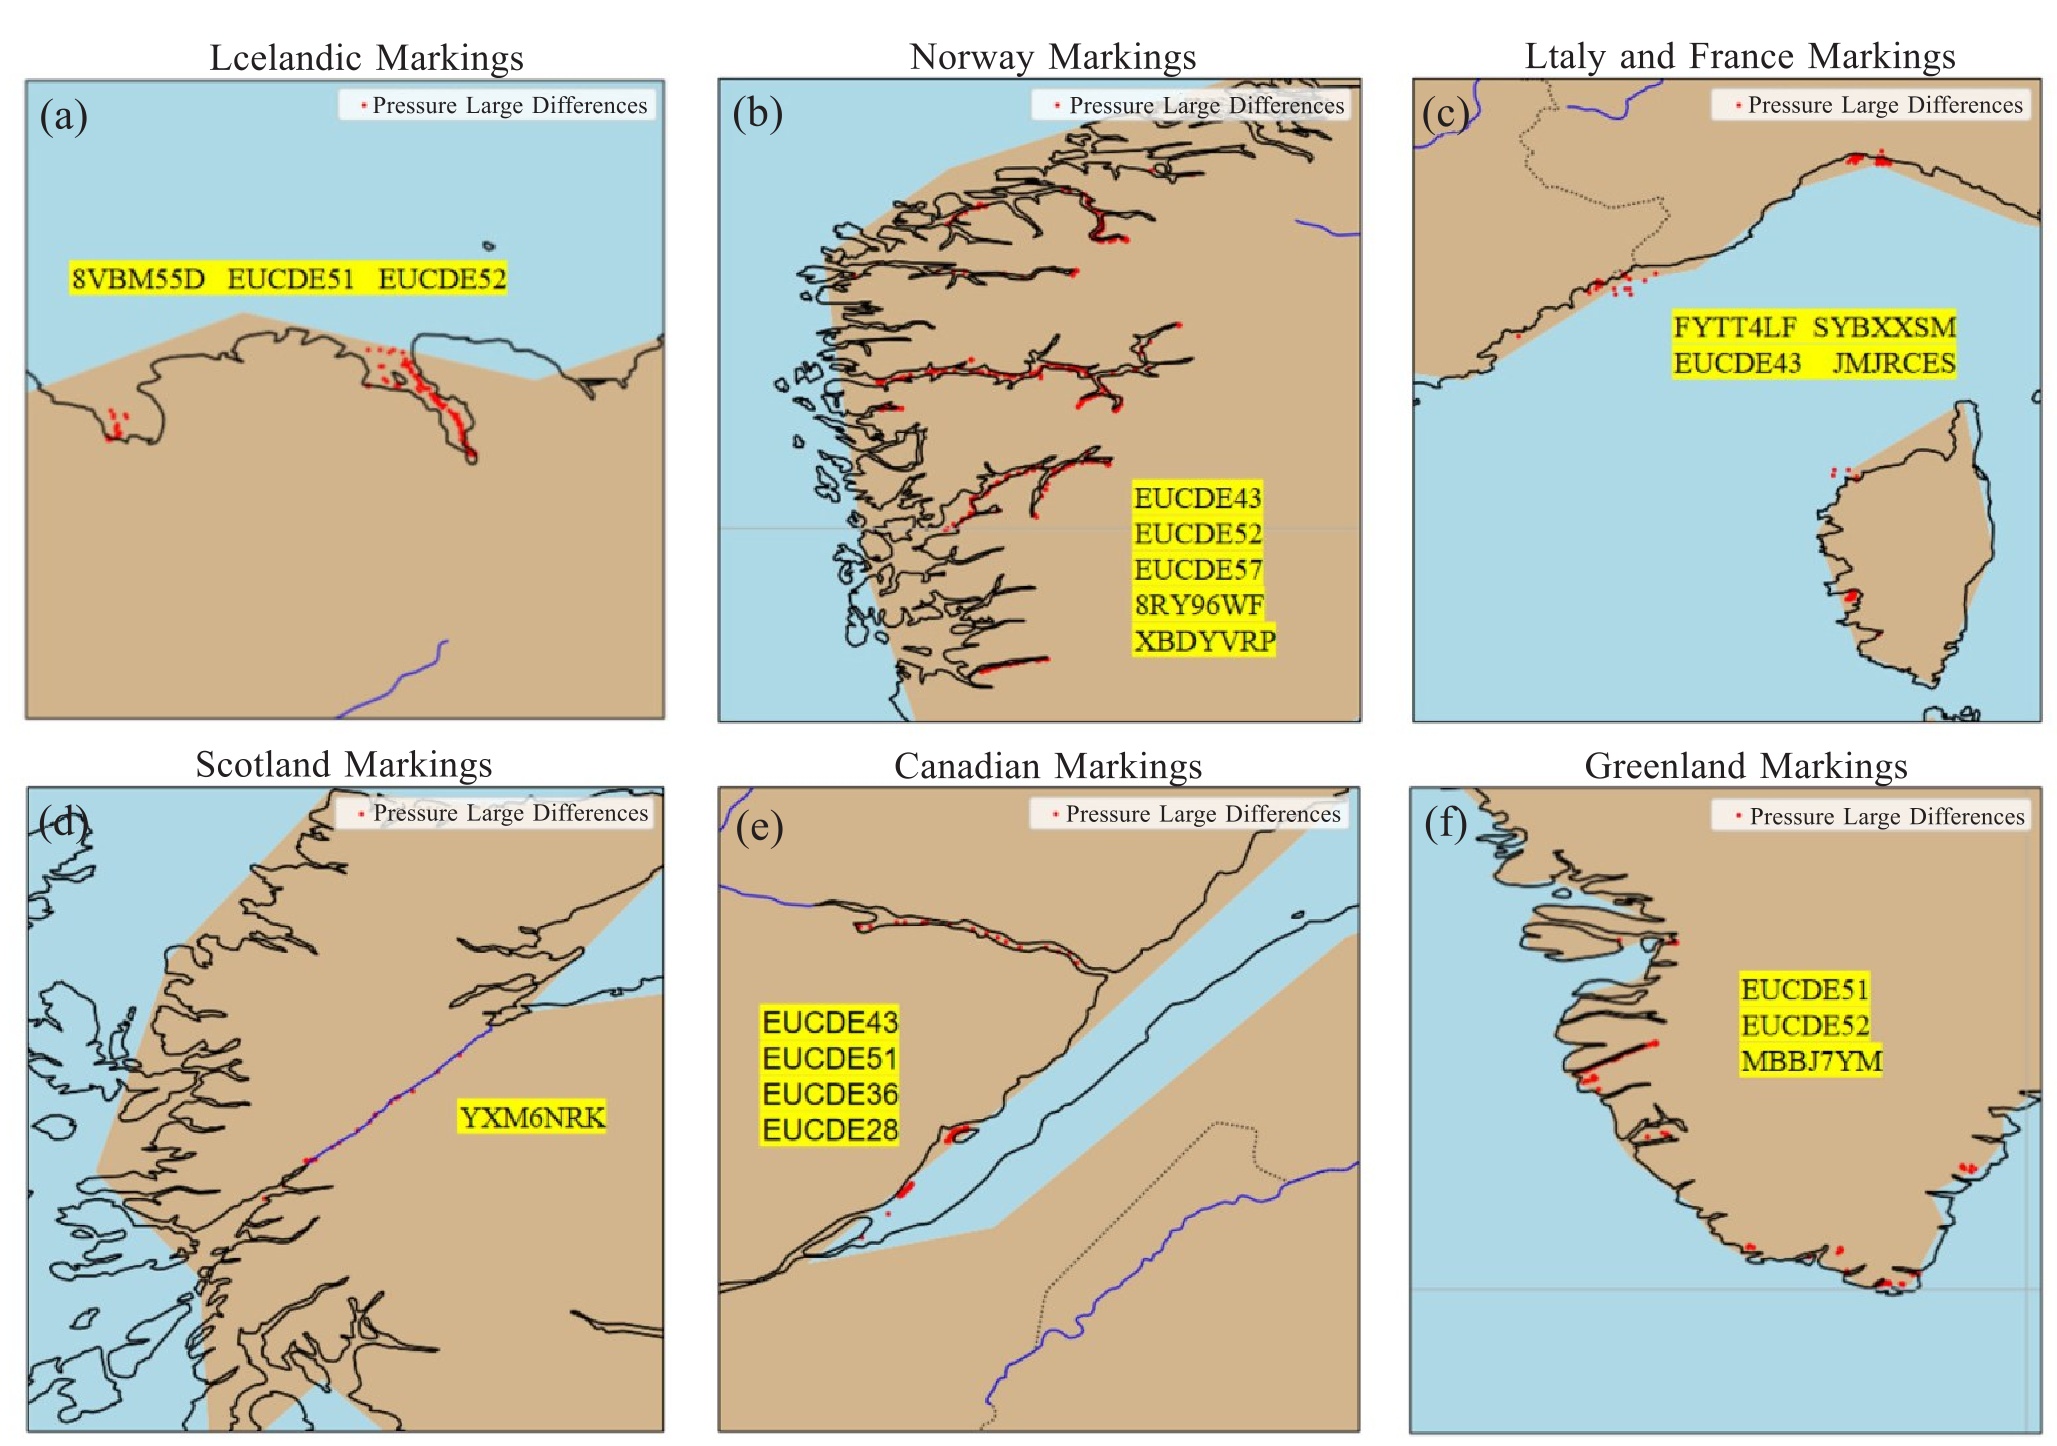
图 8 气压离散点所在海域分布
a.冰岛北部港湾,b.挪威西部港湾,c.意大利的南部港湾和法国西部部分港湾,d.斜穿英国苏格兰的内河,e.加拿大东部港湾,f.格陵兰岛南部的港湾。
表 1 2021—2023年全球VOS和ECV船舶数量及数据统计
年份 VOS到报数/艘 ECV到报数/艘 VOS到报数据量/万条 ECV到报数据量/万条 A、B、C区域/万条 可用率/% 2021 2 176 158 274.2 102.2 73.3 37.3 2022 3 048 191 490.6 132.2 91.0 26.9 2023 3 049 184 490.6 118.0 79.6 24.1 均值 2 758 178 418.5 117.5 81.3 29.4  下载: 导出CSV
表 2 2021—2023年三大洋区各季节ECV船舶和ERA5的气温指标特征
季节 区域 CC RB/% RMSE/℃ ME/℃ MAE/℃ 春季 北大西洋 0.98 -5.14 1.51 -0.60 1.04 西太平洋 0.97 -2.40 1.71 -0.51 1.21 印度洋 0.99 -1.34 1.36 -0.51 0.98 夏季 北大西洋 0.96 -2.41 1.52 -0.53 1.07 西太平洋 0.88 -0.81 1.51 -0.30 1.08 印度洋 0.99 -1.77 1.34 -0.45 0.98 秋季 北大西洋 0.98 -2.80 1.43 -0.49 1.00 西太平洋 0.98 0.41 1.40 -0.16 1.04 印度洋 0.99 -1.06 1.32 -0.40 0.93 冬季 北大西洋 0.99 -2.06 1.46 -0.44 0.98 西太平洋 0.99 -0.65 1.51 0.06 1.11 印度洋 0.99 -1.42 1.30 -0.46 0.93
下载: 导出CSV
表 3 2021—2023年三大洋区各季节ECV船舶和ERA5的气压指标特征
季节 区域 CC RB/% RMSE/hPa ME/hPa MAE/hPa 春季 北大西洋 0.86 0.21 5.85 2.15 4.31 西太平洋 0.79 0.45 6.21 4.56 5.7 印度洋 0.47 0.16 7.63 1.63 6.16 夏季 北大西洋 0.66 0.16 7.19 1.62 4.37 西太平洋 0.68 0.46 5.92 4.56 5.48 印度洋 0.69 0.20 7.53 1.99 6.29 秋季 北大西洋 0.80 0.18 7.02 1.77 4.45 西太平洋 0.84 0.47 5.99 4.71 5.58 印度洋 0.64 0.24 6.85 2.45 5.82 冬季 北大西洋 0.90 0.24 6.04 2.4 4.53 西太平洋 0.87 0.50 6.63 5.07 6.10 印度洋 0.55 0.19 7.09 1.93 5.85
下载: 导出CSV
表 4 2021—2023年ECV船舶数据量在三大洋的月变化(单位:万条)
月份区域 1 2 3 4 5 6 7 8 9 10 11 12 均值 北大西洋 14.2 13.5 14.9 14.5 16.4 16.1 16.5 16.9 16.6 16.2 15.4 11.1 15.2 西太平洋 2.9 2.2 2.9 3.1 2.8 2.6 3.1 2.8 2.5 3.2 3.1 1.8 2.8 印度洋 1.9 2.2 2.0 2.4 2.4 2.3 2.2 2.5 2.4 2.9 2.6 1.8 2.3
下载: 导出CSV
表 5 2021—2023年评价指标月变化
月份 洋区 CC RB/% RMSE ME MAE T P T P T/℃ P/hPa T/℃ P/hPa T/℃ P/hPa 1 北大西洋 0.99 0.92 -1.75 0.25 1.39 5.76 -0.40 2.54 0.93 4.48 西太平洋 0.99 0.84 -0.64 0.49 1.44 6.70 0.08 4.96 1.07 6.14 印度洋 0.99 0.59 -1.35 0.23 1.30 7.25 -0.47 2.29 0.90 5.89 2 北大西洋 0.98 0.89 -3.04 0.22 1.60 6.29 -0.54 2.21 1.04 4.60 西太平洋 0.99 0.87 1.05 0.52 1.49 6.64 0.04 5.22 1.10 6.13 印度洋 0.98 0.48 -1.53 0.15 1.29 6.89 -0.48 1.48 0.92 5.73 3 北大西洋 0.98 0.88 -6.53 0.21 1.56 6.09 -0.63 2.16 1.05 4.50 西太平洋 0.97 0.82 -2.69 0.47 1.79 6.14 -0.50 4.73 1.24 5.65 印度洋 0.98 0.48 -1.55 0.26 1.21 6.61 -0.48 2.66 0.87 5.55 4 北大西洋 0.98 0.85 -5.40 0.20 1.51 5.76 -0.64 2.01 1.04 4.21 西太平洋 0.97 0.79 -2.71 0.44 1.66 6.15 -0.55 4.47 1.19 5.66 印度洋 0.99 0.44 -1.61 0.04 1.46 8.38 -0.57 0.34 1.06 6.58 5 北大西洋 0.98 0.82 -3.61 0.22 1.47 5.70 -0.54 2.27 1.04 4.23 西太平洋 0.95 0.65 -1.75 0.45 1.69 6.34 -0.47 4.49 1.22 5.80 印度洋 0.99 0.51 -0.97 0.20 1.38 7.61 -0.48 2.01 0.99 6.21 6 北大西洋 0.97 0.68 -2.54 0.19 1.51 6.64 -0.52 1.88 1.08 4.26 西太平洋 0.92 0.60 -1.03 0.45 1.56 6.03 -0.36 4.55 1.14 5.59 印度洋 0.98 0.65 -1.73 0.13 1.42 7.64 -0.56 1.32 1.06 6.36 7 北大西洋 0.96 0.64 -2.43 0.15 1.51 7.64 -0.55 1.54 1.06 4.46 西太平洋 0.82 0.71 -0.51 0.45 1.43 5.92 -0.22 4.54 1.05 5.50 印度洋 0.98 0.62 -1.51 0.22 1.35 8.21 -0.47 2.13 0.99 6.73 8 北大西洋 0.96 0.66 -2.26 0.14 1.52 7.25 -0.51 1.46 1.06 4.38 西太平洋 0.73 0.72 -0.93 0.46 1.55 5.82 -0.34 4.60 1.07 5.34 印度洋 0.99 0.79 -2.06 0.25 1.26 6.68 -0.33 2.52 0.89 5.81 9 北大西洋 0.97 0.72 -3.25 0.17 1.54 6.86 -0.61 1.70 1.08 4.31 西太平洋 0.89 0.79 -0.61 0.50 1.35 5.78 -0.25 5.06 0.98 5.47 印度洋 0.99 0.65 -0.78 0.29 1.33 7.36 -0.31 2.95 0.92 6.08 10 北大西洋 0.97 0.77 -2.61 0.15 1.40 7.64 -0.47 1.55 0.98 4.48 西太平洋 0.96 0.82 0 0.47 1.48 6.10 -0.17 4.73 1.10 5.70 印度洋 0.99 0.64 -1.23 0.20 1.26 6.69 -0.41 1.98 0.91 5.76 11 北大西洋 0.99 0.87 -2.47 0.21 1.31 6.47 -0.37 2.12 0.92 4.60 西太平洋 0.99 0.82 1.68 0.44 1.35 6.05 -0.07 4.41 1.01 5.54 印度洋 0.98 0.60 -1.12 0.25 1.38 6.52 -0.48 2.55 0.98 5.64 12 北大西洋 0.99 0.88 -1.19 0.24 1.35 6.06 -0.35 2.46 0.95 4.51 西太平洋 0.99 0.89 -2.69 0.50 1.64 6.50 0.05 5.06 1.21 5.99 印度洋 0.98 0.58 -1.37 0.21 1.33 7.17 -0.41 2.12 0.96 5.96
下载: 导出CSV
-
[1] Jiang Z P, Yuan J J, Hartman S E, et al. Enhancing the observing capacity for the surface ocean by the use of Volunteer Observing Ship[J]. Acta Oceanologica Sinica, 2019, 38(7): 114-120. [2] Smith S R, Alory G, Andersson A, et al. Ship-based contributions to global ocean, weather, and climate observing systems[J]. Frontiers in Marine Science, 2019, 6: 434. [3] 梁顺林, 唐世浩, 张杰, 等. 全球气候数据集生成及气候变化应用研究[J]. 遥感学报, 2016, 20(6): 1491-1499. [4] Li Y Z, Wang J C. Technical development of operational in-situ marine monitoring and research on its key generic technologies in China[J]. Acta Oceanologica Sinica, 2023, 42(10): 117-126. [5] 刘向文, 李维京, 吴统文, 等. 从GTS获得的海洋温、盐资料在BCC海洋同化系统中的质量控制及同化结果初步分析[J]. 气象学报, 2011, 69(4): 672-681. [6] 张子瑾, 董晓龙. 基于FY-3C/MWHTS观测资料反演中低纬度海面气压[J]. 空间科学学报, 2020, 40(3): 364-375. [7] Kent E C, Berry D I. Quantifying random measurement errors in Voluntary Observing Ships' meteorological observations[J]. International Journal of Climatology, 2005, 25(7): 843-856. [8] 姜洪峰, 郑崇伟, 陈飞, 等. 西北太平洋海洋气象观测及统计产品数据集[J]. 中国科学数据, 2021, 6(1): 152-159. [9] Dai A G. The diurnal cycle from observations and ERA5 in surface pressure, temperature, humidity, and winds[J]. Climate Dynamics, 2023, 61(5): 2965-2990. [10] Ayman M., Salah Z., Tonbol K., et al. Evaluating ERA5 weather parameters data using remote sensing and in situ data over north red sea [C]//The International Archives of the Photogrammetry, Remote Sensing and Spatial Information Sciences: Volume XLⅧ-1/W2-2023, Cairo, Egypt: ISPRS Geospatial Week, 2023, [11] King J C, Marshall G J, Colwell S, et al. The performance of the ERA-interim and ERA5 atmospheric reanalyses over Weddell Sea pack ice [J]. Journal of Geophysical Research: Oceans, 2022, 127(9): e2022JC018805. [12] Geng S S, Shi X X, Yue X Y. Applicability analysis of the sea surface pressure and wind speed of ERA5 reanalysis data in the Bohai Sea and the Northern Huanghai Seas[J]. Marine Science Bulletin, 2022, 24(2): 1-16. [13] Shi H Y, Cao X F, Li Q J, et al. Evaluating the accuracy of ERA5 wave reanalysis in the water around China[J]. Journal of Ocean University of China, 2021, 20(1): 1-9. [14] 赵天保, 符淙斌. 应用探空观测资料评估几类再分析资料在中国区域的适用性[J]. 大气科学, 2009, 33(3): 634-648. [15] 刘婷婷, 朱秀芳, 张世喆, 等. ERA5再分析地面气温数据在中国区域的适用性分析[J]. 热带气象学报, 2023, 39(1): 78-88. [16] 王敏, 徐梅, 年飞翔, 等. 渤海海域海上观测站逐时气温和气压的质量控制分析[J]. 海洋预报, 2023, 40(3): 97-103. [17] 高清清, 李用留, 吉会峰, 等. 基于观测和再分析资料的气温、海表温度在江苏海域的比较分析[J]. 海洋开发与管理, 2024, 41(2): 131-140. [18] Schade N H, Heinrich H, Rosenhagen G. Regional evaluation of ERA-40 reanalysis data with marine atmospheric observations in the north sea area[J]. Meteorologische Zeitschrift, 2014, 22(6): 675-684. [19] Zhai R W, Huang C J, Yang W, et al. Applicability evaluation of ERA5 wind and wave reanalysis data in the South China Sea[J]. Journal of Oceanology and Limnology, 2023, 41(2): 495-517. [20] 陈君芝, 施晓晖, 温敏. ERA5再分析10m风速数据在"两洋一海"的适用性分析[J]. 气象, 2023, 49(1): 39-51. [21] 张杰, 孙伟富, 杨俊钢, 等. 海洋气候数据集生成与分析简介[J]. 海洋科学进展, 2019, 37(2): 325-331. [22] 南雪景, 汪冬冬, 李肖霞, 等. 基于船舶观测的全球海洋气象数据可用性分析[J]. 中国海洋大学学报(自然科学版), 2025, 55(4): 30-38. -

 点击查看大图
图(8) / 表(5)
计量
- 文章访问数: 4
- HTML全文浏览量: 1
- PDF下载量: 0
- 被引次数: 0
 粤公网安备 4401069904700003号